Morphological impact of manganese–cerium oxides on ethanol oxidation†
Huaju
Li
a,
Gongshin
Qi
b,
Tana
a,
Xiaojing
Zhang
a,
Wei
Li
*b and
Wenjie
Shen
*a
aState Key Laboratory of Catalysis, Dalian Institute of Chemical Physics, Chinese Academy of Sciences, Dalian, 116023, China. E-mail: shen98@dicp.ac.cn; Fax: +86 411 84694447
bGeneral Motors Global Research and Development, Chemical Sciences and Materials Systems Lab, 30500 Mound Road, Warren, MI 48090, USA. E-mail: wei.1.li@gm.com; Fax: +1 586 9472262
First published on 14th October 2011
Abstract
The shape of nanoparticles alters their catalytic performance significantly, but the intrinsic chemical nature of this morphology-dependent phenomenon is still less understood. Here, we report that the morphology of MnOx–CeO2 nanomaterials that are enclosed by {100} and {111} facets considerably affected the reaction rate and the product selectivity in ethanol oxidation. Kinetic investigation revealed that the {100} and the {111} planes had very close apparent activation energies, indicative of the common manganese active species, but the specific reaction rate on the {100} plane was two times greater than that on the {111} plane because of the intrinsically higher oxygen storage capacity. These results evidence that morphology control of binary oxides at the nanometre level could promote their catalytic properties substantially.
1. Introduction
Increasing use of ethanol-blended gasoline potentially reduces greenhouse gas emission from vehicles; however, it may increase emissions of ethanol, acetaldehyde, and formaldehyde.1 Catalytic abatement of these toxic oxygenates presents a new challenge in the emission control of gasoline-fueled engines. Improving the oxidation ability of the current three-way-catalysts (TWCs) towards these polluting oxygenates is of great importance for practical application. CeO2 is a major component in the TWCs and its unique property primarily benefits from the rapid and reversible Ce4+/Ce3+ redox cycle, making it an excellent oxygen buffer that is commonly defined as oxygen storage capacity (OSC).2 In addition to the well known particle size effect,2,3 the OSC as well as the catalytic property of ceria is also intimately associated with the shape of the particles.4,5 For example, CeO2 nanorods enclosed by the {110} and {100} planes are remarkably more active for CO oxidation than the traditional spherical nanoparticles that mainly expose the {111} planes.5,6 This is because the {100} and {110} surfaces are more reactive than the {111} surface, based on the higher mobility of their lattice oxygens.5,7The morphology of doped cerium oxides also affects their redox property and catalytic performance. One typical example is that zirconium–cerium oxide nanotubes, which preferentially expose the reactive {100} and {110} facets, not only have a much higher OSC than pure ceria nanotubes,8 but also are highly efficient for ethanol steam reforming.9 MnOx–CeO2 oxides have been reported to be highly active for the oxidations of formaldehyde10 and ethanol.11,12 However, most of the reports are focused on the size effect of the conventional spherical nanoparticles; little attention has been paid to the synthesis of MnOx–CeO2 nanomaterials with tunable morphology and the shape effect of this binary oxide on oxidation reactions. In this work, we examined the morphological impact of manganese–cerium oxide nanomaterials in the shapes of cubes and rods on ethanol oxidation.
2. Experimental section
Sample preparation
MnOx–CeO2 nanomaterials (nominal Mn/Ce molar ratio of 3/7) were synthesized by a hydrothermal process. Typically, 1.22 g Ce(NO3)3·6H2O and 0.21 g Mn(NO3)2 were dissolved in 20 mL water; the mixture was then slowly added to 60 mL 10 mol L−1 (nanocubes) or 2 mol L−1 (nanorods) NaOH aqueous solutions under vigorous stirring. The slurry was transferred to an autoclave (100 mL) and maintained at 423 K for 12 h (nanocubes) or at 373 K for 24 h (nanorods). The resultant solids were washed with hot water, dried at 353 K overnight and finally calcined at 673 K for 4 h in air. ICP analyses revealed that the actual chemical compositions were Mn0.19Ce0.81O1.87 for the nanocubes and Mn0.26Ce0.74O1.88 for the nanorods, respectively.Characterization
N2 adsorption–desorption isotherms were recorded at 77 K using an ASAP 2000 instrument (Micromeritics). The specific surface areas were calculated by using the BET equation from the adsorption isotherms. XRD patterns were recorded on a D/Max-2500/PC diffractometer (Rigaku) using Cu Kα radiation (λ = 0.15406 nm) operated at 40 kV and 200 mA, the mean crystallite size was calculated from the half-width of the (111) line.Transmission electron microscopy (TEM) images were recorded on a FEI Tecnai G2 Spirit microscope operated at 120 kV, and high resolution TEM (HRTEM) images were taken on a FEI Tecnai G2 F30S-Twin microscope operated at 300 kV. The specimen was prepared by ultrasonically dispersing the sample powder in ethanol, and droplets of the suspension were deposited on a carbon-coated copper grid and dried in air.
Hydrogen temperature-programmed reduction (H2-TPR) was carried out with an Autochem II 2920 instrument (Micromeritics) equipped with a thermal conductivity detector (TCD). 60 mg samples were heated to 873 K at a ramp of 10 K min−1 under a flow of a 10 vol% H2/Ar mixture (50 mL min−1). Oxygen storage capacity was then measured by cooling the sample down to 473 K in Ar flow, followed by oxygen pulsing until saturation.
Catalytic evaluation
Ethanol oxidation reactions were conducted in a fixed-bed quartz tubular reactor under atmospheric pressure between 413 and 493 K. 60 mg catalysts (40–60 mesh) were loaded to the reactor, the typical feed gas consisted of 0.16 vol% ethanol and 20 vol% O2 balanced with N2 with a flow rate of 50 mL min−1 (50![[thin space (1/6-em)]](https://www.rsc.org/images/entities/char_2009.gif) 000 mL g−1 h−1). Kinetic measurements were conducted by adjusting the conversion of ethanol to below 15% through varying the gas hourly space velocity (GHSV) in order to calculate the reaction rates under the differential reactor conditions. The effluent from the reactor was analyzed by an on-line HP 6890 gas chromatograph equipped with a TCD and a flame ionization detector (FID). To quantitatively determine the concentrations of CO and CO2 in the product, a nickel catalyst converter was placed before the FID and used for converting CO and CO2 into methane. The conversion of ethanol and the selectivity of the products were calculated on the basis of carbon numbers as described elsewhere.12
000 mL g−1 h−1). Kinetic measurements were conducted by adjusting the conversion of ethanol to below 15% through varying the gas hourly space velocity (GHSV) in order to calculate the reaction rates under the differential reactor conditions. The effluent from the reactor was analyzed by an on-line HP 6890 gas chromatograph equipped with a TCD and a flame ionization detector (FID). To quantitatively determine the concentrations of CO and CO2 in the product, a nickel catalyst converter was placed before the FID and used for converting CO and CO2 into methane. The conversion of ethanol and the selectivity of the products were calculated on the basis of carbon numbers as described elsewhere.12
3. Results and discussion
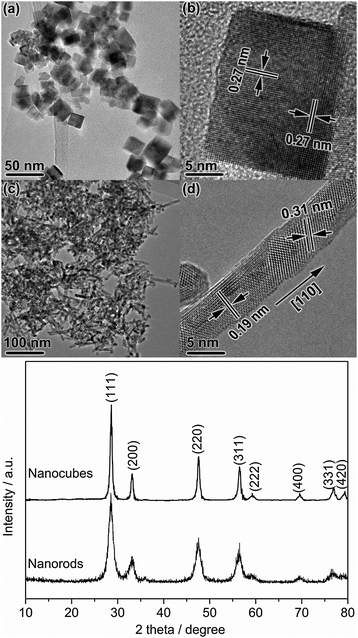
Fig. 1 shows the TEM images of the MnOx–CeO2 nanomaterials. The nanocubes had an average particle diameter of about 18 nm (Fig. S1a, ESI†), and the interplanar spacing of 0.27 nm together with the electron diffraction pattern confirmed the exclusive exposure of the {100} planes. The nanorods had an average diameter of about 7 nm and an average length of 70 nm with an aspect ratio of about 10 (Fig. S1b, ESI†). The single crystal nanorod grew along the [110] direction with a hexangular cross section. When viewed along the [001] orientation, the nanorod exposed the {111} plane with a typical lattice spacing of 0.31 nm and the {100} plane with an interplanar spacing of 0.27 nm. Taking all these images into account, the real shape of the nanorod was approximately determined to be a hexangular prism which was surrounded by four {111} (74%) and two {100} (26%) planes. | ||
| Fig. 1 Low- and high-magnification TEM images of MnOx–CeO2 nanostructures: nanocubes (a, b) and nanorods (c, d). | ||
Fig. 2a shows the XRD patterns of the MnOx–CeO2 materials. Typical diffraction lines of ceria fluorite structure (PDF # 43-1002) were observed in both samples, but no diffraction line of manganese oxides was detected. This is because that the phase composition of MnOx–CeO2 oxides is closely related to the molar ratio of manganese and cerium, and that they have the tendency to form solid solutions when the molar ratio of Mn/Ce is less than 1.0.13,14 The nanorods exhibited broad diffraction lines with the mean crystallite size of 6.2 nm, and the nanocubes had a relatively larger crystallite size of about 14.1 nm, estimated from the most intense (111) diffraction line. Accordingly, the surface areas were 99 m2 g−1 for the nanorods and 41 m2 g−1 for the nanocubes (Table 1). In addition, both samples exhibited higher Bragg angles and lower lattice parameters than pure ceria (Table S1, ESI†), indicating the formation of solid solutions.11,12 Furthermore, the molar ratio of Mn/Ce was almost identical in the bulk and on the surface (Table S2, ESI†), implying the homogeneous dispersion of manganese and cerium ions in the solid solutions. These results clearly evidence that the morphology of the binary oxides is predominately determined by ceria crystalline structure while the manganese ions have incorporated into the ceria lattice.
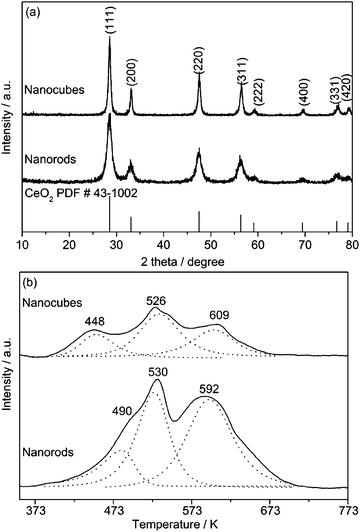 | ||
| Fig. 2 (a) XRD patterns and (b) H2-TPR profiles of the MnOx–CeO2 nanostructures. | ||
The redox properties of the binary oxides were examined by H2-TPR (Fig. 2b). The nanorods showed two distinct reduction peaks, together with a minor shoulder reduction peak. The peak at 490 K represented the easy reduction of MnO2 to Mn2O3, and the peak at 530 K was the further reduction of Mn2O3 to Mn3O4, while the peak at 592 K corresponded to the combined reductions of Mn3O4 to MnO and surface Ce4+ to Ce3+ species.10,11 A similar reduction profile was observed for the nanocubes except that the low temperature reduction peak shifted to 448 K that might be caused by the facile reduction of manganese ions on the {100} surfaces. According to XPS analyses (Fig. S2 and Table S2, ESI†), the average oxidation states of manganese in the nanocubes and nanorods were 2.8 and 3.3, respectively. The amount of hydrogen consumed on the nanorods (1540 μmol H2 g−1) was much larger than that on the nanocubes (687 μmol H2 g−1) (Table S3, ESI†), but the OSC of the former was only slightly higher (356 μmol O2 g−1) than that of the latter (245 μmol O2 g−1), when measured at 473 K. This discrepancy is likely caused by the fact that the hydrogen reduction occurs both on the surface and in the bulk in the TPR process, but the subsequent oxygen titration to measure the OSC mainly involves refilling the surface oxygen vacancies.
The lower OSC of the nanocubes is apparently due to the large particle size. When normalized with the surface area, however, the specific OSC showed a reverse order: nanocubes > nanorods (Table 1). According to the surface fractions of the {100} and {111} planes on the MnOx–CeO2 nanostructures, the specific OSC of the {100} plane was estimated to be much higher than that of the {111} plane. This agrees well with the general understanding that the {100} plane has the highest surface energy compared with other low indexed facets like {110} and {111}.15–17 This highly reactive surface is chemically originated from the instability of the top-layer oxygen, which is located at the bridging position between two cerium ions.18
The catalytic properties of the MnOx–CeO2 nanomaterials were investigated for ethanol oxidation. Total conversion of ethanol was achieved at 493 K on the nanorods while it was obtained at 513 K on the nanocubes (Fig. 3a). Acetaldehyde and CO2 were formed as the major products while minor ethyl acetate and CO were produced at low temperatures. In the temperature range examined, the nanorods showed a higher selectivity towards CO2 and a lower selectivity towards acetaldehyde. This superior performance of the nanorods is mainly assigned to the higher surface area, and also more Mn4+ species that were usually active for the oxidation reactions.10,19 In other words, the inferior catalytic performance of the nanocubes was caused by the low surface area and relatively less Mn4+ species (Table S2, ESI†). When the reaction rate was normalized to the surface area, however, the results become particularly revealing. As shown in Fig. 3b, the nanocubes had substantially higher specific rates for ethanol conversion and acetaldehyde/CO2 formation, and the difference was considerably larger above 453 K.
 | ||
| Fig. 3 Ethanol oxidation on the MnOx–CeO2 nanostructures: (a) the overall performance, and (b) the specific reaction rates. In all the tests, acetaldehyde and carbon dioxide were formed as the major products. Ethyl acetate and CO were detected as the minor products at low temperatures. The selectivity of ethyl acetate was less than 10% with a maximum at 413 K while the selectivity of CO was below 5%. They almost disappeared when the conversion of ethanol reached 80%. | ||
To elucidate the catalytic nature of the exposed planes in ethanol oxidation, kinetic measurements were then conducted at low ethanol conversions. As shown in Fig. 4, the conversion rate of ethanol on the {100} plane was almost two times greater than that on the {111} surface, in good correlation with the specific OSC measured at 473 K. A similar result was observed for the production of acetaldehyde, but the formation rate of CO2 on the {100} plane was only marginally higher than the {111} facet. This indicates that the oxidation of ethanol to acetaldehyde is faster on the {100} plane, whereas the subsequent oxidation of acetaldehyde to CO2 proceeds very slowly on both surfaces. The activation energies of ethanol conversion, acetaldehyde and carbon dioxide formation on the {100} planes were 53.9, 49.8, and 108.9 kJ mol−1, respectively, which were almost the same as those on the {111} planes (Table S4, ESI†). This kinetic feature implies that ethanol oxidation follows a Mars-van Krevelen mechanism that necessitates the participation of the lattice oxygen in the solid catalyst.19,20 Ethanol is initially oxidized by MnO2, the restoration of manganese oxidation state is realized by using the oxygen species originated from CeO2, and the partially reduced CeO2−x is then replenished by molecular oxygen in the feed gas. In such a model, MnO2 acted as the active site on both planes while CeO2 served as an oxygen reservoir, and thus the mobility of surface oxygen species on the exposed planes played a vital role. In fact, the surface energy of the {100} plane (2.88 J m−2) is much higher than that of the {111} plane (1.39 J m−2),21 resulting in a greater OSC.4,22 Therefore, the MnOx–CeO2 nanocubes that are enclosed by the most reactive {100} planes had much higher specific reaction rates. That is, the morphology governed by CeO2 indirectly but essentially affected the oxidation rate of ethanol.
 | ||
| Fig. 4 Reaction rates of the {100} and {111} planes in ethanol oxidation. The conversion of ethanol was adjusted to below 15% in the tests in order to calculate the reaction rates under differential reactor conditions. | ||
The morphological impact on the catalytic performance has been well documented in CeO2 nanomaterials. The {100}- and {110}-dominated surfaces are usually more reactive than the {111}-dominated ones,4 as typically verified in CO oxidation where CeO2 nanorods showed distinctively higher activity than the spherical nanoparticles.5,6 This morphology-dependent effect is also applicable to the MnOx–CeO2 oxides, characterized by the intrinsic activity order {100} > {111}. However, the large particle size (about 18 nm) of the MnOx–CeO2 nanocubes leads to a much lower surface area and in turn inferior overall reaction efficiency, like most CeO2 nanocubes.23,24 But it is reasonable to expect that the binary oxide nanocubes would show exceptionally high activity in oxidation reactions provided that the cubic size could be further reduced.
The MnOx–CeO2 nanomaterials also exhibited good stability in ethanol oxidation at 473 K for 80 h on-stream (Fig. 5). During the early 10 hours, the conversion rate of ethanol decreased considerably; the formation rate of acetaldehyde increased but the production rate of CO2 decreased significantly. At the steady-state, the reaction proceeded stably on the nanocubes with a much higher ethanol conversion rate and acetaldehyde formation rate, whereas the nanorods had a slight deactivation with time on-stream. These variations in the reaction rates are apparently caused by the restructuring of the nanostructures under the reaction conditions.
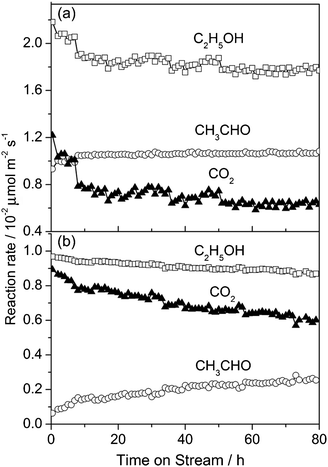 | ||
| Fig. 5 Long-term stability tests of MnOx–CeO2 nanocubes (a) and nanorods (b) for ethanol oxidation at 473 K. | ||
Fig. 6 shows the TEM images and the XRD patterns of the used MnOx–CeO2 samples. The nanocubes became less uniform with the appearance of smaller particles, decreasing the {100} planes while increasing the {111} planes slightly. The nanorods had broken into shorter ones but the exposed planes kept almost unchanged. Because of this, the surface areas of the nanocubes and nanorods slightly increased to 48 and 109 m2 g−1, respectively. However, the average crystalline sizes of the nanocubes (14.0 nm) and nanorods (6.1 nm) were almost unchanged. However, the surface of the nanorods became rough perhaps due to the loss of oxygen species during the course of reaction, and there might be carbon deposits that caused the surface inaccessible to gas-phase molecules and thus lowered the activity.
 | ||
| Fig. 6 TEM images and XRD patterns of the used MnOx–CeO2 samples after 80 h on-stream for ethanol oxidation at 473 K. (a, b) nanocubes and (c, d) nanorods. | ||
4. Conclusions
We have hydrothermally fabricated MnOx–CeO2 nanocubes and nanorods and found that the morphology significantly altered the oxygen storage capacity and the specific reaction rates in ethanol oxidation, showing a salient morphology-dependent phenomenon that was mainly originated from the chemical properties of the exposed facets. The {100} plane exhibited two times greater reaction rates than that of the {111} plane. This result provided sound evidence that the manganese–cerium oxide nanocubes could be intrinsically active in oxidation reactions as long as their size can be tuned small enough that is comparable to the nanorods.Acknowledgements
Financial support from the National Natural Science Foundation of China (20923001 and 21025312) is acknowledged.References
- A. K. Agarwal, Prog. Energy Combust. Sci., 2007, 33, 233 CrossRef CAS.
- A. Trovarelli, Catal. Rev. Sci. Eng., 1996, 38, 439 CAS.
- S. Carrettin, P. Concepcion, A. Corma, J. M. L. Nieto and V. F. Puntes, Angew. Chem., Int. Ed., 2004, 43, 2538 CrossRef CAS.
- H. X. Mai, L. D. Sun, Y. W. Zhang, R. Si, W. Feng, H. P. Zhang, H. C. Liu and C. H. Yan, J. Phys. Chem. B, 2005, 109, 24380 CrossRef CAS.
- K. Zhou, X. Wang, X. Sun, Q. Peng and Y. Li, J. Catal., 2005, 229, 206 CrossRef CAS.
- Tana, M. Zhang, J. Li, H. Li, Y. Li and W. Shen, Catal. Today, 2009, 148, 179 CrossRef CAS.
- G. Yi, Z. Xu, G. Guo, K.-I. Tanaka and Y. Yuan, Chem. Phys. Lett., 2009, 479, 128 CrossRef CAS.
- Y. C. Chen, K. B. Chen, C. S. Lee and M. C. Lin, J. Phys. Chem. C, 2009, 113, 5031 CAS.
- W. T. Chen, K. B. Chen, M. F. Wang, S. F. Weng, C. S. Lee and M. C. Lin, Chem. Commun., 2010, 46, 3286 RSC.
- X. Tang, Y. Li, X. Huang, Y. Xu, H. Zhu, J. Wang and W. Shen, Appl. Catal., B, 2006, 62, 265 CrossRef CAS.
- D. Delimaris and T. Ioannides, Appl. Catal., B, 2008, 84, 303 CrossRef CAS.
- H. Li, G. Qi, Tana, X. Zhang, X. Huang, W. Li and W. Shen, Appl. Catal., B, 2011, 103, 54 CrossRef CAS.
- M. Machida, M. Uto, D. Kurogi and T. Kijima, Chem. Mater., 2000, 12, 3158 CrossRef CAS.
- H. Chen, A. Sayari, A. Adnot and F. Larachi, Appl. Catal., B, 2001, 32, 195 CrossRef CAS.
- T. X. T. Sayle, S. C. Parker and C. R. A. Catlow, Surf. Sci., 1994, 316, 329 CrossRef CAS.
- J. Conesa, Surf. Sci., 1995, 339, 337 CrossRef CAS.
- F. Dang, K. Kato, H. Imai, S. Wada, H. Haneda and M. Kuwabara, Cryst. Growth Des., 2010, 10, 4537 CAS.
- H. Norenberg and J. H. Harding, Surf. Sci., 2001, 477, 17 CrossRef CAS.
- V. P. Santos, M. F. R. Pereira, J. J. M. Orfao and J. L. Figueiredo, Top. Catal., 2009, 52, 470 CrossRef CAS.
- Y. C. Son, V. D. Makwana, A. R. Howell and S. L. Suib, Angew. Chem., Int. Ed., 2001, 40, 4280 CrossRef CAS.
- C. Stanek, A. Tan, S. Owens and R. Grimes, J. Mater. Sci., 2008, 43, 4157 CrossRef CAS.
- J. Zhang, H. Kumagai, K. Yamamura, S. Ohara, S. Takami, A. Morikawa, H. Shinjoh, K. Kaneko, T. Adschiri and A. Suda, Nano Lett., 2011, 11, 361 CrossRef CAS.
- C. Pan, D. Zhang, L. Shi and J. Fang, Eur. J. Inorg. Chem., 2008, 2429 CrossRef CAS.
- R. Si and M. Flytzani-Stephanopoulos, Angew. Chem., Int. Ed., 2008, 47, 2884 CrossRef CAS.
Footnote |
| † Electronic supplementary information (ESI) available: Structure parameters, specific reaction rates, particle size distributions, and XPS analyses of the samples. See DOI: 10.1039/c1cy00308a |
| This journal is © The Royal Society of Chemistry 2011 |