Selective orthobutylation of phenol over sulfated Fe2O3–TiO2
Received
7th May 2011
, Accepted 10th June 2011
First published on 4th July 2011
Abstract
Sulfated Fe2O3–TiO2 (SFT) has been synthesized by an organic-free method employing ilmenite ore. Various SFT samples were prepared by drying and calcining over 100–900 °C. The XRD patterns of the system showed the presence of anatase and rutile phases of TiO2 and Fe2O3. The XRF analysis and DRIFT spectra demonstrated the presence of sulfate moieties, with their content being ≥8.1 wt% for samples calcined at ≤500 °C. The number of Brønsted and Lewis acid sites of the samples calcined at ≤500 °C was found to be nearly the same as that observed from pyridine adsorption measurements. The SFT samples were found to be thermally stable up to 500 °C. The SFT samples exhibited catalytic activity for the ortho-alkylation of phenol with tert-butanol. The activity for the SFT samples calcined at ≤500 °C was 5–8 times greater than that for the samples calcined at 700 and 900 °C. The decrease in the catalytic activity of the samples in the latter cases is due to the decreased acidity of the catalysts arising from the removal of sulfate species on calcination. The sulfated Fe2O3–TiO2 catalyst exhibited greater activity than similar higher surface area materials.
1. Introduction
Certain phenolic compounds are effective antioxidants that can be useful in a wide range of applications such as petroleum products, plastics and lubricants where increased oxidative stability is desirable. Catalytic alkylation of phenols by olefins or alcohols especially at the ortho position has some relevance since alkylation at the ortho position is not favoured both sterically and thermodynamically. Catalysts like cation-exchange resins,1aluminium chloride–zinc chloride,2 supported phosphoric acid,3sulfuric acid4 and microporous molecular sieves5 have been employed for the butylation of phenol. The amorphous mixed oxides containing sulfated zirconia and titania,6 modified clays,7 immobilized Al-based ionic liquids8 and mesoporous materials9–13 are known to yield alkylated phenolic compounds. Vinu et al.9 reported a phenol conversion of 95% and a 4-TBP selectivity of 80% at 275 and 200 °C, respectively, over FeSBA-1. Selvam and co-workers reported the tert-butylation of phenol over AlMCM-41,10FeMCM-41,11AlMCM-48,12 and sulfated zirconia.13 They reported a conversion of 58–60% at 175 °C and a selectivity of 80–95% for 4-TBP (4-tert-butyl phenol). The SBA's and MCM's are mesoporous materials with a pore size of 2–3 nm. Hence, when the reaction was performed over these catalysts the possibility for surface reaction is scarce as there are only about 5% of the acidic sites present on the surface. This phenomenon is also established by the product distribution obtained over these catalysts for butylation of phenol. Kamalakar et al.14,15 reported tert-butylation of phenol in supercritical CO2 on heteropolyacids supported on MCM-41 and H-Y zeolites. They reported that the yields of 2,4-DTBP (2,4-di-tert-butyl phenol) and 2,4,6-TTBP were influenced by supercritical CO2. Modrogan et al.16 studied the alkylation of phenol with iso-butene on a phosphonium ion mobilized on silica, amberlyst-15 and reported a phenol conversion of 100% and a selectivity of 78% for 2,4-DTBP over WO3/ZrO2 at 90 °C. Dumitrin and Hulea17 reported a phenol conversion of 50% and a 4-TBP selectivity of 63% and 82% over USY and zeolite β, respectively. Firth18 reported 71% of 2,4-DTBP over fluorided alumina at 250 °C. These reports suggest the use of porous materials for the butylation of phenol. The notably important 2,6-DTBP product was not obtained over these catalysts. Kupper19 reported 88% selectivity of 2,6-DTBP and 99.8% conversion of phenol over the aluminium tris-(phenolate) complex at 125 °C with pressures up to 25 bar. However, the reaction was performed by a two stage process by alkylating phenol with isobutene to get 2-TBP and thereafter reacting isobutene with 2-TBP to get 2,6-DTBP. The catalytic activity of TiO2,20–22ZrO2,23,24 and Fe2O325,26 was found to increase for acid-catalyzed reactions such as isomerization, dehydration, esterification, acylation, hydrocracking and the partial oxidation of methane27–32 by the addition of a sulfate ion. The present study deals with the synthesis of sulfated Fe2O3–TiO2 using ilmenite and H2SO4 as the starting materials. In particular, it is proposed to evaluate the effect of the variation of the sulfate content of the samples on the observed activity by calcining the samples at various temperatures. For this purpose, the catalyst samples have been characterized by XRD, surface area, acidity by the adsorption of pyridine, DRIFT spectra and TG/DTA. Butylation of phenol employing tert-butanol as the alkylating agent was examined over sulfated Fe2O3–TiO2 (SFT) catalysts with different sulfate contents and the results are evaluated by comparison with high surface area phosphated and sulfated titania catalysts.
2. Experimental
Synthesis of sulfated Fe2O3–TiO2
Ball-milled ilmenite ore, 10 g, was homogenously mixed with 20 g of conc. H2SO4 and aged for 2 h at 30 °C. To this, 10 g of water was added with stirring for about one hour. Thereafter, the reaction mass was treated with 100 g of water to remove the soluble residues and was dried at 100 °C for 12 h. The catalyst sample is a colloidal material and requires several washings with water to get dry powder. Subsequently, the sample was calcined at various temperatures to prepare the sulfated Fe2O3–TiO2 samples (SFT) containing differing contents of sulfate. The analysis of the H2SO4-treated ilmenite ore showed the composition as 55 wt% of TiO2, 42 wt% of Fe3O4, 2.9 wt% of SiO2 with traces of alumina, zirconia, vanadia and chromia. All the SFT samples dried and calcined at various temperatures are denoted as SFT-100, SFT-300, SFT-500, SFT-700 and SFT-900, where the numbers indicate the temperature.
The tert-butylation of phenol was carried out in a 100 ml autoclave in the temperature interval of 75 to 200 °C. About 0.5 g of the SFT catalyst was placed in the autoclave, to this 5 g of the mixture containing phenol and tert-butanol was added with varying mole ratios of 1![[thin space (1/6-em)]](https://www.rsc.org/images/entities/char_2009.gif) :0.5, 1:1, 1:1.5, and 1:2. The autoclave with the catalyst and reactants was kept in an oven heated to the required temperature. The reaction was performed for various time intervals between 3 to 24 h. After each reaction, the autoclave was cooled to 30 °C. The catalyst and reaction products were separated by filtration and the reaction mixture was analyzed on a Perkin Elmer Clarus-500 gas chromatograph using a ZB-1 capillary column and an FI detector. The reaction products were identified by GC-MS and standard samples.
:0.5, 1:1, 1:1.5, and 1:2. The autoclave with the catalyst and reactants was kept in an oven heated to the required temperature. The reaction was performed for various time intervals between 3 to 24 h. After each reaction, the autoclave was cooled to 30 °C. The catalyst and reaction products were separated by filtration and the reaction mixture was analyzed on a Perkin Elmer Clarus-500 gas chromatograph using a ZB-1 capillary column and an FI detector. The reaction products were identified by GC-MS and standard samples.
Characterization
Wide-angle XRD patterns for the as-synthesized and calcined materials were obtained using a Rigaku Miniflex II diffractometer, using CuKα irradiation. The XRD patterns were measured in the 2θ range of 15–60° at a scanning rate of 2° per min. The composition of the catalysts was analysed using a Rigaku XRF spectrometer. The pyridine adsorption–desorption measurement was used for the identification of Brønsted and Lewis acidity of the catalyst. DRIFT spectra of the samples were recorded by 100 scans at a resolution of 4 cm−1 using Bruker Tensor-27. The thermal analyses of the samples were performed on PerkinElmer TG/DTA using alumina as the reference. For each run, 5 mg of the sample was taken, and the runs were performed from 40 to 900 °C at a rate of 5 °C per min. The BET-surface area of the samples was measured using a Micromeritics ASAP-2020 analyzer after the samples were degassed in vacuum at 300 °C for 3 h.
3. Results and discussion
The XRD patterns of sulfated Fe2O3–TiO2 (SFT) samples calcined at various temperatures are shown in Fig. 1. The diffraction peaks at 2θ of 27.5°, 36.1°, and 41.3° are due to the presence of the rutile phase in the sample. The intensity of peaks at 2θ of 27.5° and 36.1° was found to increase with increase of temperature of treatment due to the rutilation of the sample. The peak obtained at a 2θ of 25.4° is due to the presence of the anatase phase of titania which also showed an increase in intensity with increase of temperature of treatment. The rutile content was found to increase from 11 to 15% with temperature. In general, the anatase phase was formed initially and subsequently it was converted to rutile on heat treatment. In this study, the anatase content was found to increase from 2.9 to 7.2% with temperature of treatment. It has been observed that the rutile content is greater than the anatase phase in the acid treated ilmenite samples. The diffraction lines at 2θ of 32.8°, 34.9°, 46°, 48.8°, and 56.7° are due to the formation of FeTiO3. The peak at 2θ of 54.5° is due to the presence of Fe2O3. The peak at 2θ of 18.2° could be due to Fe2TiO5 and the peak at 39.4° is due to Fe2TiO4. The peak at 2θ of 31.2° is observed for all the samples irrespective of the temperature of calcination which is due to iron titanium sulfate. The peaks at 2θ of 18.2° and 26.7° are obtained only for the samples calcined at 900 °C for 2 hours. Similarly, the peak at 2θ of 39.4° was obtained only for the samples calcined at 700 and 900 °C. The origin of these peaks remains unclear.
 |
| | Fig. 1
XRD patterns of sulfated Fe2O3–TiO2 (SFT) samples calcined at various temperatures. | |
BET-surface area, particle size and crystallite size
The values of BET-surface area, particle size, crystallite size, and sulfur content of the SFT samples calcined at various temperatures are given in Table 1. Although the surface area values remained constant with temperatures up to 500 °C, SFT-500 showed 16% higher crystallite size than SFT-100. The SFT-700 and SFT-900 samples showed a lower surface area than the samples calcined at ≤500 °C. The data on the composition of the SFT samples calcined at various temperatures as determined by the XRF method are given in Table 2. The presence of sulfate, silica, titania and iron oxides has been identified in the samples. The samples calcined up to 500 °C showed almost the same composition as that of the samples calcined at 300 and 100 °C. Nevertheless, the calcination of the sample at 700 °C drastically decreased the sulfate content from 8.1 to 1.4%. The SFT-900 sample showed almost the same sulfate content as that of SFT-700.
Table 1 BET-surface area, particle size, and crystallite size of the sulfated Fe2O3–TiO2 (SFT) samples calcined at various temperatures
| S. No. |
Sample |
BET-surface area/m2 g−1 |
Particle size (nm) SBET-method |
Crystallite size (nm) XRD-method |
| 1 |
SFT-100
|
17 |
84 |
86 |
| 2 |
SFT-300
|
17 |
84 |
94 |
| 3 |
SFT-500
|
16 |
89 |
103 |
| 4 |
SFT-700
|
12 |
119 |
106 |
| 5 |
SFT-900
|
12 |
119 |
108 |
Table 2 Composition of the sulfated Fe2O3–TiO2 (SFT) samples calcined at various temperatures by the XRF method
| S. No. |
Sample |
Sulfate (wt%) |
SiO2 (wt%) |
TiO2 (wt%) |
Fe2O3 (wt%) |
| 1 |
SFT-100
|
8.9 |
2.8 |
60.5 |
27.7 |
| 2 |
SFT-300
|
8.3 |
2.8 |
60.5 |
28.3 |
| 3 |
SFT-500
|
8.1 |
2.9 |
61.3 |
27.7 |
| 4 |
SFT-700
|
1.4 |
3.1 |
65.5 |
30.0 |
| 5 |
SFT-900
|
1.2 |
3.1 |
65.8 |
29.9 |
The nature of the sulfate species present on the surface of TiO2 and Fe2O3 during calcination was examined in detail using DRIFT spectra. The DRIFT spectra showed that the sulfated metal oxides which exhibited a high catalytic activity showed strong absorption bands in the region of 800–1200 cm−1.33Fig. 2(a) shows the DRIFT spectra of the SFT samples calcined at various temperatures. A broad absorption band was observed between 800 and 1200 cm−1 for the SFT samples calcined at 300 and 500 °C. A peak was observed at 1140 cm−1 which is attributed to asymmetric stretching of sulfate species.34 The other absorption bands were observed at 840, 940, 1000, 1050 and 1150 cm−1. The band at 1160 cm−1 for SFT-100 is significant and its intensity was lowered with increase of temperature of calcination. The SFT samples calcined at 700 and 900 °C showed low intensity bands at 840 and 940 cm−1, other than that these samples showed no absorption bands in the region of 700–1300 cm−1 showing the removal of sulfate groups from the samples. Fig. 2(b) shows the DRIFT spectra of the SFT samples obtained in the range of 600–4000 cm−1. The sulfates start to become polynuclear complex sulfates possibly S2O72− and/or S3O102− type characterized by absorptions between 1400 and 1600 cm−1.35 The specific absorption bands were not observed between 1400 and 1600 cm−1 for the SFT samples indicating the absence of polynuclear sulfates. The absorption bands at 3400 and 1640 cm−1 observed in the spectra for SFT samples are attributed to stretching modes of adsorbed water and hydroxyl groups. The SFT samples calcined at 900 °C for 2 h showed significant absorptions at 1880, 2000, 2140 and 2245 cm−1, these could be due to the formation of iron titanate and iron titanium sulfate. This is in accordance with XRD measurements.
 |
| | Fig. 2 (a) and (b) DRIFT spectra of the sulfated Fe2O3–TiO2 (SFT) samples calcined at various temperatures. | |
Acidity of the samples
The calcined SFT samples were evacuated at 300 °C for 2 h before the adsorption of pyridine. The adsorption was performed at 0.01 bar pressure by exposing the samples to pyridine vapour at 150 °C for 30 min. The desorption of pyridine was carried out at 150 °C for 1 h and thereafter the samples were cooled to room temperature and DRIFT spectra were measured. Fig. 3 shows the DRIFT spectra of the pyridine adsorbed SFT samples calcined at various temperatures. Both the pyridinium ion band at 1540 cm−1 and the band due to coordinated pyridine at 1485 cm−1 were found for the SFT samples calcined at ≤500 °C, indicating the presence of both Brønsted and Lewis acid sites, respectively. In addition, the intensity of bands at 1540 cm−1 for Brønsted acidity is greater than that at 1480 cm−1 (due to Lewis acid sites) thus indicating a greater number of Brønsted acid sites in the samples. It is noticed from the intensity of the bands that no change in acidity was observed for the samples calcined at 100 and 300 °C. The intensity of the bands obtained for SFT-500 is lower than that for SFT-300 and SFT-100. This could be due to the removal of some sulfate groups on calcination at 500 °C. The adsorption of pyridine on SFT samples calcined at 700 and 900 °C showed no peaks at 1485 and 1540 cm−1 revealing the absence of Brønsted and Lewis acid sites on these samples. The increase of calcination temperature from 500 to 700 °C accounted for a removal of 82 wt% sulfate. This shows that the catalysts can be effectively used at less than 500 °C.
The thermograms obtained for SFT samples calcined at various temperatures for 2 h are shown in Fig. 4. The samples dried at 100 °C and calcined at 300 and 500 °C showed two weight losses at 200 and 610 °C. Nevertheless, the sample dried at 100 °C demonstrated moderately higher weight losses of 5.7% at 200 °C and 8.4% at 610 °C than the SFT-300 and SFT-500 samples. The SFT-300 and SFT-500 samples showed almost the same weight loss of 4.6% at 200 °C and 7.8% at 610 °C. In all these samples the weight loss up to 200 °C could be attributed to the removal of adsorbed water molecules. The weight loss obtained between 430 and 610 °C for the samples calcined between 100 and 500 °C could be due to the removal of sulfate groups. The thermogram of SFT-700 showed a weight loss of 0.13% up to 900 °C. It shows that this sample does not contain adsorbed water molecules, hydroxyl groups and sulfates. Hence, the same weight loss patterns for the samples calcined up to 500 °C, a plateau beyond 610 °C and no significant weight loss for SFT-700 demonstrate that the SFT samples are thermally stable up to 500 °C.
 |
| | Fig. 4
Thermograms of sulfated Fe2O3–TiO2 (SFT) samples calcined at various temperatures. | |
Effect of temperature
The effect of temperature on the product yield and tert-butanol conversion over SFT-500 is presented in Fig. 5. The results showed increasing conversion with increase of temperature. Conversion levels of 4.7 to 88.2% were obtained with temperature for the reaction performed for 6 h. Further, the liquid phase reaction is operating at 75 and 100 °C resulting in lower conversion. The vapour phase reaction at 150 and 200 °C showed greater conversion of tert-butanol. This demonstrates the preference of vapour phase reaction for this class of reaction. The effect of temperature on the product yield over SFT-500 showed increasing yield of 2-tert-butyl phenol (2-TBP), 4-tert-butyl phenol (4-TBP) and 2,6-di-tert-butyl phenol (2,6-DTBP) with temperature. The selectivity of 4-TBP was found to decrease with temperature, in particular at 200 °C, the 4-TBP selectivity (21%) was lower than the bulky 2,6-DTBP (31.8%). The selectivity of 2,6-DTBP was found to increase from 0.38 to 31.8% with temperature. This trend shows the preference of the catalyst (SFT-500) for ortho substituted products (2-TBP and 2,6-DTBP) over the para product (4-TBP). The effect of temperature for this reaction also reveals that the product selectivity can be engineered in accordance with the requirement.
![Effect of temperature on the product yield and tert-butanol conversion over SFT-500 [(■—2-TBP; ●—4-TBP; ▲—2,6-DTBP; ◇—conversion); feed ratio = 1 : 1; reaction time = 6 h].](/image/article/2011/CY/c1cy00157d/c1cy00157d-f5.gif) |
| | Fig. 5 Effect of temperature on the product yield and tert-butanol conversion over SFT-500 [(■—2-TBP; ●—4-TBP; ▲—2,6-DTBP; ◇—conversion); feed ratio = 1:1; reaction time = 6 h]. | |
Effect of feed ratio
The effect of the feed ratio on the product yield and tert-butanol conversion over SFT-500 is examined at 100 °C for a reaction time of 6 h. The reaction was performed by varying the feed ratio of phenol and tert-butanol from 1:0.5 to 1:2 and the results are presented in Fig. 6. The conversion and product yield decreased from 32 to 1.7% with increasing tert-butanol concentration. This could be attributed to the dilution of phenol with tert-butanol. Although the concentration of tert-butanol was varied from 0.5 to 2 mol ratio, the selectivity of the products remained almost constant.
![Effect of feed ratio on the product yield and tert-butanol conversion over SFT-500 [(■—2-TBP; ●—4-TBP; ▲—2,6-DTBP; ◇—conversion); temperature = 100 °C; reaction time = 6 h].](/image/article/2011/CY/c1cy00157d/c1cy00157d-f6.gif) |
| | Fig. 6 Effect of feed ratio on the product yield and tert-butanol conversion over SFT-500 [(■—2-TBP; ●—4-TBP; ▲—2,6-DTBP; ◇—conversion); temperature = 100 °C; reaction time = 6 h]. | |
Effect of reaction time
The effect of reaction time on the product yield and tert-butanol conversion over SFT-500 was studied at 100 °C with a phenol to tert-butanol mole ratio of 1. The results are shown in Fig. 7. The conversion of tert-butanol was found to increase with time and attained 99.8% at 21 h. Similarly, the yield of products was also found to increase with time. A maximum yield of 14.4 wt% was obtained for 2-TBP followed by 4-TBP (13.7 wt%) and 2,6-DTBP (1.5 wt%). The selectivity for products showed a maximum for 2-TBP with 64% at 6 h and thereafter it was found to decrease and attained 48.6% at 21 h. The selectivity of 4-TBP was found to increase with time and attained a maximum of 46.3% at 21 h. The selectivity of 2,6-DTBP was 5.1% at 21 h. Initially, for up to 6 hours, 2-TBP and 4-TBP were the only products formed and 2,6-DTBP was not formed. Thereafter 2,6-DTBP appeared to form, and was found to increase from 0.4 to 1.5% during the reaction period of 9–21 h. The change in the trend for 2,6-DTBP is not as significant as that for other two products. This could be due to the steric hindrance in the formation of 2,6-DTBP and also the experimental results suggested that the formation of 2,6-DTBP required the presence of 2-TBP in the reaction mixture.
![Effect of reaction time on the product yield and tert-butanol conversion over SFT-500 [(■—2-TBP; ●—4-TBP; ▲—2,6-DTBP; ◇—conversion); temperature = 100 °C; feed ratio = 1 : 1].](/image/article/2011/CY/c1cy00157d/c1cy00157d-f7.gif) |
| | Fig. 7 Effect of reaction time on the product yield and tert-butanol conversion over SFT-500 [(■—2-TBP; ●—4-TBP; ▲—2,6-DTBP; ◇—conversion); temperature = 100 °C; feed ratio = 1:1]. | |
![Effect of the product yield and tert-butanol conversion on sulfated Fe2O3–TiO2 (SFT) samples calcined at various temperatures [(■—2-TBP; ●—4-TBP; ▲—2,6-DTBP; ◇—conversion); temperature = 100 °C; feed ratio = 1 : 1; time = 15 h].](/image/article/2011/CY/c1cy00157d/c1cy00157d-f8.gif) |
| | Fig. 8 Effect of the product yield and tert-butanol conversion on sulfated Fe2O3–TiO2 (SFT) samples calcined at various temperatures [(■—2-TBP; ●—4-TBP; ▲—2,6-DTBP; ◇—conversion); temperature = 100 °C; feed ratio = 1:1; time = 15 h]. | |
![Effect of the product yield and conversion for four successive runs over SFT-500 [(■—2-TBP; ●—4-TBP; ▲—2,6-DTBP; ◇—conversion); temperature = 100 °C; feed ratio = 1 : 1; time = 21 h].](/image/article/2011/CY/c1cy00157d/c1cy00157d-f9.gif) |
| | Fig. 9 Effect of the product yield and conversion for four successive runs over SFT-500 [(■—2-TBP; ●—4-TBP; ▲—2,6-DTBP; ◇—conversion); temperature = 100 °C; feed ratio = 1:1; time = 21 h]. | |
Effect of alkylation on high surface area sulfated and phosphated titania
The effect of temperature on the product yield and tert-butanol conversion over high surface area sulfated and phosphated titania was studied at 200 °C for 6 h with a phenol to tert-butanol mole ratio of one. The procedure for synthesis and characterization of sulfated36 and phosphated37 titania is reported elsewhere. The objective of performing this reaction on sulfated and phosphated titania was to evaluate the performance of SFT with these catalysts. A tert-butanol conversion of 17.2% and 27.4% was obtained on phosphated and sulfated titania, respectively. This is about 5 times lower on phosphated titania and 3 times lower on sulfated titania than that on SFT-500. Both sulfated and phosphated titania possessed both Brønsted and Lewis acid sites as that of SFT-500. Nevertheless, the intensity of the Brønsted and Lewis acid peaks at 1480 and 1540 cm−1 obtained for the sulfated and phosphated titania is about 60% lower than that of SFT (sulfated Fe2O3–TiO2). This could be attributed to the lower sulfate content of 5 wt% and phosphate present in the samples. Hence, despite the higher surface area (∼100 m2 g−1) possessed by the sulfated and phosphated titania samples, these catalysts showed lower conversion of tert-butanol than SFT due to loss of acidity. Further, the Fe–sulfate bond might be weaker than the Ti–sulfate bond and thereby the dissociative adsorption of phenol could be more probable over SFT than that on sulfated titania.
The alkylation of phenol with tert-butanol in the presence of a catalyst poses a challenge for substitution at the ortho position of the hydroxyl group. The use of active catalysts, such as H3PO4, H2SO4, AlCl3, etc., tends to lead to the formation of undesired products and thermodynamically controlled mixtures, where the ortho alkylated product is merely one of many compounds. The use of weak Lewis acid catalysts such as Al2O3 leads to low conversion of the reactants, requiring a minimum reaction temperature of 250 °C. Hence, in the present study, the sulfated Fe2O3–TiO2 (SFT) having Brønsted and Lewis acidity in equal proportions was employed for orthoalkylation of phenol with tert-butanol. Although the SFT samples showed lower specific surface area, the greater activity of the SFT samples could be attributed to the retention of water molecules up to 200 °C as suggested by TG/DTA. In addition, the DRIFT spectra obtained for the SFT samples calcined up to 700 °C showed nearly the same intensity for hydroxyl absorption bands at 1630 and 3400 cm−1. This further demonstrates that the SFT samples possess greater affinity for water molecules. The indissoluble characteristics of Fe2O3 from TiO2 and the anchoring of sulfates on both the oxides make this catalyst to disperse uniformly throughout the reaction system which could be a possible reason for the higher (88%) conversion. The non-porous characteristic of this catalyst makes it unique as most of the sulfate remains on the surface and thereby makes all of the sulfates available for the reaction.
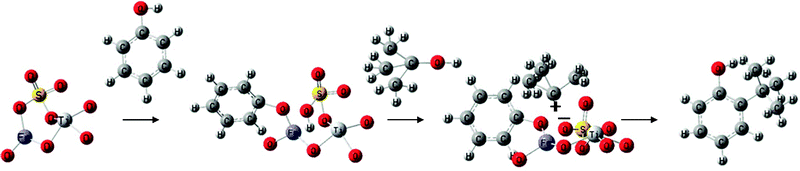
Reaction mechanism
Phenol is dissociatively adsorbed on an Fe site and the released proton is bonded to the adjacent sulfate oxygen, as this proton is as acidic as that of sulfuric acid. The tert-butyl alcohol can be chemisorbed on it as shown in the reaction in Scheme 1. The chemisorbed tert-butyl alcohol is readily converted to a tert-butyl cation. The ortho position of phenoxide is close to the adjacent tert-butyl cation which results in the electrophilic reaction of the tert-butyl cation with the chemisorbed phenoxide giving preferentially 2-TBP. During the reaction, free phenol in the liquid or the vapor phase reacts with the tert-butyl cation to form 4-TBP. The selective orthoalkylation of phenol on the SFT catalyst could be due to the prevalence of the Langmuir–Hinshelwood mechanism over the Rideal–Eley mechanism.
 |
| | Scheme 1 | |
4. Conclusions
This study evolved the synthesis of sulfate modified Fe2O3–TiO2 (SFT) using ilmenite ore by treating with sulfuric acid and water. The XRD patterns showed the presence of anatase, rutile phases and as well as Fe2O3, iron titanate and iron titanium sulfate. The XRF analysis of the samples showed a sulfate content of ≥8.1 wt% for samples calcined at ≤500 °C. In addition, DRIFT spectra exhibit absorption due to sulfate groups. The pyridine adsorption–desorption studies revealed the presence of Brønsted and Lewis acid sites in equal proportions for the samples calcined at ≤500 °C, while the samples calcined at ≥500 °C are devoid of acidic sites. The TG/DTA and DRIFT spectra revealed greater affinity of the samples for water. The SFT samples exhibited pronounced catalytic activity for the orthoalkylation of phenol with tert-butanol. The reaction performed at 200 °C showed a selectivity of 79% for ortho substitution. The conversion of tert-butanol on the SFT samples calcined at ≤500 °C was about 5–8 times greater than that on the catalysts calcined at 700 and 900 °C. The decrease in the catalytic activity of the samples calcined at 700 and 900 °C is due to the decreased acidity of the catalysts arising from the removal of sulfate species on calcination. With successive runs, a decrease in the conversion was observed which is due to the leaching out of sulfate. The combination of Fe2O3 and TiO2 present in the catalyst strongly holds the sulfate on its surface which accounts for their superior catalytic activity relative to materials possessing higher surface area (sulfated and phosphated titania).
Acknowledgements
The authors acknowledge the Department of Science and Technology, Government of India for funding the National Centre for Catalysis Research (NCCR) at IIT-Madras.
References
- K. G. Chandra and M. M. Sharma, Catal. Lett., 1993, 19, 309–317 CrossRef CAS.
- F. M. Moghaddam, M. Akhlaghi, L. Hojabri and M. G. Dekamin, Sci. Iran. Trans. C, 2009, 16, 81–88 CAS.
- M. Ghiaci and B. Aghabarari, Chin. J. Catal., 2010, 31, 759–764 CrossRef CAS.
-
R. J. Laufer and M. D. Kulik, US Pat., 3,408,410, 1968 Search PubMed.
- K. Zhang, C. Huang, H. Zhang, S. Xiang, S. Liu, D. Xu and H. Li, Appl. Catal., A, 1998, 166, 89–95 CrossRef CAS.
- T. Mathew, B. S. Rao and C. S. Gopinath, J. Catal., 2004, 222, 107–116 CrossRef CAS.
- A. B. Shinde, N. B. Shrigadi and S. D. Samant, Appl. Catal., A, 2004, 276, 5–8 CrossRef CAS.
- C. DeCastro, E. Sauvage, M. H. Valkenberg and W. F. Hoelderich, J. Catal., 2000, 196, 86–94 CrossRef CAS.
- A. Vinu, T. Krithiga, V. V. Balasubramanian, A. Asthana, P. Srinivasu, T. Mori, K. Ariga, G. Ramanath and P. G. Ganesan, J. Phys. Chem. B, 2006, 110, 11924–11931 CrossRef CAS.
- A. Sakthivel, S. K. Badamali and P. Selvam, Microporous Mesoporous Mater., 2000, 39, 457–463 CrossRef CAS.
- S. K. Badamali, A. Sakthivel and P. Selvam, Catal. Lett., 2000, 65, 153–157 CrossRef CAS.
- S. E. Dapurkar and P. Selvam, Appl. Catal., A, 2003, 254, 239–249 CrossRef CAS.
- A. Sakthivel, N. Saritha and P. Selvam, Catal. Lett., 2001, 72, 225–228 CrossRef CAS.
- G. Kamalakar, K. Komura and Y. Sugi, Appl. Catal., A, 2006, 310, 155–163 CrossRef CAS.
- G. Kamalakar, K. Komura and Y. Sugi, Ind. Eng. Chem. Res., 2006, 45, 6118–6126 CrossRef CAS.
- E. Modrogan, M. H. Valkenberg and W. F. Hoelderich, J. Catal., 2009, 261, 177–187 CrossRef CAS.
- E. Dumitrin and V. Hulea, J. Catal., 2003, 218, 249–257 CrossRef.
-
B. E. Firth, US Pat., 4,275,249, 1981 Search PubMed.
- F. W. Kupper, Appl. Catal., A, 2004, 264, 253–262 CrossRef CAS.
- M. Hino and K. Arata, J. Chem. Soc., Chem. Commun., 1979, 1148–1149 RSC.
- G. Busca, H. Saussey, O. Saur, J. C. Lavalley and V. Lorenzelli, Appl. Catal., 1985, 14, 245–260 CrossRef CAS.
- A. Kayo, T. Yamaguchi and K. Tanabe, J. Catal., 1983, 83, 99–106 CrossRef CAS.
- M. Hino and K. Arata, J. Chem. Soc., Chem. Commun., 1980, 851–852 RSC.
- T. Jin, M. Machida, T. Yamaguchi and K. Tanabe, Inorg. Chem., 1984, 23, 4396–4398 CrossRef CAS.
- M. Hino and K. Arata, Chem. Lett., 1979, 477–480 CrossRef CAS.
- Y. Nagase, T. Jin, H. Hattori, T. Yamaguchi and K. Tanabe, Bull. Chem. Soc. Jpn., 1985, 58, 916–920 CrossRef CAS.
- A. Kayo, K. Tanabe and T. Yamaguchi, J. Catal., 1983, 83, 99–106 CrossRef CAS.
- R. A. Comelli, C. R. Vera and J. M. J. Parera, J. Catal., 1995, 151, 96–101 CrossRef CAS.
- K. Tanabe, A. Kayo and T. Yamaguchi, J. Chem. Soc., Chem. Commun., 1981, 602–603 RSC.
- T. Yamaguchi, T. Jin and K. Tanabe, J. Phys. Chem., 1986, 90, 3148–3152 CrossRef CAS.
- T. Jin, T. Yamaguchi and K. Tanabe, J. Phys. Chem., 1986, 90, 4794–4796 CrossRef CAS.
- A. S. C. Brown, J. S. J. Hargreaves and B. Rijniersce, Catal. Today, 1998, 45, 47–54 CrossRef CAS.
- T. Yamaguchi, Appl. Catal., 1990, 61, 1–25 CrossRef CAS.
- F. Berger, E. Beche, R. Berjoan, D. Klein and A. Charnbaudet, Appl. Surf. Sci., 1996, 93, 9–16 CrossRef CAS.
- C. Morterra, G. Cerrato, C. Emanuel and V. Bolis, J. Catal., 1993, 142, 349–367 CrossRef CAS.
- K. J. A. Raj and B. Viswanathan, ACS Appl. Mater. Interfaces, 2009, 1, 2462–2469 CAS.
- K. J. A. Raj, A. V. Ramaswamy and B. Viswanathan, J. Phys. Chem. C, 2009, 113, 13750–13757 CAS.
|
| This journal is © The Royal Society of Chemistry 2011 |
Click here to see how this site uses Cookies. View our privacy policy here. 