NiO microspheres with tunable porosity and morphology effects for CO oxidation†
Junjia
Xiao
,
Biaohua
Chen
,
Xin
Liang
*,
Runduo
Zhang
and
Yingxia
Li
State Key Laboratory of Chemical Resource Engineering, Beijing University of Chemical Technology, Beijing 100029, P. R. China. E-mail: Liangxin@mail.buct.edu.cn
First published on 11th July 2011
Abstract
Hierarchiral NiO flower-like microspheres with tunable porosity were prepared based on a facile solvothermal method. Three kinds of NiO micro-flowers (NiO-A, NiO-B, and NiO-C) with different porosity have been fabricated mainly by tuning the concentration of nickel nitrate. These flower-like microspheres are comprised of densely packed irregular sheets and display a multi-peaks pore distribution in a wide range in both mesoporous and macroporous regions. The BET surface area of NiO-A, NiO-B and NiO-C is 59.9 m2 g−1, 50.2 m2 g−1 and 15.1 m2 g−1, respectively. The pore volume of NiO-A, NiO-B and NiO-C is 0.2214 cm3 g−1, 0.0829 cm3 g−1 and 0.0549 cm3 g−1, respectively. These NiO spheres show a strong morphology dependant nature for CO oxidation catalysis. Compared to the conventional NiO nanoparticles, these flower-like NiO micro-spheres possess a superior catalytic activity for CO oxidation.
1. Introduction
Nanocatalysts have received wide recognition because of their high specific area, novel size- and shape-dependent properties compared to those of their bulk materials with the same composition. Function-oriented engineering nanocatalysts on size, shape and surface structures appear as an advancing front in designing advanced catalysts with excellent performance such as high activity, high selectivity and high thermal stability.1–3 Understanding the structure-property relationship of nanocatalysts has great significance for designing and developing nanomaterials with desirable properties. The CO oxidation reaction is an important environmental friendly catalytic reaction. Many studies have proved that CO oxidation is a structurally-sensitive reaction. The catalysis activity for this reaction have been greatly influenced by the structural properties of the catalysts, such as the crystal size,4 specific surface areas,5 shape,6 naked crystal planes and so on.7 Therefore, this simple but important reaction provides an ideal model system for an in-depth study of the structure-property relationship of the catalysts.NiO has extensive important applications in catalysis,8 anodic electrochromism,9 smart windows,10fuel cells and magnetic materials.11,12 To date, various NiO nanostructures, including NiO micro-flowers,13–15NiO nanorods,16NiO nanorings and NiO nanosheets have been synthesized.17,18 The catalytic properties of NiO nanostructures have been investigated. For example, Sow and co-workers fabricated vertically aligned NiO nanowalls on nickel foil using a plasma assisted oxidation method.19 Yuan and co-workers prepared single-crystalline hollow NiO crystals with well-defined octahedral morphology.20 Zhu and co-workers have synthesized NiO nanocolumns and investigated the catalytic properties for CO oxidation.21 Chen and co-workers have fabricated flower-like NiO and researched the catalytic properties for CO oxidation.14 Despite these efforts, important issues, such as the fundamental relationship between the structures and properties, as well as the fabrication of materials with well-controlled size, shape and surface structures, are still in need of in-depth investigation.
In this study, hierarchiral NiO flower-like microspheres with different porosities have been synthesized based on a solvothermal method by mainly controlling the synthetic parameters, such as concentration of nickel nitrate, sodium hydroxide and benzoic acid. The catalytic activities for CO oxidation of those hierarchiral NiO microspheres have been investigated. Those NiO flower-like microspheres have shown superior catalytic activity for CO oxidation to that of conventional nanoparticulate NiO. The study about the catalytic properties of a series of those NiO microspheres with different structures has shown that the catalytic properties of NiO microspheres are morphology dependent.
2. Results and discussion
Flower-like Ni(OH)2 precursors can be obtained through a solvothermal method by using Ni(NO3)2·6H2O and NaOH as starting materials in the presence of PEG and benzoic acid. Three kinds of Ni(OH)2 micro-flowers with different surface structure were obtained by mainly tuning the concentration of nickel nitrate (12 mmol, 2 mmol and 1 mmol), which were marked as Ni(OH)2-A, Ni(OH)2-B and Ni(OH)2-C, respectively. The phase purity of the as-synthesized precursors was determined by X-ray powder diffraction (XRD). Fig. 1a–c show the XRD patterns of the precursors and their corresponding calcined samples after being annealed at 350 °C for 2 h in air, respectively. For all three kinds of precursors, the patterns of the precursors shown in Fig. 1a–c fit well with rhombohedral type of α-Ni(OH)2 layered structure with lattice constants a = 3.08 Å and c = 23.41 Å (JCPDS No. 38-0715). The diffractive peaks at 2θ = 11.35°, 33.46° and 59.98° could be assigned to the (003), (101) and (110) planes. No impurity peaks are found, suggesting the as-prepared precursors are the pure phase of α-Ni(OH)2. The XRD patterns of the calcined samples could be indexed to the face-centered cubic NiO phase. The positions of the diffraction peaks are in good agreement with the reported data (JCPDS No. 71-1179), showing the α-Ni(OH)2 precursors converted to NiO under the designed heat treatment. The phase transformation of α-Ni(OH)2 to NiO was confirmed by the TG-DSC analysis. The TG-DSC results are shown in Fig. 1d, it is clear that the first stage occurs between 100–250 °C, and the weight loss is measured to be ∼7%, corresponding to the loss of the interlayer water and organic molecules. The major weight loss occurs between 250–350 °C, corresponding to the decomposition process of α-Ni(OH)2 to NiO. A strong endothermic peak was observed from 280 °C to 340 °C in the DSC curve, which can be assigned to the phase transformation of α-Ni(OH)2 to NiO.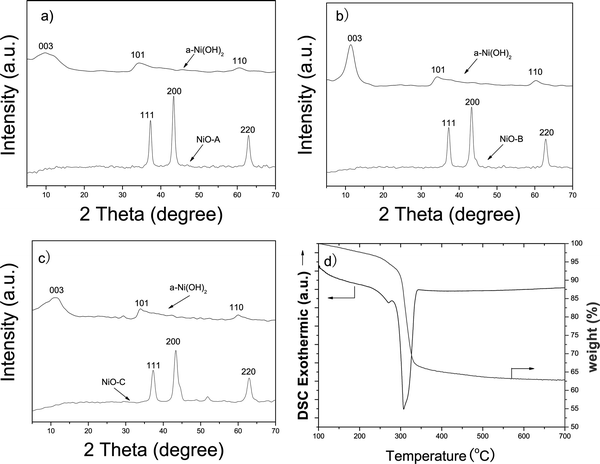 | ||
| Fig. 1 (a) XRD patterns of the as-made α-Ni(OH)2 and NiO-A from calcination of α-Ni(OH)2. (b) XRD patterns of the as-made α-Ni(OH)2 and NiO-B from calcination of α-Ni(OH)2. (c) XRD patterns of the as-made α-Ni(OH)2 and NiO-C from calcination of α-Ni(OH)2. (d) TGA-DSC curves of the α-Ni(OH)2-C precursor. | ||
The morphology and structure of the NiO samples and their precursors were investigated by SEM and TEM observations. Fig. 2a–c show the SEM images of the precursors α-Ni(OH)2-A, α-Ni(OH)2-B, and α-Ni(OH)2-C synthesized at different initial Ni(NO3)2 concentrations. It can be seen that all the α-Ni(OH)2 precursors were flower-like microspheres, which were comprised of densely packed irregular sheets. The average size of these α-Ni(OH)2 flowers were in the range of 2–5 μm. For the precursors derived at different concentrations, the hierarchical flower-like microspheres have different surface structures, revealing the surface structures of these flowers could be adjusted by the synthetic conditions. PEG and benzoic acid acted as surfactants and soft templates to help the nanosheets assemble into micro-flowers and enhance the growth efficiency of the α-Ni(OH)2 micro-flowers. The concentration of nickel nitrate mainly controls the properties such as the particle size and surface structures. Fig. 2d–f show the SEM micrographs of the corresponding calcined NiO micro-flowers samples. Compared to the morphology of the precursors, the morphology of the NiO micro-flowers samples had not changed much. It proved that the NiO micro-flowers have good thermal stability under the designed calcination temperature. The average crystalline sizes of NiO-A, NiO-B and NiO-C calculated by the scherrer formula based on the XRD patterns were 17.1 nm, 15.9 nm and 17.2 nm, respectively, and the average particle size of the NiO spheres is 2–5 μm. The results confirmed the hierarchal flower-like NiO spheres were assembled by many small crystalline particles in the nanoscale. From the TEM micrographs of the NiO flower-like micro-spheres shown in Fig. 2g–i, it can be seen that the micro-structures of those NiO samples are different. The gullies on the surface of NiO-A were shallow and narrow. Compared to NiO-A, NiO-B and NiO-C had deeper and wider gullies. This phenomenon was consistent with the result observed by the SEM micrographs.
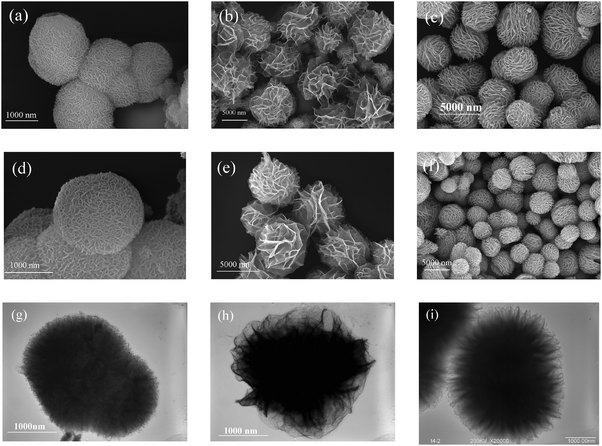 | ||
| Fig. 2 SEM micrographs of the precursors (a) α-Ni(OH)2-A, (b) α-Ni(OH)2-B and (c) α-Ni(OH)2-C; SEM micrographs of (d) NiO-A, (e) NiO-B and (f) NiO-C; TEM micrographs of (g) NiO-A, (h) NiO-B and (i) NiO-C. | ||
The texture properties of these NiO micro-flowers were further elucidated by N2 sorption analysis. The specific surface areas of NiO-A, NiO-B, NiO-C have been confirmed to be 59.9 m2 g−1, 50.2 m2 g−1 and 15.1 m2 g−1 by BET measurements, respectively. There is a surface chemical thermodynamics (SCT) mechanism that a higher initial concentration results in a higher average atom ratio, that is, the surface area of the nanocrystals is larger for the same amount of nanocrystals.22 The initial amount of nickel nitrate for NiO-A, NiO-B and NiO-C is 12 mmol, 2 mmol and 1 mmol, respectively. According to the SCT mechanism, the surface area is in the order of NiO-A > NiO-B > NiO-C, which is consistent with the measured results by the BET measurements.
As shown in Fig. 3a, all three kinds of NiO micro-flowers have IUPAC type IV isotherms with H3 type hysteresis, suggesting the existence of disordered lamellar pore structures and slit-shaped pores. The hysteresis loops appeared at nearly p/p0 = 0.7, indicating the existence of macropores. The pore size distribution curves (Fig. 3b–d) have been obtained by BJH model calculation on the desorption branch data.23 The pore sizes of the three types of NiO micro-flowers were in a very wide range. It is noticed that the pore size distribution curves of the three samples all have three typical peaks in the ranges of 2–20 nm, 70–120 nm and >150 nm, respectively. This multi-peaks distribution in both the mesoporous and macroporous realms would be desirable for the catalysis performance, for it provides an efficient transport pathway for reactants to the interior of the samples.10 For sample NiO-A, there are a strong peaks at the position of 9 nm, and two moderate peaks at 80 nm and 170 nm, respectively. The small pores at ∼9 nm were probably due to the structural defects in the NiO nanosheets, which composed the micro-flowers. The two moderate peaks at 80 nm and 170 nm were probably due to the gullies of the micro-flowers, and inter-particle spacing. Similar phenomena have been observed in the pore size distribution curves of samples NiO-B and NiO-C. For the NiO-B sample, there are three peaks at ∼6.3 nm, ∼70 nm and ∼285 nm, respectively. For the NiO-C sample, there are peaks at ∼3.8 nm, ∼120 nm and ∼250 nm. It can be concluded that these micro-flowers have higher specific surface area, more mesopores and less macropores in the order of NiO-A to NiO-B to NiO-C.
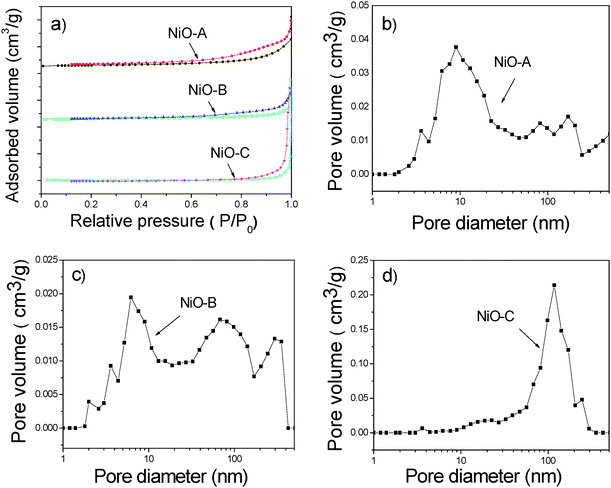 | ||
| Fig. 3 (a) N2 adsorption and desorption isotherms, (b) pore size distribution for the NiO-A micro-flowers, (c) pore size distribution for the NiO-B micro-flowers, (d) pore size distribution for the NiO-C micro-flowers. | ||
Fig. 4 shows the catalytic activities for CO oxidation over the NiO micro-flowers with different morphologies and a reference conventional nanoparticulate NiO sample prepared by decomposition of Ni(OH)2 that was directly deposited from Ni(NO3)2 and NaOH solution. The corresponding morphologies are also shown in Fig. 4. The CO conversion at 160 °C for NiO-A was 46%, for NiO-B was 53%, for NiO-C was 29%, and for NiO-R was 4%. It is clear that all of the three kinds of NiO micro-flowers (NiO-A, NiO-B, NiO-C) have shown higher activity than the reference NiO nanoparticles for CO oxidation. These results proved that the catalytic properties of these NiO micro-flowers are strongly dependent on their flower-like surface. Table 1 summarizes the temperature T50 (corresponding to 50% conversion of CO), the surface area, and porosity properties of the catalysts. The BET surface area of the above four NiO samples was 59.9, 50.2, 15.1 and 29.9 m2 g−1 respectively. Generally, the catalysts at nanosize scale and with high surface area should provided the catalysts with higher activity.24,25 According to this argument, the NiO-R sample should have higher activity than the NiO-C sample, but the result is opposite. The surface area is not the only factor for determining the activity of the catalyst.26 For our case, NiO nanoflower samples with flower-like morphology possessed more catalytic active sites on edges and corners than the NiO-R sample, which are helpful for the adsorption of reactants. 19,26,27
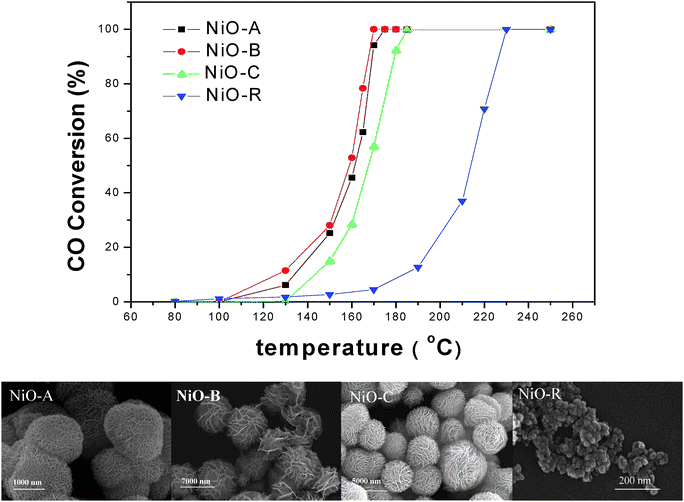 | ||
| Fig. 4 Catalytic activities of CO oxidation under different temperature for NiO-A, NiO-B, NiO-C and NiO-R, and the corresponding morphologies of the samples. | ||
| Sample | Average pore size (nm) | Pore volume (cm3 g−1) | BET surface area (m2 g−1) | T50 (°C) |
|---|---|---|---|---|
| NiO-A | 17.4 | 0.2214 | 59.9 | 161 |
| NiO-B | 16.1 | 0.0829 | 50.2 | 158 |
| NiO-C | 24.7 | 0.0549 | 15.1 | 168 |
| NiO-R | 9.2 | 0.1787 | 29.9 | 213 |
It was noticed that the surface area of NiO-A is larger than that of NiO-B, but the NiO-B sample has higher activity. There are some reasons for this result. Firstly, from the SEM micrograph of the NiO-A samples, we can see that there are some structure collapses on the surface of the sample. Once the flower-like morphology was damaged, the concentration of active sites would reduce, so the activity of NiO-A sample was decreased accordingly. The micro-flowers of NiO-A slightly aggregate with each other. A fixed bed microreactor was used to do the catalytic activity test. The internal diffusion resistance can't be ignored. This phenomenon would also lead to the decrease of catalytic activity of sample NiO-A for CO oxidation.
H2-TPR has been extensively used to characterize the reducibility of the catalysts. The results obtained by temperature-programmed reduction of the NiO micro-flowers samples are presented in Fig. 5. The peak temperature is in the order of NiO-R < NiO-A < NiO-B < NiO-C. Generally, the catalysts with the lower reduction temperature always display the higher catalytic properties, but it is not absolute for each instance. NiO-R shows the highest reducibility, but shows the worst catalytic activity. Sample NiO-A shows higher reducibility than sample NiO-B, but shows worse catalytic activity than NiO-B. As the TPR test evaluates the redox property of the catalyst and the catalytic reaction refers to an oxidation process, the TPR result isn't the only factor influencing the catalysis activities. The catalytic activities are sensitive to their surface structures, such as the surface atoms, oxygen vacancies, and defect sites, and so on. Similar phenomena were also reported in many other researchers' works.28,29 For example, Zhang and co-workers reported a macroporous CuO–CeO2 catalyst and studied the catalytic properties. Compared with particulate CuO–CeO2 with a similar surface area, the catalytic activity of macroporous CuO–CeO2 is higher than the reference sample, while the TPR temperature of the 3DOM CuO–CeO2 is higher than that of the particulate CuO–CeO2. Based on the above analysis, it can be concluded that the catalytic performance of these NiO micro-flowers greatly depended on their surface structures.
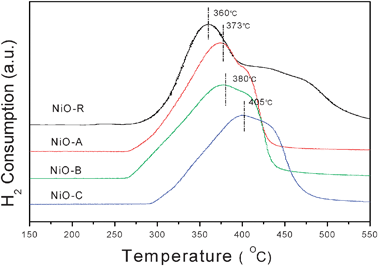 | ||
| Fig. 5 H2-TPR profiles of NiO-A, NiO-B, NiO-C and NiO-R. | ||
3. Conclusion
NiO micro-flowers with tunable surface structures were prepared based on a simple solvothermal method. The NiO micro-flowers were all comprised of densely packed irregular sheets and had good thermal stability in the calcination temperature of 350 °C. The surface structure of the micro-flowers is tunable by changing the concentration of reactants. These NiO micro-flowers have shown multi-aperture pore size distribution. The catalytic activity of the NiO micro-flowers on CO oxidation shows a morphology-dependent nature. The NiO micro-flowers have superior catalytic performance compared with the reference NiO nanoparticles for the flower-like morphology gives more catalytic active sites on the surface. This work provides an original method to obtain NiO micro-flowers with tunable surface areas and has shown that not only the surface area, but also the morphologies greatly influence the catalytic properties for CO oxidation.4. Experimental
Synthesis procedures
Glycol, polyethylene glycol 600 (PEG600), benzoic acid, nickel nitrate (Ni(NO3)2·6H2O), sodium hydroxide (NaOH) were all analytical purity and were used without further purification.For the synthesis of Ni(OH)2-A, 12 mmol of Ni(NO3)2·6H2O and 1.64 mmol of benzoic acid were dissolved into 30 mL of glycol solution containing 2 wt% PEG-600 to give a green transparent solution in a 50 mL beaker. Then 2 mL of 1 M NaOH aqueous solution was added dropwise under magnetic stirring. Green flocculates emerged immediately. After stirring at room temperature for 30 min, the mixture was transferred into an autoclave, which was sealed and maintained at 180 °C for another 10 h. The resulting product was separated by centrifugation, washed several times using deionized water and ethanol, then dried at 100 °C to get the Ni(OH)2-A precursor.
For the synthesis of Ni(OH)2-B, 2 mmol of Ni(NO3)2·6H2O and 4.1 mmol of benzoic acid were dissolved into 30 mL of glycol solution containing 2 wt% PEG-600 to give a green transparent solution in a 50 mL beaker. Then 2 mL of 2 M NaOH aqueous solution was added dropwise under magnetic stirring. Green flocculates emerged immediately. After stirring at room temperature for 30 min, the mixture was transferred into an autoclave, which was sealed and maintained at 180 °C for another 10 h. The resulting product was separated by centrifugation, washed several times using deionized water and ethanol, then dried at 100 °C to get the Ni(OH)2-B precursor.
For the synthesis of Ni(OH)2-C, 1 mmol of Ni(NO3)2·6H2O and 3.28 mmol of benzoic acid were dissolved into 30 mL of glycol solution containing 2 wt% PEG-600 to give a green transparent solution in a 50 mL beaker. Then 2 mL of 1 M NaOH aqueous solution was added dropwise under magnetic stirring. Green flocculates emerged immediately. After stirring at room temperature for 30 min, the mixture was transferred into an autoclave, which was sealed and maintained at 180 °C for another 10 h. The resulting product was separated by centrifugation, washed several times using deionized water and ethanol, then dried at 100 °C to get the Ni(OH)2-C precursor.
The above Ni(OH)2 precursors were all calcined in a muffle furnace. The temperature ramp was 1 °C min−1 from 40 to 350 °C, which was then held for 2 h at 350 °C. It was then cooled naturally to room temperature. Finally the NiO-A, NiO-B and NiO-C micro-flowers were obtained, respectively. Another reference sample of NiO (NiO-R) was obtained by calcining the reaction product between Ni(NO3)2·6H2O (10.31 mmol) and NaOH (0.1 mol) in 50.0 mL of deionized water in a 100 mL beaker. The temperature ramp was 2 °C min−1 from 40 to 350 °C and the duration time at 350 °C was 2 h.
Characterization
The phase characterization of the products was done by X-ray powder diffraction (XRD, Bruker AXS: D8 FOCUS) with Cu-Kα as the radiation source (λ = 0.15406 nm) through the 2θ range from 5 to 70° and operated at 40 kV and 30 mA.The morphology and size of the particles were studied on a scan electron microscope (SEM, SUPRA 55/55VP) and transmission electron microscope (TEM, JEM-3010).
Nitrogen adsorption and desorption isotherms were obtained at −196 °C using a Thermo Fisher Scientific SPECTOMETER 1990 apparatus. The samples were degassed for 180 min at 300 °C in the degas port of the adsorption analyzer before measurements. The specific surface areas of the samples were calculated using the Brunauer-Emmett-Teller equation.
Thermogravimetric analysis (TGA) and differential scanning calorimetric (DSC) measurements were performed using a Setaram Setsys EV 24 thermal analyzer and a O2–He mixture (20 mL min−1, 25% O2 by volume) as a carrier gas at a heating rate of 10 °C min−1 in a range of 100–700 °C.
H2-TPR (temperature-programmed reduction with H2) was carried out in a quartz tube reactor, and 20 mg sample was used for each measurement. Prior to the reduction, the sample was pretreated in an O2–He (9.98% O2 by volume) steam at 500 °C for 30 min and in N2 stream at 500 °C for another 30 min and then cooled to room temperature. After that, a H2–He mixture (5.25% H2 by volume) was switched on, and the temperature ramp was 10 °C min−1 from 40 to 700 °C. A thermal conductivity cell was used to detect the H2 consumption in the reactant stream.
The catalytic activities of NiO for a CO + O2 reaction were performed under a steady-state condition, involving a feed stream with a fixed composition of CO 1%, O2 16%, Ar 83% by volume, where Ar was used as diluent. A quartz tube was used as a reactor, and a 20 mg NiO sample was used for each test. The sample was pretreated in an Ar stream at 80 °C for 30 min and then heated to reaction temperature under the mixture gas condition. The reaction was carried out with the same space velocity of 120![[thin space (1/6-em)]](https://www.rsc.org/images/entities/char_2009.gif) 000 mL g−1 h−1. Nicolet Nexus 470 FT-IR was used for the purpose of analyzing the products.
000 mL g−1 h−1. Nicolet Nexus 470 FT-IR was used for the purpose of analyzing the products.
Acknowledgements
This work was financially supported by NSFC (grant no. 21001015, 20821004) and the RFDP (grant no. 20100010120003).References
- R. W. Murray, Chem. Rev., 2008, 108, 2688–2720 CrossRef CAS.
- J. F. Liu, W. Chen, X. W. Liu, K. B. Zhou and Y. D. Li, Nano Res., 2008, 1, 46–55 CrossRef CAS.
- X. Xu, J. Zhuang and X. Wang, J. Am. Chem. Soc., 2008, 130, 12527–12535 CrossRef CAS.
- W. Stichert and F. Schüth, Chem. Mater., 1998, 10, 2020–2026 CrossRef CAS.
- K. B. Zhou, X. Wang, X. M. Sun, Q. Peng and Y. D. Li, J. Catal., 2005, 229, 206–212 CrossRef CAS.
- S. Mostafa, F. Behafarid, J. R. Croy, L. K. Ono, L. Li, J. C. Yang, A. I. Frenkel and B. R. Cuenya, J. Am. Chem. Soc., 2010, 132, 15714–15719 CrossRef CAS.
- J. Guzman, S. Carrettin and A. Corma, J. Am. Chem. Soc., 2005, 127, 3286–3287 CrossRef CAS.
- J. Park, E. Kang, S. U. Son, H. M. Park, M. K. Lee, J. Kim, K. W. Kim, H. J. Noh, J. H. Park, C. J. Bae, J. G. Park and T. Hyeon, Adv. Mater., 2005, 17, 429–434 CrossRef CAS.
- H. Zeng, J. Li, J. Liu, Z. Wang and S. Sun, Nature, 2002, 420, 395–398 CrossRef CAS.
- J. M. Tarascon and M. Armand, Nature, 2001, 414, 359–367 CrossRef CAS.
- X. Wang, L. Li, Y. G. Zhang, S. T. Wang, Z. D. Zhang, L. F. Fei and Y. T. Qian, Cryst. Growth Des., 2006, 6, 2163–2165 CAS.
- G. Mattei, P. Mazzoldi, M. L. Post, D. Buso, M. Guglielmi and A. Martucci, Adv. Mater., 2007, 19, 561–564 CrossRef CAS.
- S. Sarkar, M. Pradhan, A. K. Sinha, M. Basu, Y. Negishi and T. Pal, Inorg. Chem., 2010, 49, 8813–8827 CrossRef CAS.
- B. Zhao, X. K. Ke, J. H. Bao, C. L. Wang, L. Dong and H. L. Chen, J. Phys. Chem. C, 2009, 113, 14440–14447 CAS.
- X. M. Ni, Y. F. Zhang, D. Y. Tian, H. G. Zheng and X. W. Wang, J. Cryst. Growth, 2007, 306, 418–421 CrossRef CAS.
- W. Wang, Y. Liu, C. Xu, C. Zheng and G. Wang, Chem. Phys. Lett., 2002, 362, 119–122 CrossRef CAS.
- J. Liang and Y. D. Li, Chem. Lett., 2003, 32, 1126–1127 CrossRef CAS.
- Z. Liang, Y. Zhu and X. Hu, J. Phys. Chem. B, 2004, 108, 3488–3491 CrossRef CAS.
- B. Varghese, M. V. Reddy, Y. W. Zhu, C. S. Lit, T. C. Hoong, G. V. S. Rao, B. V. R. Chowdari, A. T. S. Wee, C. T. Lim and C. H. Sow, Chem. Mater., 2008, 20, 3360–3367 CrossRef CAS.
- X. Wang, L. J. Yu, P. Hu and F. L. Yuan, Cryst. Growth Des., 2007, 7, 2415–2418 CAS.
- J. X. Zhu, Z. Gui, Y. Y. Ding, Z. Z. Wang, Y. Hu and M. Q. Zou, J. Phys. Chem. C, 2007, 111, 5622–5627 CAS.
- T. Xie, S. Li, W. B. Wang, Q. Peng and Y. D. Li, Chem.–Eur. J., 2008, 14, 9730–9735 CrossRef CAS.
- E. P. Barrett, L. G. Joyner and P. H. Halenda, J. Am. Chem. Soc., 1951, 73, 373–380 CrossRef CAS.
- J. Y. Ying, C. P. Mehnert and M. S. Wong, Angew. Chem., Int. Ed., 1999, 38, 56–77 CrossRef CAS.
- G. Boschloo and A. Hagfeldt, J. Phys. Chem. B, 2001, 105, 3039–3044 CrossRef CAS.
- D. S. Wang, R. Xu, X. Wang and Y. D. Li, Nanotechnology, 2006, 17, 979–983 CrossRef CAS.
- A. B. Fuertes, J. Phys. Chem. Solids, 2005, 66, 741–747 CrossRef CAS.
- Y. Zhang, H. Liang, X. Y. Gao and Y. Liu, Catal. Commun., 2009, 10, 1432–1436 CrossRef CAS.
- J. X. Chen, J. J. Zhou, R. J. Wang and J. Y. Zhang, Ind. Eng. Chem. Res., 2009, 48, 3802–3811 CrossRef CAS.
Footnote |
| † Electronic supplementary information (ESI) available: XRD pattern, N2 adsorption and desorption isotherms and pore size distribution curve of NiO-R. See DOI: 10.1039/c1cy00131k |
| This journal is © The Royal Society of Chemistry 2011 |
