Experimental evidence for three rate-controlling regions of the non-oxidative methane dehydroaromatization over Mo/HZSM-5 catalyst at 1073 K
Yanbin
Cui
,
Yuebing
Xu
,
Yoshizo
Suzuki
and
Zhan-Guo
Zhang
*
National Institute of Advanced Industrial Science and Technology (AIST), Onogawa 16-1, Tsukuba 305-8569, Japan. E-mail: z.zhang@aist.go.jp; Fax: +81-29-861-8209; Tel: +81-29-861-8091
First published on 7th June 2011
Abstract
Mo/HZSM-5 catalyst offers high selectivity for the non-oxidative dehydroaromatization of methane to benzene. This strongly suggests the deep involvement of the zeolite channels in controlling of the overall reaction rate. Therefore, two 5 wt% Mo/HZSM-5 catalysts based on two zeolite samples of different average crystal sizes were tested for the methane dehydroaromatization reaction over a wide range of space velocities (from 3500 to 60![[thin space (1/6-em)]](https://www.rsc.org/images/entities/char_2009.gif) 000 mL g−1 h−1) at 1073 K to examine the effect of superficial velocity on the benzene formation rates. Additionally, a recently developed on-line sampling and off-line analysis approach was employed to follow the maximum outlet benzene concentrations reached over very short time frames. Multiplying the obtained maximum outlet benzene concentrations by the corresponding inlet gas flow rates that were corrected for a temperature factor allowed approximate estimation of the maximum benzene formation rates. Consequently, two rate–space velocity curves were obtained to reveal that three rate-controlling regions exist for the title reaction: <20
000 mL g−1 h−1) at 1073 K to examine the effect of superficial velocity on the benzene formation rates. Additionally, a recently developed on-line sampling and off-line analysis approach was employed to follow the maximum outlet benzene concentrations reached over very short time frames. Multiplying the obtained maximum outlet benzene concentrations by the corresponding inlet gas flow rates that were corrected for a temperature factor allowed approximate estimation of the maximum benzene formation rates. Consequently, two rate–space velocity curves were obtained to reveal that three rate-controlling regions exist for the title reaction: <20![[thin space (1/6-em)]](https://www.rsc.org/images/entities/char_2009.gif) 000, between 20
000, between 20![[thin space (1/6-em)]](https://www.rsc.org/images/entities/char_2009.gif) 000 and 40
000 and 40![[thin space (1/6-em)]](https://www.rsc.org/images/entities/char_2009.gif) 000 and >40
000 and >40![[thin space (1/6-em)]](https://www.rsc.org/images/entities/char_2009.gif) 000 mL g−1 h−1. Moreover, some specifically designed tests and detailed data analysis were performed to further reveal that these three rate-controlling regions correspond, respectively, to the external mass transfer, intracrystalline diffusion and kinetic desorption controlling steps of the reaction.
000 mL g−1 h−1. Moreover, some specifically designed tests and detailed data analysis were performed to further reveal that these three rate-controlling regions correspond, respectively, to the external mass transfer, intracrystalline diffusion and kinetic desorption controlling steps of the reaction.
1. Introduction
With 60–70% selectivity to benzene and 12–20% to naphthalene the non-oxidative methane dehydroaromatization reaction over Mo/HZSM-5 provides a promising new route of effective utilization of methane resources.1–7 The high benzene selectivity of this reaction originates from the pore openings of HZSM-5 being almost identical to the kinetic diameters of the formed aromatic molecules, and therefore the reaction is most likely channel-diffusion-controlled. To date, more than four hundred research papers have been published on the fundamental and applicative aspects of this reaction. However, to our best knowledge, only one group other than ours mentioned the possibility of mass transfer limitations.8,9 Revealing the existence of channel diffusion limitations is certainly a problem of both scientific interest and practical importance. To accomplish this task requires a series of tests at high superficial velocities, at which both external mass transfer and intercrystalline diffusion resistances must be negligibly smaller than channel diffusion resistance. However, at such high space velocities the equilibrium-limited low CH4 conversion and rapid deactivation of Mo/HZSM-510 makes quantitative evaluation of its intrinsic activity difficult when using the time-consuming conventional on-line GC analysis method.Recently a new approach called on-line sampling and off-line analysis has been developed and demonstrated in our laboratory to enable evaluation of the intrinsic maximum activity of Mo/HZSM-5 at high space velocities.10 Thanks to the very short sampling intervals of this approach, we have successfully monitored the maximum concentrations of aromatics attained in very short time frames at 1073 K and space velocities up to 60![[thin space (1/6-em)]](https://www.rsc.org/images/entities/char_2009.gif) 000 mL g−1 h−1. The results reported here show for the first time that three rate-controlling regions exist for the title reaction: <20
000 mL g−1 h−1. The results reported here show for the first time that three rate-controlling regions exist for the title reaction: <20![[thin space (1/6-em)]](https://www.rsc.org/images/entities/char_2009.gif) 000, between 20
000, between 20![[thin space (1/6-em)]](https://www.rsc.org/images/entities/char_2009.gif) 000 and 40
000 and 40![[thin space (1/6-em)]](https://www.rsc.org/images/entities/char_2009.gif) 000 and >40
000 and >40![[thin space (1/6-em)]](https://www.rsc.org/images/entities/char_2009.gif) 000 mL g−1 h−1, and they correspond, respectively, to the external mass transfer, intracrystalline diffusion and kinetic desorption controlling steps of the reaction.
000 mL g−1 h−1, and they correspond, respectively, to the external mass transfer, intracrystalline diffusion and kinetic desorption controlling steps of the reaction.
2. Experimental
2.1 Zeolite samples and catalyst preparation
Two HZSM-5 samples with average crystal sizes of 4.0 and 1.0 μm (determined by the laser analysis method and confirmed by SEM observation) were used for preparation of 5 wt% Mo/HZSM-5 catalysts. The former sample, referred hereafter as to HZSM-5 (4.0 μm), was taken from a well-crystalline, commercial HZSM-5 (Si/Al = 20) and the latter sample HZSM-5 (1.0 μm) was obtained by ball-milling of the former crystals. Fig. 1 shows their FESEM images. The HZSM-5 samples were supplied by Meidensha Co., Japan. They have been characterized previously using XRD, BET, 27Al MAS NMR and NH3-TPD techniques9 and the related results are addressed here. The micropore surface area and volume measured by Ar adsorption at 87 K were 460 m2 g−1 and 0.13 cm3 g−1 for the former sample, and 300 m2 g−1 and 0.09 cm g−1 for the latter. While confirming the high crystallinity of the HZSM-5 (4.0 μm) sample, XRD measurements revealed that the crystallinity of the HZSM-5 (1.0 μm) was lower. As shown by the SEM image in Fig. 1(b), due to the breakdown and/or distortion of the partial zeolite framework during the ball-milling process, a 59% reduction in crystallinity occurred. The 27Al MAS NMR peak intensity of the latter sample was confirmed to decrease by 27% in comparison with that of the former zeolite sample. This decrease was most likely also caused by the structure breakdown during ball milling. Nevertheless, no extraframework aluminium was observed in this ball-milled zeolite sample, indicating a uniform aluminium distribution.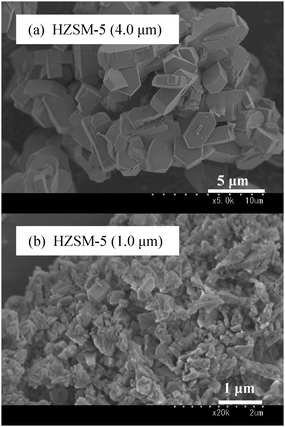 | ||
| Fig. 1 FESEM images of the zeolite samples. | ||
As for catalyst preparation, a conventional impregnation method with an aqueous solution of ammonium heptamolybdate was employed to achieve a loading of 5% Mo on the zeolite samples. After Mo impregnation, the sample was dried at 383 K for 1 h and then calcinated at 773 K for 5 h in air. The obtained powder-catalyst was pressed, crushed, and sieved to particles in sizes of 250–500 μm for use. Hereafter, the two prepared catalysts are referred to as 5 wt% Mo/HZSM-5 (4.0 μm) and 5 wt% Mo/HZSM-5 (1.0 μm), respectively. The Mo contents of both samples were confirmed by ICP analysis to be about 4.7 wt%.
2.2 Characterization
X-Ray diffraction (XRD) measurements were first conducted to confirm the Mo dispersions of the catalysts. The XRD patterns were obtained with a Rigaku RU-300 X-ray diffractometer over a 2θ range of 5°–60°. Additionally, the NH3 adsorption/temperature programmed desorption (NH3-TPD) technique was applied to evaluate the acidities of the zeolite samples and catalysts. The detailed NH3-TPD procedure is given in previous studies.9,112.3 Catalyst evaluation
All activity tests were carried out in a U-type fixed-bed quartz reactor (8 mm i.d.) under atmospheric pressure. To minimize the dead volume of the reactor system, a four-way valve was configured for the feed switch and an on-line sampler composed of one six-way valve and one 16-port valve was configured just at the reactor inlet and outlet, respectively. The detailed configuration and two exemplified sampling patterns with variable sampling intervals from seconds to minutes are given in ref. 10. Without creating an obvious pressure drop, this system allowed the maximum CH4 flow of 100 mL min−1 at room temperature, resulting in a space velocity of 60![[thin space (1/6-em)]](https://www.rsc.org/images/entities/char_2009.gif) 000 mL g−1 h−1. With a fixed amount of catalyst, lower feed rates led to lower space velocities. In each test approximately 100 mg of a catalyst sample was carburized at 923 K in a 17.5 mL min−1CH4 stream for a pre-determined period of time,9 heated in a He stream to 1073 K, and then subjected to a CH4 flow to start the reaction. Soon after the start, the effluent from the reactor was sampled at pre-designed intervals from seconds to minutes into 15 100 μL loops on the 16-port valve. The temperature of the sampler box was held at 503 K. At the end of the sampling a He stream was introduced through the bed to stop the reaction. Analysis of the stored samples was then conducted by using a GC with a FID detector to obtain the variations of the concentrations of formed aromatics.
000 mL g−1 h−1. With a fixed amount of catalyst, lower feed rates led to lower space velocities. In each test approximately 100 mg of a catalyst sample was carburized at 923 K in a 17.5 mL min−1CH4 stream for a pre-determined period of time,9 heated in a He stream to 1073 K, and then subjected to a CH4 flow to start the reaction. Soon after the start, the effluent from the reactor was sampled at pre-designed intervals from seconds to minutes into 15 100 μL loops on the 16-port valve. The temperature of the sampler box was held at 503 K. At the end of the sampling a He stream was introduced through the bed to stop the reaction. Analysis of the stored samples was then conducted by using a GC with a FID detector to obtain the variations of the concentrations of formed aromatics.
Additionally, a H2–CH4–H2 switch blank test was conducted at room temperature and confirmed that a 12 s flow of 50 mL min−1CH4 after a H2 flow was enough to purge the reactor completely.11 This implies that the minimum CH4 flow rate required to fully purge the whole reactor at 1073 K in 12 s is about 14 mL min−1 (equivalent to 8400 mL g−1 h−1 in the present work). In other words, any sample taken 12 s after a flow switch from H2 (or He) to CH4 at 1073 K and space velocities >8400 mL g−1 h−1 will represent the reacted stream.
3. Results and discussion
3.1 Characterization of HZSM-5
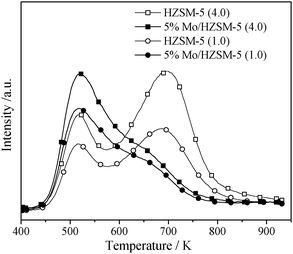
No MoO3 phase was detected in the two catalysts by XRD measurements, which suggests that the Mo is possibly dispersed through the zeolite channels of the catalysts. NH3-TPD measurements were performed for confirmation. Fig. 2 shows the NH3-TPD patterns obtained for the two catalysts as well as two zeolite samples. Similar to other HZSM-5 samples,12 the zeolite samples used in this work exhibit two NH3 desorption peaks centered at 520 and 700 K. These peaks are ascribed to NH3 molecules adsorbed on Lewis and Brønsted acid sites,13,14 respectively. The Brønsted acidity of each zeolite sample was estimated by integration of the corresponding higher temperature NH3 desorption peak. The Brønsted acidity is crucial in the benzene and naphthalene formation within the title reaction.15 Assuming that the Brønsted acidity of the HZSM-5 (4.0 μm) is 100, that of the HZSM-5 (1.0 μm) was estimated to be 67%, which suggests a loss of about 33% for breakdown and/or distortion of the partial zeolite framework during ball milling.For the two catalysts the intensity of the higher temperature NH3-desorption peak is obviously lower than that of the corresponding zeolite sample. This confirms that Mo indeed migrates and interacts with Al–OH–Si groups in the zeolite channels during catalyst preparation.16 Assuming that Mo is anchored to the channel Brønsted acid sites uniformly,16,17 the reductions observed here in the intensity of the higher temperature desorption peak would reflect the two catalysts' Mo dispersions. The differences in the Brønsted acidity between the zeolite samples and the corresponding catalysts were found to be 44% for the 5 wt% Mo/HZSM-5 (4.0 μm) and 18% for 5 wt% Mo/HZSM-5 (1.0 μm). The 5 wt% Mo/HZSM-5 (4.0 μm) sample had higher Brønsted acidity and Mo dispersion than the 5 wt% Mo/HZSM-5 (1.0 μm), predicting its higher activity.
3.2 Catalyst evaluation
![[thin space (1/6-em)]](https://www.rsc.org/images/entities/char_2009.gif) 000 mL g−1 h−1. The concentration–time curves vary with increasing space velocity in a similar manner for the two catalysts. The time for benzene to reach its maximum concentration becomes shorter with the increasing space velocity; it decreases from about 22 and 14 min at 3500 mL g−1 h−1 to about 1 min at 60
000 mL g−1 h−1. The concentration–time curves vary with increasing space velocity in a similar manner for the two catalysts. The time for benzene to reach its maximum concentration becomes shorter with the increasing space velocity; it decreases from about 22 and 14 min at 3500 mL g−1 h−1 to about 1 min at 60![[thin space (1/6-em)]](https://www.rsc.org/images/entities/char_2009.gif) 000 mL g−1 h−1 for the 5 wt% Mo/HZSM-5 (4.0 μm) and 5 wt% Mo/HZSM-5 (1.0 μm), respectively. A longer time, particularly at the lower space velocities, is needed for the 5 wt% Mo/HZSM-5 (4.0 μm) catalyst to reach its maximum benzene activity. This suggests an effect of longer zeolite channels creating a stronger diffusion resistance.9 Additionally, the maximum benzene concentration remains almost unchanged in the range of space velocities from 3500 to 8000 mL h−1 g−1, decreases between 8000 and 40
000 mL g−1 h−1 for the 5 wt% Mo/HZSM-5 (4.0 μm) and 5 wt% Mo/HZSM-5 (1.0 μm), respectively. A longer time, particularly at the lower space velocities, is needed for the 5 wt% Mo/HZSM-5 (4.0 μm) catalyst to reach its maximum benzene activity. This suggests an effect of longer zeolite channels creating a stronger diffusion resistance.9 Additionally, the maximum benzene concentration remains almost unchanged in the range of space velocities from 3500 to 8000 mL h−1 g−1, decreases between 8000 and 40![[thin space (1/6-em)]](https://www.rsc.org/images/entities/char_2009.gif) 000 mL h−1 g−1 and remains nearly constant again >40
000 mL h−1 g−1 and remains nearly constant again >40![[thin space (1/6-em)]](https://www.rsc.org/images/entities/char_2009.gif) 000 mL h−1 g−1. At the highest space velocity tested, 60
000 mL h−1 g−1. At the highest space velocity tested, 60![[thin space (1/6-em)]](https://www.rsc.org/images/entities/char_2009.gif) 000 mL g−1 h−1, the maximum benzene concentration is observed at the second time point of 60 s for both catalyst samples. Note that this period of time is 5 times longer than the 12 s needed for the complete purge of the whole reactor (at a space velocity of 8400 mL h−1 g−1). Thus, the maximum benzene formation activities of the catalysts are measured at all tested space velocities in the employed approach. Furthermore, all space velocities in the present study were tested with a fixed catalyst amount so that the effect of space velocity could be ascribed here to that of superficial velocity. Thus, the maximum benzene rates (rB) at the tested space velocities were estimated according to eqn (1) in order to quantitatively evaluate the influence of superficial velocity on the maximum benzene formation activities of the two catalysts.
000 mL g−1 h−1, the maximum benzene concentration is observed at the second time point of 60 s for both catalyst samples. Note that this period of time is 5 times longer than the 12 s needed for the complete purge of the whole reactor (at a space velocity of 8400 mL h−1 g−1). Thus, the maximum benzene formation activities of the catalysts are measured at all tested space velocities in the employed approach. Furthermore, all space velocities in the present study were tested with a fixed catalyst amount so that the effect of space velocity could be ascribed here to that of superficial velocity. Thus, the maximum benzene rates (rB) at the tested space velocities were estimated according to eqn (1) in order to quantitatively evaluate the influence of superficial velocity on the maximum benzene formation activities of the two catalysts.| rB = FoutCB ≈ αFinCB | (1) |
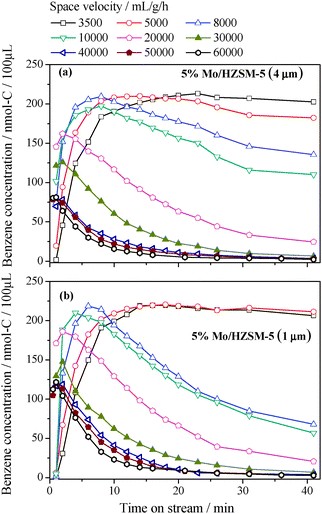 | ||
| Fig. 3 Variations of outlet benzene concentration with time and space velocity for the two tested 5% Mo/HZSM-5 catalysts at 1073 K. (a) 5% Mo/HZSM-5 (4 μm); (b) 5% Mo/HZSM-5 (1 μm). | ||
The estimated benzene rates are plotted against space velocity in Fig. 4. In the same figure the maximum benzene concentrations taken from Fig. 3 are also plotted for comparison. Since an inlet flow rate, instead of the corresponding outlet flow rate, was used for each estimation, an error occurred with the margin defined by the difference between the corrected inlet and real outlet flow rates. For the present volume-increasing reaction, the difference varies essentially according to conversion and reaches the largest as the reaction approaches the equilibrium. Thus, about 21% of the equilibrium conversion at the used condition limits the maximum difference not over 14% between the inlet and outlet flow rates. Note that the reaction is away from the equilibrium at all high space velocities of >10![[thin space (1/6-em)]](https://www.rsc.org/images/entities/char_2009.gif) 000 mL g−1 h−1 (Fig. 3). This implies that the real differences between the inlet and outlet flow rates reached in most of the tests in this work must be lower than 14%. Actually, at 20
000 mL g−1 h−1 (Fig. 3). This implies that the real differences between the inlet and outlet flow rates reached in most of the tests in this work must be lower than 14%. Actually, at 20![[thin space (1/6-em)]](https://www.rsc.org/images/entities/char_2009.gif) 000 mL g−1 h−1 the maximum CH4 conversion was measured to be 16%,9 which suggests a rate difference of about 11%. That is, the true errors in the estimation according to eqn (1) would be within 11% in the cases where the higher space velocities of >20
000 mL g−1 h−1 the maximum CH4 conversion was measured to be 16%,9 which suggests a rate difference of about 11%. That is, the true errors in the estimation according to eqn (1) would be within 11% in the cases where the higher space velocities of >20![[thin space (1/6-em)]](https://www.rsc.org/images/entities/char_2009.gif) 000 mL g−1 h−1 were tested.
000 mL g−1 h−1 were tested.
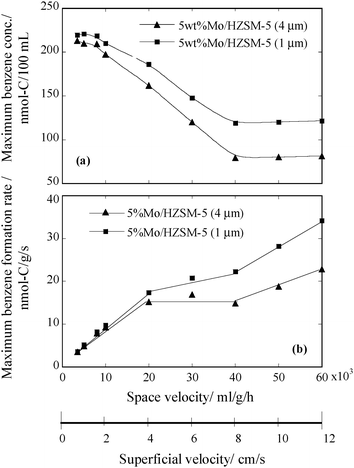 | ||
| Fig. 4 Velocity dependences of the maximum benzene formation activities of the two tested Mo/HZSM-5 catalysts at 1073 K. (a) The maximum outlet benzene concentration vs. space velocity; (b) the maximum benzene formation rate vs. space velocity (superficial velocity). | ||
As shown in Fig. 4(b), in the range of 3500 to 20![[thin space (1/6-em)]](https://www.rsc.org/images/entities/char_2009.gif) 000 mL g−1 h−1 the estimated benzene formation rate increases almost linearly for both 5 wt% Mo/HZSM-5 (4.0 μm) and 5 wt% Mo/HZSM-5 (1.0 μm); between 20
000 mL g−1 h−1 the estimated benzene formation rate increases almost linearly for both 5 wt% Mo/HZSM-5 (4.0 μm) and 5 wt% Mo/HZSM-5 (1.0 μm); between 20![[thin space (1/6-em)]](https://www.rsc.org/images/entities/char_2009.gif) 000 and 40
000 and 40![[thin space (1/6-em)]](https://www.rsc.org/images/entities/char_2009.gif) 000 mL g−1 h−1 it remains constant for the former catalyst but slightly increases for the latter; and from 40
000 mL g−1 h−1 it remains constant for the former catalyst but slightly increases for the latter; and from 40![[thin space (1/6-em)]](https://www.rsc.org/images/entities/char_2009.gif) 000 to 60
000 to 60![[thin space (1/6-em)]](https://www.rsc.org/images/entities/char_2009.gif) 000 mL g−1 h−1 it exhibits another increase for both of the catalysts. Since the contribution of the increasing feed (CH4) flow rate to raising the benzene formation rate in the region of 8000–20
000 mL g−1 h−1 it exhibits another increase for both of the catalysts. Since the contribution of the increasing feed (CH4) flow rate to raising the benzene formation rate in the region of 8000–20![[thin space (1/6-em)]](https://www.rsc.org/images/entities/char_2009.gif) 000 mL g−1 h−1 is greater than the contribution of the decreasing outlet benzene concentration to lowering it (Fig. 4(a)), the overall rate in the region keeps increasing. Between 20
000 mL g−1 h−1 is greater than the contribution of the decreasing outlet benzene concentration to lowering it (Fig. 4(a)), the overall rate in the region keeps increasing. Between 20![[thin space (1/6-em)]](https://www.rsc.org/images/entities/char_2009.gif) 000 and 40
000 and 40![[thin space (1/6-em)]](https://www.rsc.org/images/entities/char_2009.gif) 000 mL g−1 h−1, the two factors cancel each other and therefore a constant benzene formation rate is observed. At the space velocities >40
000 mL g−1 h−1, the two factors cancel each other and therefore a constant benzene formation rate is observed. At the space velocities >40![[thin space (1/6-em)]](https://www.rsc.org/images/entities/char_2009.gif) 000 mL g−1 h−1 the maximum benzene concentration stops decreasing with the increasing space velocity and the negative contribution no longer exists, and therefore the maximum benzene formation rate exhibits again a steady increase with the increasing space velocity.
000 mL g−1 h−1 the maximum benzene concentration stops decreasing with the increasing space velocity and the negative contribution no longer exists, and therefore the maximum benzene formation rate exhibits again a steady increase with the increasing space velocity.
Similar tests were performed for the same catalysts at a lower temperature of 923 K. Similar variations of the maximum outlet benzene concentration with space velocity were obtained to further confirm the existence of three different rate-controlling regions in the title reaction.18 Moreover, another confirmation test was conducted with a 5 wt% Mo/(SiO2–Al2O3) catalyst, which has a ratio of SiO2/Al2O3 = 40 and a BET surface area of 350 m2 g−1 and is in sizes of 250–500 μm. The used space velocity was 60![[thin space (1/6-em)]](https://www.rsc.org/images/entities/char_2009.gif) 000 mL g−1 h−1. The obtained maximum outlet benzene concentration was about one tenth of that recorded for the 5 wt% Mo/HZSM-5 (1.0 μm), which confirms that the observed benzene formation at the higher space velocities did take place in the zeolite channels, not at the zeolite's external surface.
000 mL g−1 h−1. The obtained maximum outlet benzene concentration was about one tenth of that recorded for the 5 wt% Mo/HZSM-5 (1.0 μm), which confirms that the observed benzene formation at the higher space velocities did take place in the zeolite channels, not at the zeolite's external surface.
![[thin space (1/6-em)]](https://www.rsc.org/images/entities/char_2009.gif) 000 mL g−1 h−1 in Fig. 3, being about 4 cm s−1. Further note that in the region of velocities from 4 to 8 cm s−1 the benzene rate, as shown in Fig. 4(b), is no longer increasing with increasing the space velocity but remains essentially unchanged. All these thus suggest that the first rate increase in the low space velocity region of <20
000 mL g−1 h−1 in Fig. 3, being about 4 cm s−1. Further note that in the region of velocities from 4 to 8 cm s−1 the benzene rate, as shown in Fig. 4(b), is no longer increasing with increasing the space velocity but remains essentially unchanged. All these thus suggest that the first rate increase in the low space velocity region of <20![[thin space (1/6-em)]](https://www.rsc.org/images/entities/char_2009.gif) 000 mL g−1 h−1 in Fig. 4(b) is because the steady increase of the CH4 feed rate reduced the external diffusion resistance. Namely, in this region the reaction is rate-limited by external mass transfer. Iliuta and co-workers also checked the effect of external diffusion, but these authors performed their tests over a very narrow region of space velocity (130–770 mL g−1 h−1) and therefore reached an opposite conclusion.19
000 mL g−1 h−1 in Fig. 4(b) is because the steady increase of the CH4 feed rate reduced the external diffusion resistance. Namely, in this region the reaction is rate-limited by external mass transfer. Iliuta and co-workers also checked the effect of external diffusion, but these authors performed their tests over a very narrow region of space velocity (130–770 mL g−1 h−1) and therefore reached an opposite conclusion.19
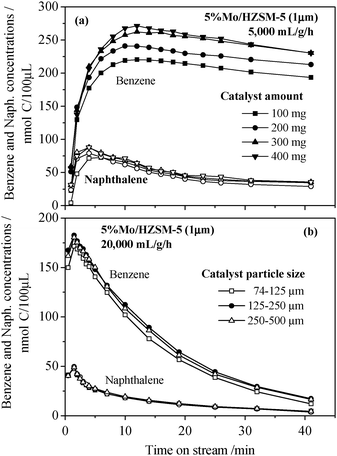 | ||
Fig. 5 Time dependences of the outlet benzene and naphthalene concentrations observed over the 5% Mo/HZSM-5 (1.0 μm) catalyst at different conditions: (a) 1073 K and a fixed space velocity of 5000 mL g−1 h−1 reached with different catalyst amounts, (b) 1073 K and 20![[thin space (1/6-em)]](https://www.rsc.org/images/entities/char_2009.gif) 000 mL g−1 h−1 over the catalyst particles of different sizes. 000 mL g−1 h−1 over the catalyst particles of different sizes. | ||
![[thin space (1/6-em)]](https://www.rsc.org/images/entities/char_2009.gif) 000 mL g−1 h−1 was employed in these tests to eliminate the effect of external diffusion. The results obtained are given in Fig. 5(b). The outlet maximum benzene concentration reaches almost the identical values of 175–185 nmol C per 100 μL at the same time point of 2 min in the three tests and little effect of the particle size is observed on the maximum benzene formation activity of the catalyst. This confirms that intercrystalline diffusion limitations are absent at the used condition. At 973 K and a very low space velocity of 1000 h−1 Shu and co-workers reported that a powdery 2 wt% Mo/HZSM-5 catalyst provided a higher methane conversion than the same but pelleted catalyst (10–30 mesh).20 Based on the present observation, the higher activity of their powder-catalyst can be attributed to its higher external surface area, which certainly increases the overall benzene formation rate under external transfer controlling conditions.
000 mL g−1 h−1 was employed in these tests to eliminate the effect of external diffusion. The results obtained are given in Fig. 5(b). The outlet maximum benzene concentration reaches almost the identical values of 175–185 nmol C per 100 μL at the same time point of 2 min in the three tests and little effect of the particle size is observed on the maximum benzene formation activity of the catalyst. This confirms that intercrystalline diffusion limitations are absent at the used condition. At 973 K and a very low space velocity of 1000 h−1 Shu and co-workers reported that a powdery 2 wt% Mo/HZSM-5 catalyst provided a higher methane conversion than the same but pelleted catalyst (10–30 mesh).20 Based on the present observation, the higher activity of their powder-catalyst can be attributed to its higher external surface area, which certainly increases the overall benzene formation rate under external transfer controlling conditions.
![[thin space (1/6-em)]](https://www.rsc.org/images/entities/char_2009.gif) 000–40
000–40![[thin space (1/6-em)]](https://www.rsc.org/images/entities/char_2009.gif) 000 mL g−1 h−1 the maximum outlet benzene concentration keeps a monotonous decrease, while the corresponding maximum benzene rate remains essentially unchanged for the 5 wt% Mo/HZSM-5 (4.0 μm) and slightly increases for the 5 wt% Mo/HZSM-5 (1.0 μm) (Fig. 4). Observed out of the region of external diffusion and without the presence of intercrystalline diffusion resistance, these very limited variations suggest that the reaction is rate-controlled in the region essentially by intracrystalline diffusion and both Mo2C and free Brønsted acid sites in the inside of the HZSM-5 channels are involved in benzene formation.16,17 Note that at a given temperature the rate of diffusion of formed benzene in HZSM-5 channels is essentially determined by the channel structure and dimension with little influence from benzene's partial pressure within the mesopores (intercrystalline spaces) of any individual catalyst particle. Therefore, the benzene rate could remain constant over this middle space velocity region. In this region the 5 wt% Mo/HZSM-5 (1.0 μm) exhibits a higher benzene rate than 5 wt% Mo/HZSM-5 (4.0 μm), although the lower Brønsted acidity and Mo dispersion of the former catalyst has predicted a lower benzene formation activity (Fig. 2). For this discrepancy the only plausible explanation is that the 5 wt% Mo/HZSM-5 (1.0 μm) catalyst obtained from the ball-milled zeolite sample has a smaller average crystal size and shorter zeolite channels available for the diffusion of formed benzene.9 That is, the increase in the number of the zeolite channels in the former catalyst improves its overall maximum benzene rate in the intracrystalline diffusion-controlled region.
000 mL g−1 h−1 the maximum outlet benzene concentration keeps a monotonous decrease, while the corresponding maximum benzene rate remains essentially unchanged for the 5 wt% Mo/HZSM-5 (4.0 μm) and slightly increases for the 5 wt% Mo/HZSM-5 (1.0 μm) (Fig. 4). Observed out of the region of external diffusion and without the presence of intercrystalline diffusion resistance, these very limited variations suggest that the reaction is rate-controlled in the region essentially by intracrystalline diffusion and both Mo2C and free Brønsted acid sites in the inside of the HZSM-5 channels are involved in benzene formation.16,17 Note that at a given temperature the rate of diffusion of formed benzene in HZSM-5 channels is essentially determined by the channel structure and dimension with little influence from benzene's partial pressure within the mesopores (intercrystalline spaces) of any individual catalyst particle. Therefore, the benzene rate could remain constant over this middle space velocity region. In this region the 5 wt% Mo/HZSM-5 (1.0 μm) exhibits a higher benzene rate than 5 wt% Mo/HZSM-5 (4.0 μm), although the lower Brønsted acidity and Mo dispersion of the former catalyst has predicted a lower benzene formation activity (Fig. 2). For this discrepancy the only plausible explanation is that the 5 wt% Mo/HZSM-5 (1.0 μm) catalyst obtained from the ball-milled zeolite sample has a smaller average crystal size and shorter zeolite channels available for the diffusion of formed benzene.9 That is, the increase in the number of the zeolite channels in the former catalyst improves its overall maximum benzene rate in the intracrystalline diffusion-controlled region.
Transferring through the zeolite channels naphthalene is thought to be more diffusion-resistant than benzene and hence its ratio in the reacted stream could be indicative of intracrystalline diffusion limitations. Therefore, the variation in the naphthalene to benzene concentration ratio with space velocity is shown in Fig. 6 to further confirm the existence of intracrystalline diffusion resistance. As anticipated, the 5 wt% Mo/HZSM-5 (1.0 μm) exhibited higher naphthalene to benzene ratios than 5 wt% Mo/HZSM-5 (4.0 μm) at all tested space velocities. Furthermore, the naphthalene to benzene ratio slightly decreases with increasing space velocity in the region of >20![[thin space (1/6-em)]](https://www.rsc.org/images/entities/char_2009.gif) 000 mL g−1 h−1 for the 5% Mo/HZSM-5 (4.0 μm) sample, also suggesting the effect of intracrystalline diffusion limitations.
000 mL g−1 h−1 for the 5% Mo/HZSM-5 (4.0 μm) sample, also suggesting the effect of intracrystalline diffusion limitations.
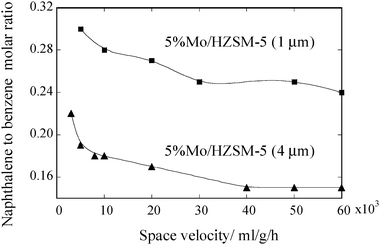 | ||
| Fig. 6 The naphthalene to benzene nmol-C ratio vs. space velocity. The ratios were taken for each catalyst at its maximum benzene formation activities recorded at the different space velocities. | ||
![[thin space (1/6-em)]](https://www.rsc.org/images/entities/char_2009.gif) 000 mL g−1 h−1 in the present study (Fig. 3) completely denies such possibility. With another 6 wt% Mo/HZSM-5 catalyst based on another commercial zeolite of Si/Al = 15 (Zeolist International), we confirmed that variation of the maximum benzene concentration with space velocity in such high space velocity region might not be an accidental event. In the region of 40
000 mL g−1 h−1 in the present study (Fig. 3) completely denies such possibility. With another 6 wt% Mo/HZSM-5 catalyst based on another commercial zeolite of Si/Al = 15 (Zeolist International), we confirmed that variation of the maximum benzene concentration with space velocity in such high space velocity region might not be an accidental event. In the region of 40![[thin space (1/6-em)]](https://www.rsc.org/images/entities/char_2009.gif) 000–60
000–60![[thin space (1/6-em)]](https://www.rsc.org/images/entities/char_2009.gif) 000 mL g−1 h−1 the maximum benzene concentration is no longer decreasing with increasing feed rate and remains almost constant, actually indicating a net increase in the maximum benzene rate (Fig. 4(b)). While suggesting that intracrystalline diffusion would no longer be the only rate-controlling factor in the region, this observation also suggests that the kinetic-desorption-controlled benzene formation over active sites in the pore mouth region might come into play as well. In fact, with a low content of CH4 in N2 as the feed, Sarioglan et al. observed a linear increase in the ratio of maximum hydrocarbon formation rate to the number of acid sites in the external layers of HZSM-5 crystals with the increase in their external surface area at 973 K.8 Estimation of the real gas velocity through their reactor in their tests revealed that it was approximately 7.7 cm s−1. It is very close to the velocity of 8.4 cm s−1 reached in our tests at 40
000 mL g−1 h−1 the maximum benzene concentration is no longer decreasing with increasing feed rate and remains almost constant, actually indicating a net increase in the maximum benzene rate (Fig. 4(b)). While suggesting that intracrystalline diffusion would no longer be the only rate-controlling factor in the region, this observation also suggests that the kinetic-desorption-controlled benzene formation over active sites in the pore mouth region might come into play as well. In fact, with a low content of CH4 in N2 as the feed, Sarioglan et al. observed a linear increase in the ratio of maximum hydrocarbon formation rate to the number of acid sites in the external layers of HZSM-5 crystals with the increase in their external surface area at 973 K.8 Estimation of the real gas velocity through their reactor in their tests revealed that it was approximately 7.7 cm s−1. It is very close to the velocity of 8.4 cm s−1 reached in our tests at 40![[thin space (1/6-em)]](https://www.rsc.org/images/entities/char_2009.gif) 000 mL g−1 h−1. If this excellent consistency occurred not accidentally, these two numbers might strongly suggest the involvement of kinetically controlled benzene formation over the sites at the zeolite pore mouths in the region of space velocities >40
000 mL g−1 h−1. If this excellent consistency occurred not accidentally, these two numbers might strongly suggest the involvement of kinetically controlled benzene formation over the sites at the zeolite pore mouths in the region of space velocities >40![[thin space (1/6-em)]](https://www.rsc.org/images/entities/char_2009.gif) 000 mL g−1 h−1.
000 mL g−1 h−1.
Thus, eqn (2), which is based on the Langmuir–Hinshelwood mechanism, is used to explain this part of contribution to the total benzene formation.
| rB = k+θB − k−pBθ* | (2) |
It is further worth noting here that at a constant θB the rate defined by eqn (2) will approach zero as pB is over a certain level to leave the second term in the right hand side of the equation a value close to that of the first term. Namely, for the title reaction there must exist a critical pB over which kinetic desorption-controlled benzene formation in the pore mouth region would make little contribution to the overall benzene formation rate. It is clear from Fig. 4 that such critical pB must correspond to the space velocity of 40![[thin space (1/6-em)]](https://www.rsc.org/images/entities/char_2009.gif) 000 mL g−1 h−1. At any lower space velocity, for an increased benzene concentration in the stream, pB becomes higher to fully suppress the kinetic desorption of benzene from those sites in the pore mouth region, and consequently easier desorption from rather weaker adsorption sites, such as Si–OH groups on the external surface of HZSM-5 crystals,21 would come to dominate the evolution of surface benzene into the intercrystalline spaces (mesopores). In the case that the activation energy required for such easier desorption is much smaller than that for the diffusion of benzene out of the zeolite channels, the whole process must be rate-controlled by intracrystalline diffusion; this might be what happened in the region of 20
000 mL g−1 h−1. At any lower space velocity, for an increased benzene concentration in the stream, pB becomes higher to fully suppress the kinetic desorption of benzene from those sites in the pore mouth region, and consequently easier desorption from rather weaker adsorption sites, such as Si–OH groups on the external surface of HZSM-5 crystals,21 would come to dominate the evolution of surface benzene into the intercrystalline spaces (mesopores). In the case that the activation energy required for such easier desorption is much smaller than that for the diffusion of benzene out of the zeolite channels, the whole process must be rate-controlled by intracrystalline diffusion; this might be what happened in the region of 20![[thin space (1/6-em)]](https://www.rsc.org/images/entities/char_2009.gif) 000–40
000–40![[thin space (1/6-em)]](https://www.rsc.org/images/entities/char_2009.gif) 000 mL g−1 h−1.
000 mL g−1 h−1.
4. Conclusions
The experimental tests on the two 5 wt% Mo/HZSM-5 catalysts at 1073 K and over a wide range of space velocities (from 3500 to 60![[thin space (1/6-em)]](https://www.rsc.org/images/entities/char_2009.gif) 000 mL g−1 h−1) show that the maximum outlet benzene concentration reached in the non-oxidative methane dehydroaromatization remains unchanged in the region of 3500–8000 mL g−1 h−1, decreases between 8000 and 40
000 mL g−1 h−1) show that the maximum outlet benzene concentration reached in the non-oxidative methane dehydroaromatization remains unchanged in the region of 3500–8000 mL g−1 h−1, decreases between 8000 and 40![[thin space (1/6-em)]](https://www.rsc.org/images/entities/char_2009.gif) 000 mL g−1 h−1 and remains constant again in the region of 40
000 mL g−1 h−1 and remains constant again in the region of 40![[thin space (1/6-em)]](https://www.rsc.org/images/entities/char_2009.gif) 000–60
000–60![[thin space (1/6-em)]](https://www.rsc.org/images/entities/char_2009.gif) 000 mL g−1 h−1. In terms of the maximum benzene formation rate, this observation reveals that three different rate-controlling regions exist for the title catalytic reaction: <20
000 mL g−1 h−1. In terms of the maximum benzene formation rate, this observation reveals that three different rate-controlling regions exist for the title catalytic reaction: <20![[thin space (1/6-em)]](https://www.rsc.org/images/entities/char_2009.gif) 000, between 20
000, between 20![[thin space (1/6-em)]](https://www.rsc.org/images/entities/char_2009.gif) 000–40
000–40![[thin space (1/6-em)]](https://www.rsc.org/images/entities/char_2009.gif) 000, and >40
000, and >40![[thin space (1/6-em)]](https://www.rsc.org/images/entities/char_2009.gif) 000 mL g−1 h−1. While the confirmation tests at a fixed space velocity but the increasing superficial velocities demonstrated that the benzene formation rate in the low space velocity region is totally controlled by external mass transfer, the tests over the catalyst samples in the sizes of 250–500, 125–250 and 74–125 μm confirm little effect of intercrystalline diffusion on the overall benzene rate at 20
000 mL g−1 h−1. While the confirmation tests at a fixed space velocity but the increasing superficial velocities demonstrated that the benzene formation rate in the low space velocity region is totally controlled by external mass transfer, the tests over the catalyst samples in the sizes of 250–500, 125–250 and 74–125 μm confirm little effect of intercrystalline diffusion on the overall benzene rate at 20![[thin space (1/6-em)]](https://www.rsc.org/images/entities/char_2009.gif) 000 mL g−1 h−1. Thus, with the difference in the naphthalene to benzene ratio observed between the two catalysts, the constant benzene formation rate observed between 20
000 mL g−1 h−1. Thus, with the difference in the naphthalene to benzene ratio observed between the two catalysts, the constant benzene formation rate observed between 20![[thin space (1/6-em)]](https://www.rsc.org/images/entities/char_2009.gif) 000 and 40
000 and 40![[thin space (1/6-em)]](https://www.rsc.org/images/entities/char_2009.gif) 000 mL g−1 h−1 is reasonably attributed to intracrystalline diffusion limitations. At space velocities >40
000 mL g−1 h−1 is reasonably attributed to intracrystalline diffusion limitations. At space velocities >40![[thin space (1/6-em)]](https://www.rsc.org/images/entities/char_2009.gif) 000 mL g−1 h−1, a further decrease in the partial pressure of benzene in the mesopores surely promotes its desorption from the external surfaces of the zeolite crystals into the intercrystalline spaces to leave more sites in the pore mouth region unoccupied. Consequently sites in the region are more often involved in the kinetically controlled benzene formation, to give rise to the second increase of the overall benzene rate. In summary, the graphics in Fig. 7 are used to make a schematic illustration of the three different rate-controlling steps of the reaction at 1073 K.
000 mL g−1 h−1, a further decrease in the partial pressure of benzene in the mesopores surely promotes its desorption from the external surfaces of the zeolite crystals into the intercrystalline spaces to leave more sites in the pore mouth region unoccupied. Consequently sites in the region are more often involved in the kinetically controlled benzene formation, to give rise to the second increase of the overall benzene rate. In summary, the graphics in Fig. 7 are used to make a schematic illustration of the three different rate-controlling steps of the reaction at 1073 K.
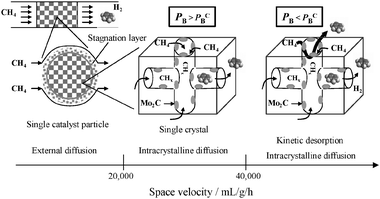 | ||
| Fig. 7 The schemes of three different rate-controlling regions existing in the methane dehydroaromatization at 1073 K. PB refers to the partial pressure of benzene in the intercrystalline spaces (mesopores) in any single catalyst particle and PBC represents a critical PB, below which the kinetic formation of benzene over sites in the pore mouth region and its kinetic desorption into the intercrystalline spaces comes into play to increase its overall rate together with the intracrystalline diffusion controlled benzene evolution. | ||
Notes and references
- Y. Xu and L. Lin, Appl. Catal., A, 1999, 188, 53 CrossRef CAS.
- J. H. Lunsford, Catal. Today, 2000, 63, 165 CrossRef CAS.
- J.-P. Tessonnier, B. Louis, M.-J. Ledoux and C. Pham-Huu, Catal. Commun., 2007, 8, 1787 CrossRef CAS.
- K. Skutil and M. Taniewski, Fuel Process. Technol., 2006, 87, 511 CrossRef CAS.
- B. Cook, D. Mousko, W. Hoelderich and R. Zennaro, Appl. Catal., A, 2008, 365, 34 Search PubMed.
- Y. Shudo, T. Ohkubo, Y. Hideshima and T. Kiyama, Int. J. Hydrogen Energy, 2009, 34, 450 Search PubMed.
- M. P. Gimeno, J. Soler, J. Herguido and M. Menendez, Ind. Eng. Chem. Res., 2010, 49, 996 Search PubMed.
- A. Sarioglan, O. T. Savasci, A. Erdem-Senatalar, A. Tuel, G. Sapaly and Y. B. Taarit, J. Catal., 2007, 246, 35 CrossRef.
- Y. B. Cui, Y. B. Xu, J. Y. Lu, Y. Suzuki and Z.-G. Zhang, Appl. Catal., A, 2011, 393, 348 Search PubMed.
- J. Y. Lu, Y. B. Xu, Y. Suzuki and Z.-G. Zhang, Catal. Commun., 2010, 12, 127 Search PubMed.
- Y. B. Xu, J. Y. Lu, J. D. Wang, Y. Suzuki and Z.-G. Zhang, Chem. Eng. J. (Amsterdam, Neth.), 2011, 168, 390 Search PubMed.
- Y. Xu, Y. Shu, S. Liu, J. Huang and X. Guo, Catal. Lett., 1995, 35, 233 CrossRef CAS.
- Z.-T. Xiong, H.-B. Zhang, G.-D. Lin and J.-L. Zeng, Catal. Lett., 2001, 74, 233 Search PubMed.
- D. Ma, Y. Lu, L. Su, Z. Xu, Z. Tian, Y. Xu, L. Lin and X. Bao, J. Phys. Chem. B, 2002, 106, 8524 Search PubMed.
- Y. Xu, X. Bao and L. Lin, J. Catal., 2003, 216, 386 CrossRef CAS.
- J.-P. Tessonnier, B. Louis and S. Walspurger, J. Phys. Chem. B, 2006, 110, 10390 CrossRef CAS.
- J.-P. Tessonnier, B. Louis, S. Rigolet, M.-J. Ledoux and C. Pham-Huu, Appl. Catal., A, 2008, 336, 79 CrossRef CAS.
- Unpublished data available upon request.
- M. C. Iliuta, I. Iliuta, B. P. A. Grandjean and F. Larachi, Ind. Eng. Chem. Res., 2003, 42, 3203 Search PubMed.
- J. Shu, A. Adnot and B. P. A. Grandjean, Ind. Eng. Chem. Res., 1999, 38, 3860 Search PubMed.
- A. Jentys, H. Tanaka and J. A. Lercher, J. Phys. Chem. B, 2005, 109, 2254 CrossRef CAS.
| This journal is © The Royal Society of Chemistry 2011 |

