Enhanced catalytic activity of α-Fe2O3 nanorods enclosed with {110} and {001} planes for methane combustion and CO oxidation†
Qi-Xiu
Gao
,
Xiao-Fang
Wang
,
Jie-Ling
Di
,
Xing-Cai
Wu
* and
You-Rong
Tao
*
Key Laboratory of Mesoscopic Chemistry of MOE, and School of Chemistry and Chemical Engineering, Nanjing University, Nanjing 210093, P. R. China. E-mail: wuxingca@netra.nju.edu.cn, yrtao@nju.edu.cn; Fax: +86-25-83317761; Tel: +86-25-83597374
First published on 18th May 2011
Abstract
Hematite (α-Fe2O3) nanorods, nanotubes, and nanocubes were selectively synthesized via a hydrothermal process and subsequent calcination treatment. The nanorods showed higher catalytic activity than the nanotubes and the nanocubes for methane combustion and CO oxidation. It may be attributed to the highest occupancy of iron ions on the surface of the nanorods.
1. Introduction
The performance of catalysts depends not only on their chemical composition, size, morphology, but also greatly on the arrangement manners of their surface atoms.1–3 For example, the Pt (111)/Ru electrode was found to be the best fuel-cell anode for methane oxidation;4 ceria nanorods with predominantly exposed planes {001} and {110} showed enhancement of catalytic activity for CO oxidation than the irregular ceria nanoparticles with predominantly exposed planes {111};5Co3O4 nanorods predominantly exposing facets {110} revealed higher activity and stability for CO oxidation than Co3O4 polycrystals at temperatures as low as −77 °C;6 the high index {112} crystal planes of Co3O4 nanocrystals are more reactive than the basic {001} and {011} planes for methane combustion.7 However, most of the heterogeneous catalysts at present consist of assorted polycrystals with various geometries and exposed surfaces. Although they possess a few active sites, they still show lower catalytic activity because of lack in predominantly exposed facets. Therefore, it is an effectual way to design and synthesize micro/nano-crystals with predominantly specific exposed facets to enhance catalytic activity.Hematite (α-Fe2O3), the most stable iron oxide with n-type semiconducting properties (Eg = 2.1 eV) under ambient conditions, is widely used as catalysts, pigments, gas sensors, and electrode materials,8 because of its low cost, high resistance to corrosion, and environmentally friendly properties. Over several years its nanostructures such as nanocubes,9,10nanorods,11–13 nanobelts,14,15nanotubes,16–18 nanoflowers,19 nanorings20 and dendritic micro-pines21 have been prepared and showed a few specific applications. To lower the cost of catalytic combustion, Kwon et al. once used nano-Fe2O3 as catalysts for carbon monoxide and methane combustion, and discovered that nano-Fe2O3 is more active than micro-Fe2O3.22 Liu et al. once used α-Fe2O3 nanorods, and nanocubes as catalysts for CO oxidation, and discovered that the nanorods with more reactive crystal planes {110} showed a higher activity than the nanocubes, but they dealt with neither methane combustion nor catalytic performance of α-Fe2O3 nanotubes.23 Herein we selectively synthesized α-Fe2O3 nanorods, nanotubes, and nanocubes via a hydrothermal method, and discovered that α-Fe2O3 nanorods enclosed with {110} and {001} planes exhibited an enhanced catalytic activity for both methane combustions and CO oxidation.
2. Experimental methods
Sample preparation
Preparation of α-Fe2O3 nanorods: 2.1881 g of Fe(NO3)3·9H2O was dissolved in 30 mL of deionized water, and then a 10 wt% NaOH solution was added dropwise to adjust the pH value of the solution to 12 under vigorous stirring. Here a brown precipitate appeared. After continuously stirring for about 30 min, all of the suspension (about 45 mL) was transferred into a 65 mL Teflon-lined stainless steel autoclave and treated at 180 °C for 12 h. The products were separated by centrifugation, rinsed several times with deionized water and absolute ethanol, respectively. Finally the products were dried at 80 °C for 4 h in air, and calcined at 600 °C for 1 h.Preparation of α-Fe2O3 nanotubes: 2.0 mL of FeCl3 aqueous solution (0.5 mol L−1) and 1.8 mL NH4H2PO4 aqueous solution (0.02 mol L−1) were mixed with vigorous stirring. Then deionized water was added in order to reach a final volume of 50 mL. After stirring for 10 min, the mixture was transferred into a Teflon-lined stainless-steel autoclave with a capacity of 65 mL for hydrothermal treatment at 220 °C for 48 h. The subsequent treatment is as above.
Preparation of α-Fe2O3 nanocubes: 1.62 g of FeCl3·6H2O was dissolved in 50 mL of a cetyltrimethylammonium bromide (CTAB) aqueous solution (CCTAB = 0.04 mol L−1). The whole mixture was stirred for 30 min, and then transferred into a Teflon-lined stainless steel autoclave with a capacity of 65 mL, sealed, and maintained at 120 °C for 32 h. The subsequent treatment is as above.
Characterization
All chemicals were of analytical grade and were used as received without further purification. The as-synthesized products were characterized by an X-ray diffractometer (XRD; Shimadzu XRD-6000) with graphite monochromatized Cu Kα1-radiation, a scanning electron microscope (SEM; S-4800) and high-resolution electron microscopy with a point resolution of 0.19 nm (HRTEM; JEOL model JEM-2100). Nitrogen adsorption–desorption isotherms were obtained at 77 K on a Micromeritics ASAP 2020 apparatus after degassing of the samples at 300 °C for 2 h, and the Brunauer–Emmett–Teller (BET) specific surface area were calculated using BET adsorption data acquired at the relative pressure range from 0.06 to 0.2, and the pore size distribution was calculated from the nitrogen desorption isotherm by the Barrett–Joyner–Halenda (BJH) method.Catalytic activity measurements
The catalytic activity for methane combustion was measured in a quartz-tube plug flow reactor (inner diameter, 6 mm; length, 250 mm) using 40 mg of catalysts (for each test) in a gas mixture of 1.99 vol% CH4 and 80.01 vol% air at a space velocity of 25![[thin space (1/6-em)]](https://www.rsc.org/images/entities/char_2009.gif) 500 cm3 g−1 h−1. Similarly, the catalytic activities for CO oxidation were measured with a mixed gas of 2 vol% CO, and 98 vol% air. The products were analyzed by an on-line gas chromatography with a 5A molecular sieve chromatography column for separating N2, O2, CO, CO2 and CH4, and thermal conduction detectors (TCDs). After the reaction was stabilized for 30 min, data were recorded.
500 cm3 g−1 h−1. Similarly, the catalytic activities for CO oxidation were measured with a mixed gas of 2 vol% CO, and 98 vol% air. The products were analyzed by an on-line gas chromatography with a 5A molecular sieve chromatography column for separating N2, O2, CO, CO2 and CH4, and thermal conduction detectors (TCDs). After the reaction was stabilized for 30 min, data were recorded.
3. Results and discussions
The X-ray diffraction (XRD) patterns of the nanorods, nanotubes, and nanocubes can be indexed into hexagonal α-Fe2O3 (JCPDS card No.: 33-0664, hematite, Fig. S1, ESI†). Fig. 1(a) and (b) show the transmission electron microscopy (TEM) image of the α-Fe2O3 nanorods and a single nanorod, respectively. The typical nanorod is about 71 nm in width, 7 nm in thickness, and 314 nm in length. Some positions of the nanorods are hollow (inset of Fig. 1b). Fig. 1(c)–(e) exhibit high-resolution transmission electron microscopy (HRTEM) images of part a, b and c in Fig. 1(b), respectively. Fringe spaces of 0.25 nm in Fig. 1(c)–(e) correspond to d-values of (110), (1–20), and (−210) planes, respectively. Their fast Fourier transform (FFT) patterns are displayed in insets, respectively. Based on the above analysis, the structure of the nanorod is drawn in Fig. 1(f). The nanorods are enclosed by six equivalent crystal planes with {110} and two equivalent planes with {001}. Fig. 2(a) and (b) are the SEM and TEM images of α-Fe2O3 nanotubes, respectively. The typical nanotube has an outer diameter of 90–110 nm, inner diameter of 40–80 nm, and lengths of 250–400 nm. Fig. 2(c) reveals a selected area electron diffraction (SAED) pattern of the box in Fig. 2(b), which can be indexed as α-Fe2O3. Fig. 2(d) exhibits the corresponding HRTEM image. Spaces of 0.37 and 0.27 nm correspond to d-values of (012) and (0−14) planes. The FFT pattern and the structure are displayed in top-left and down-right insets, respectively. The nanotubes are enclosed by two preferentially exposed planes with {010} and two planes with {001}. Fig. 3(a)–(c) show that the nanocubes are rhombus cubes with an edge length of about 680 nm. Fig. 3(d) displays the HRTEM image of a single nanocube in Fig. 3(c), and a fringe space of 0.37 nm corresponds to the d-value of (012) plane. Its SAED pattern (top-left inset in Fig. 3(d)) can be indexed as α-Fe2O3. As shown in the down-right inset of Fig. 3(d), the nanocubes are enclosed by planes with {012}, {102}, and {−11−2}.23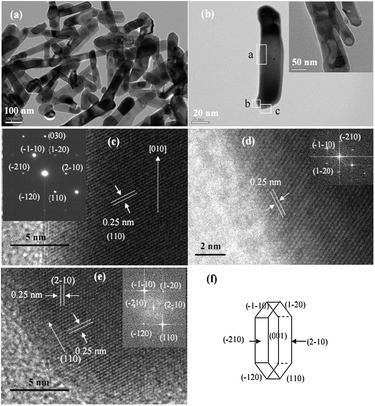 | ||
| Fig. 1 (a) TEM image of a pile of nanorods, (b) TEM image of a single nanorod. (c), (d), and (e) are HRTEM images of part a, b, and c in (b), respectively. (f) Structure of α-Fe2O3 nanorods. | ||
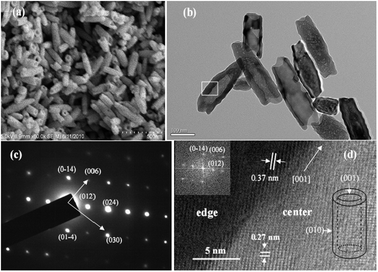 | ||
| Fig. 2 (a) SEM image of nanotubes; (b) TEM image of nanotubes. (c) SAED pattern of the box in (b). (d) HRTEM image of the box in (b); left-above inset is the FFT pattern of the nanotube; right-down inset shows the structure of nanotube. | ||
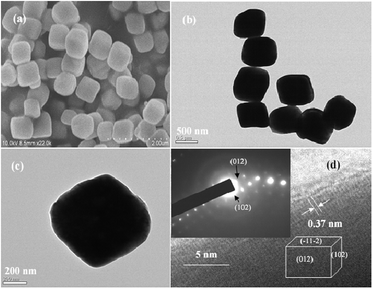 | ||
| Fig. 3 (a) SEM image of nanocubes. (b) TEM image of nanocubes. (c) TEM image of a nanocube. (d) HRTEM image in (c); left-above inset showing a SAED pattern in (c); right-down inset showing the structure of nanocube. | ||
N2 adsorption/desorption isotherms and the pore size distributions of nanorods and nanotubes are shown in Fig. S2(a) and (b) (ESI†), respectively. According to the original IUPAC classification,24 the isotherms are classified as type IV isotherms with H3 type hysteresis loops. According to the extended classification of adsorption isotherms,25 the isotherms are classified as type IIb isotherms. These results indicate typical slit-shaped mesopore performance, and the mesopore should be voids between particles in the aggregates. BJH calculations for the pore-size distribution, derived from desorption data, reveal a narrow distribution. The specific surface area of the nanorods approaches that of nanotubes. The nanotubes possess a higher pore capacity than the nanorods. Because there are no mesopores on the nanocubes, the nanocubes have a knockdown specific surface area. The results are included in Table 1.
| Catalyst | Specific surface area/m2 g−1 | BJH pore size/nm | Pore volume (10−4 cm3 g−1 nm−1) | Temperature (°C) for 50% CH4 conversion | Temperature (°C) for 100% CH4 conversion | Temperature (°C) for 50% CO conversion | Temperature (°C) for 100% CO conversion |
|---|---|---|---|---|---|---|---|
| Nanorods | 10.1 | 86.3 | 6.0 | 443 | 650 | 289 | 370 |
| Nanotubes | 13.7 | 52.0 | 17 | 610 | 750 | 400 | 640 |
| Nanocubes | 0.384 | 557 | 700 | 378 | 580 |
Fig. 4(a) shows the conversions of methane combustion over the nanorods, nanotubes, and nanocubes as a function of reaction temperature. The temperatures of the complete combustions are 650, 750, and 700 °C, respectively. Fig. 4(b) shows the conversions of CO oxidation over the nanorods, nanotubes, and nanocubes as a function of reaction temperature. The temperatures of the complete CO oxidation are 370, 640, and 580 °C, respectively. The order of the catalytic activity is the nanorods > the nanocubes > the nanotubes (Table 1). The activity of the nanorods is higher than nano-Fe2O3.22 However, the order of their BET specific surface area is the nanotubes (13.7 m2 g−1) > nanorods (10.1 m2 g−1) > nanocubes (0.384 m2 g−1). The results mean that the BET surface area is not the sole criterion to determine the activity of catalyst, but the specific crystal facets of α-Fe2O3 nanocrystals are indeed factors influencing the catalytic performances.
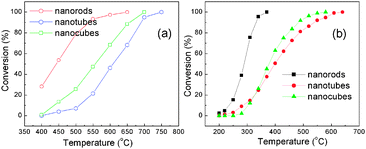 | ||
| Fig. 4 Conversion of (a) methane combustion and (b) CO oxidation as a function of temperature over α-Fe2O3 nanorods, nanotubes, and nanocubes at GHSV = 25500 cm3 g−1 h−1. | ||
Generally, the catalytic oxidation of carbon monoxide by metal oxides can be broken down into two steps. Firstly, metal oxides lose one oxygen atom to carbon monoxide to form carbon dioxide and metal. Secondly, the metal is oxidized into metal oxides.26 Similarly, catalytic combustion of methane also adheres to this reaction process.27 Therefore the tendency of metal oxides to lose one oxygen atom to carbon monoxide or methane is an important effect factor, which is related to the surface densities of the iron atoms (SDIAs) of these nanocrystals.
The SDIAs of {110} and {012} planes are 10.1 and 7.3 atom per nm2, respectively.23 The SDIAs of {102}, {001}, {010} and {−11−2} planes are calculated as 2.44, 4.56, 4.34 and 4.76 atom per nm2, respectively, as shown in Fig. 5. The surface areas of {110} and {001} planes of the nanorods occupy about 11% and 89%, respectively, so {001} planes are the dominantly exposed facets. The surface areas of {010} and {001} planes of the nanotubes occupy about 96% and 4%, respectively, so {010} planes are the dominantly exposed facets. The surface areas of {012}, {102} and {−11−2} planes of the nanocubes occupy about 1/3, respectively, so there is no predominantly exposed facet. Because iron ions are active centres, and by calculation the SDIAs of the nanorods, nanocubes, and nanotubes are about 5.2, 4.9, and 4.3 atom per nm2, respectively, their catalytic activities decrease in order.
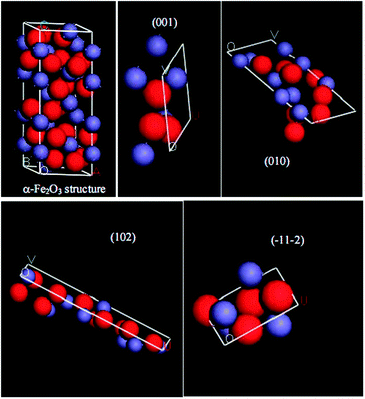 | ||
| Fig. 5 Atomic arrangement of various crystal planes and α-Fe2O3 structure. Blue globes are Fe ions (small); red globes are oxygen ions (large). Occupancy of (001) iron atoms = 1/(0.5035 × 0.5035sin60°) = 4.56 (atom per nm2); occupancy of (010) iron atoms = 3/(1.372 × 0.5035sin90°) = 4.34 (atom per nm2); occupancy of (102) iron atoms = 2/(1.625 × 0.5035sin90°) = 2.44 (atom per nm2); occupancy of (−11−2) iron atoms = 1.3/(0.5419 × 0.5035sin90°) = 4.76 (atom per nm2). | ||
4. Conclusions
The nanorods, nanotubes, and nanocubes of α-Fe2O3 have been successfully synthesized via a hydrothermal process and subsequent calcination treatment. The nanorods are enclosed with {110} and {001} planes, and {001} planes are the dominantly exposed facets. The nanocubes are enclosed with {012}, {102}, and {−11−2} planes, and there are no dominantly exposed facets. The nanotubes are enclosed with {010} and {001} planes, and {010} planes are the dominantly exposed facets. The difference of the SDIAs of the nanorods, nanocubes, and nanotubes leads to that of the catalytic activities. These results show the importance of morphology control in the preparation of transition metal oxides as highly efficient oxidation catalysts.Acknowledgements
The work was financially supported by the National Science Foundations of China (No. 20671050) and National Basic Research Program of China (973 Program, No. 2007CB936302).References
- T. S. Ahmadi, Z. L. Wang, T. C. Green, A. Henglein and M. A. EI-Sayed, Science, 1996, 272, 1924 CrossRef CAS.
- R. Narayanan and M. A. EI-Sayed, J. Am. Chem. Soc., 2004, 126, 7194 CrossRef CAS.
- V. Polshettiwar and R. S. Varma, Green Chem., 2010, 12, 743 RSC.
- W. Chrzanowski and A. Wieckowski, Langmuir, 1998, 14, 1967 CrossRef CAS.
- K. B. Zhou, X. Wang, X. M. Sun, Q. Peng and Y. D. Li, J. Catal., 2005, 229, 206 CrossRef CAS.
- X. Xie, Y. Li, Z. Q. Liu, M. Haruta and W. Shen, Nature, 2009, 458, 746 CrossRef CAS.
- L. H. Hu, Q. Peng and Y. D. Li, J. Am. Chem. Soc., 2008, 130, 16136 CrossRef CAS.
- C. Z. Wu, P. Yin, X. Zhu, C. Z. O. Yang and Y. Xie, J. Phys. Chem. B, 2006, 110, 17806 CrossRef CAS.
- Z. Pu, M. Cao, J. Yang, K. Huang and C. Hu, Nanotechnology, 2006, 17, 799 CrossRef CAS.
- S. B. Wang, Y. L. Min and S. H. Yu, J. Phys. Chem. C, 2007, 111, 3551 CrossRef CAS.
- K. Woo, H. J. Lee, J. P. Ahn and Y. S. Park, Adv. Mater., 2003, 15, 1761 CrossRef CAS.
- Y. M. Zhao, Y.-H. Li, R. Z. Ma, M. J. Roe, D. G. McCartney and Y. Q. Zhu, Small, 2006, 2, 422 CrossRef CAS.
- X. Hu and J. C. Yu, Adv. Funct. Mater., 2008, 18, 880 CrossRef CAS.
- X. Wen, S. Wang, Y. Ding, Z. Wang and S. Yang, J. Phys. Chem. B, 2005, 109, 215 CrossRef CAS.
- R. Wang, Y. Chen, Y. Fu, H. Zhang and C. Kisielowski, J. Phys. Chem. B, 2005, 109, 12245 CrossRef CAS.
- J. Chen, L. Xu, W. Li and X. Gou, Adv. Mater., 2005, 17, 582 CrossRef CAS.
- Z. Sun, H. Yuan, Z. Liu, B. Han and X. Zhang, Adv. Mater., 2005, 17, 2993 CrossRef CAS.
- C. J. Jia, L. D. Sun, Z. G. Yan, L. P. You, F. Luo, X. D. Han, Y. C. Pang, Z. Zhang and C. H. Yan, Angew. Chem., Int. Ed., 2005, 44, 4328 CrossRef CAS.
- L. S. Zhong, J. S. Hu, H. P. Liang, A. M. Cao, W. G. Song and L. J. Wan, Adv. Mater., 2006, 18, 2426 CrossRef CAS.
- X. Hu, J. C. Yu, J. Gong, Q. Li and G. Li, Adv. Mater., 2007, 19, 2324 CrossRef CAS.
- M. Cao, T. Liu, S. Gao, G. Sun, X. Wu, C. Hu and Z. L. Wang, Angew. Chem., Int. Ed., 2005, 44, 4197 CrossRef CAS.
- S. Kwon, M. Fan and T. D. Wheelock, Environ. Eng. Sci., 2007, 24, 1065 CrossRef CAS.
- X. Liu, J. Liu, Z. Chang, X. Sun and Y. Li, Catal. Commun., 2011, 12, 530 CrossRef CAS.
- K. S. W. Sing, D. H. Everett, R. A. W. Haul, L. Moscou, R. A. Pierotti, J. Rouquerol and T. Siemieniewska, Pure Appl. Chem., 1985, 57, 603 CrossRef CAS.
- F. Rouquerol, J. Rouquerol and K. Sing, Adsorption by Powders and Porous Solids, Academic Press, London, 1999 Search PubMed.
- P. Li, D. E. Miser, S. Rabiei, R. T. Yadav and M. R. Hajaligol, Appl. Catal., B, 2003, 43, 151 CrossRef CAS.
- J. Zhu, J. G. van Ommen, H. J. M. Bouwmeester and L. Lefferts, J. Catal., 2005, 233, 434 CrossRef CAS.
Footnote |
| † Electronic supplementary information (ESI) available: XRD Patterns, N2 adsorption–desorption isotherms. See DOI: 10.1039/c1cy00080b |
| This journal is © The Royal Society of Chemistry 2011 |