Received
28th January 2011
, Accepted 31st March 2011
First published on 28th April 2011
Abstract
A series of Me/TiO2 samples (Me = V, Cr, Mn, Fe, Co, Ni, Cu and Zn) with designed Me![[thin space (1/6-em)]](https://www.rsc.org/images/entities/char_2009.gif) :
:![[thin space (1/6-em)]](https://www.rsc.org/images/entities/char_2009.gif) TiO2 ratio of 1
TiO2 ratio of 1![[thin space (1/6-em)]](https://www.rsc.org/images/entities/char_2009.gif) :
:![[thin space (1/6-em)]](https://www.rsc.org/images/entities/char_2009.gif) 10 were prepared by a photodeposition method and studied for the oxidation of CO. The Cu/TiO2 catalyst exhibited remarkably high activity and an overall CO oxidation could be achieved at <100 °C. The effects of activation temperatures, GHSV and initial CO concentration on CO oxidation over Cu/TiO2 were further investigated. XRD, TEM, XPS-AES, H2-TPR and FTIR of CO adsorption were employed to characterize Cu/TiO2 samples and the exact composition of Cu/TiO2 prepared by photo-deposition was determined to be Cu–Cu2O/TiO2. Based on the catalytic and characterization results, the possible mechanism for CO oxidation over Cu–Cu2O/TiO2 was discussed. Finally, the durability and deactivation of Cu–Cu2O/TiO2 during CO oxidation was investigated in time-on-stream reaction.
10 were prepared by a photodeposition method and studied for the oxidation of CO. The Cu/TiO2 catalyst exhibited remarkably high activity and an overall CO oxidation could be achieved at <100 °C. The effects of activation temperatures, GHSV and initial CO concentration on CO oxidation over Cu/TiO2 were further investigated. XRD, TEM, XPS-AES, H2-TPR and FTIR of CO adsorption were employed to characterize Cu/TiO2 samples and the exact composition of Cu/TiO2 prepared by photo-deposition was determined to be Cu–Cu2O/TiO2. Based on the catalytic and characterization results, the possible mechanism for CO oxidation over Cu–Cu2O/TiO2 was discussed. Finally, the durability and deactivation of Cu–Cu2O/TiO2 during CO oxidation was investigated in time-on-stream reaction.
Introduction
The catalytic oxidation of carbon monoxide to carbon dioxide is one of the most studied reactions in environmental catalysis due to its great significance not only in fundamental heterogeneous catalysis but also in industrial application. In the research of catalysts for CO oxidation, precious metals, e.g. Au1–3 and Pd,4,5 have been found to be highly active even at very low temperatures and thus receive much attention. The catalyst preparation, catalytic studies and mechanism aspects of CO oxidation on precious metals have been investigated in details. Although precious metal catalysts show remarkable activity for CO oxidation, the high cost of precious metal materials restricts the application of these catalysts to a great extent. To address this concern, transition metal catalysts are being investigated as less expensive candidates for CO oxidation. Cobalt catalysts have been found to be highly active for CO oxidation and their activities are almost comparable with precious metal catalysts.6–10 However, cobalt catalysts are easily deactivated during the reaction, probably originated from the surface reconstruction process.6,7 Especially, cobalt catalysts are extremely sensitive to the presence of water, which leads to serious deactivation by blocking the reactive sites.10
During past decades, copper catalysts (Cu–Cu2O–CuO system) have been extensively studied as eligible catalysts for a number of heterogeneous reactions, e.g.water–gas shift reaction and NOx elimination. Researches on CO oxidation over copper catalysts have also been carried out in the early studies where the kinetics and mechanism aspects are focused.11–13 Recently, the oxidation of CO over copper catalysts is re-visited due to the persistent interest in this reaction and more important, the outstanding CO oxidation activity of copper catalysts just revealed.14–19 White et al. developed a catalyst system comprised of Cu2O nanoparticles supported on silica gel that exhibited exceptional activity toward CO oxidation.14 Theoretical calculations suggested that lattice oxygen play a critical role in the CO oxidation process, verifying the Langmuir–Hinshelwood mechanism. Chen et al. demonstrated that Cu/TiO2 prepared by wet impregnation was highly active for CO oxidation and they proposed that isolated Cu2+ was the main factor determining the activity.15 Wan et al. found CO pretreatment to be a feasible means to promote the activity of Cu/Al2O3 for CO oxidation and an overall CO oxidation could be obtained at ca. 200 °C on the best catalyst.16 They further proposed that the dispersed Cu+ originated from the reduction of dispersed Cu2+ played a significant role in low temperature CO oxidation. In the work of Cao et al., mesoporous copper catalysts, CuO–Fe2O317 and CuO–Ce0.8Zr0.2O2,18 were prepared by surfactant-assisted nanoparticles assembly. The mesoporous copper catalysts exhibited extremely high activity and total oxidation of CO could be achieved at ca. 100 °C.
Even though copper catalysts have been recognized as promising candidates for low temperature CO oxidation, the catalytic activities reported on copper catalysts are somewhat contradictory. Many aspects on the complex Cu–Cu2O–CuO system are to be studied and first of all, it is quite desired to analysis the key factor controlling the activity of copper catalysts. In this work, we will present a comprehensive study on CO oxidation over Cu/TiO2 prepared by photodeposition and wet impregnation. The as-prepared Cu/TiO2 samples are characterized by a series of techniques and the composition and oxidation states of copper are well defined. Based on the characterization and catalytic results, the CO oxidation mechanism over Cu/TiO2 prepared by photodeposition is carefully discussed.
Experimental
Preparation of Me/TiO2 catalyst
Commercial TiO2 (Degussa P25, 70% anatase, 30% rutile) was used as support and Me/TiO2 (Me = V, Cr, Mn, Fe, Co, Ni, Cu and Zn) catalysts with Me![[thin space (1/6-em)]](https://www.rsc.org/images/entities/char_2009.gif) :
:![[thin space (1/6-em)]](https://www.rsc.org/images/entities/char_2009.gif) TiO2 ratio of 1
TiO2 ratio of 1![[thin space (1/6-em)]](https://www.rsc.org/images/entities/char_2009.gif) :
:![[thin space (1/6-em)]](https://www.rsc.org/images/entities/char_2009.gif) 10 were prepared by so-called photodeposition method.20,21 In a typical synthesis of Cu/TiO2, 100 mL 2 mM Cu(NO3)2 solution, 160 mg of TiO2 and 10 mL of ethanol were added into a round-bottom quartz flask under vigorous stirring to form slurry. The slurry was adjusted to pH = 9.5 ± 0.5 using either 1 M HCl or 1 M NaOH aqueous solution and irradiated by a high-pressure mercury light with the main wavelength of 365 nm for 6 h under the protection of pure nitrogen. Finally, the particles were filtered, dried at ambient conditions and denoted as Cu/TiO2-ph. The exact Cu loading in Cu/TiO2-ph is 7.05%, as determined by ICP analysis.
10 were prepared by so-called photodeposition method.20,21 In a typical synthesis of Cu/TiO2, 100 mL 2 mM Cu(NO3)2 solution, 160 mg of TiO2 and 10 mL of ethanol were added into a round-bottom quartz flask under vigorous stirring to form slurry. The slurry was adjusted to pH = 9.5 ± 0.5 using either 1 M HCl or 1 M NaOH aqueous solution and irradiated by a high-pressure mercury light with the main wavelength of 365 nm for 6 h under the protection of pure nitrogen. Finally, the particles were filtered, dried at ambient conditions and denoted as Cu/TiO2-ph. The exact Cu loading in Cu/TiO2-ph is 7.05%, as determined by ICP analysis.
For reference, Cu/TiO2 with Cu![[thin space (1/6-em)]](https://www.rsc.org/images/entities/char_2009.gif) :
:![[thin space (1/6-em)]](https://www.rsc.org/images/entities/char_2009.gif) TiO2 ratio of 1
TiO2 ratio of 1![[thin space (1/6-em)]](https://www.rsc.org/images/entities/char_2009.gif) :
:![[thin space (1/6-em)]](https://www.rsc.org/images/entities/char_2009.gif) 10 was also prepared by wet impregnation and the obtained sample was denoted as Cu/TiO2-im (Cu loading: 7.21%).
10 was also prepared by wet impregnation and the obtained sample was denoted as Cu/TiO2-im (Cu loading: 7.21%).
Catalyst characterization
The X-ray diffraction patterns of samples were recorded on a Rigaku powder diffractometer (D/MAX-RB) using Cu-Kα radiation (λ = 0.15418 nm) at a scanning rate of 4° min−1 in 2θ = 10–80°.
X-Ray photoelectron and Auger electronic spectra were recorded on a Quantum-ESCA spectrometer with a pass energy of 20 eV and monochromated Mg-Kα X-ray source. Accurate binding energies (±0.1 eV) were determined with respect to the position of the adventitious C 1s peak at 284.6 eV.
Transmission electron microscopy (TEM) images of samples were acquired on a Tecnai G2 2010 S-TWIN transmission electron microscope at an accelerate voltage of 200 kV.
The temperature-programmed reduction experiments of samples were carried out on a chemisorption analyzer (Chemisorb 2720, Micromeritics) with 5 vol% H2/Ar at a heating rate of 10 °C min−1 from room temperature to 500 °C. Prior to reduction, the sample (100 mg) was pretreated in He at 400 °C for 1 h.
FTIR spectra of CO adsorption on Cu/TiO2 catalysts were collected on the spectrometer (Bruker Tensor 27) with 128 scans at a resolution of 4 cm−1. A self-supporting pellet (ca. 0.05 g) made of sample was placed in the IR flow cell and the reference spectrum (i.e. background spectrum) was taken at room temperature. After the He stream was switched to a gas mixture containing 1% CO in He at a total flow rate of 30 mL min−1, a series of time-dependent FTIR spectra of CO adsorption on the samples were sequentially recorded.
Catalytic
oxidation of carbon monoxide
The catalytic oxidation of CO was performed in a fixed-bed flow microreactor at atmospheric pressure. Typically, 0.2 g sample (sieve fraction of 0.16–0.25 mm) was placed in a quartz reactor (4 mm i.d.) and activated in reactant gas mixture (5000 ppm CO in air) at desired temperature for 1 h. After cooling to room temperature in air, the reactant gas mixture (5000 ppm CO in air) was fed to the reactor. The total flow rate of the gas mixture was kept at 80 mL min−1, corresponding to a GHSV of 24![[thin space (1/6-em)]](https://www.rsc.org/images/entities/char_2009.gif) 000 h−1. The inlet and outlet gases were monitored on-line using a gas chromatograph (HP 6820 series) equipped with molecular sieve 5A and Porapak Q columns. The CO conversion was calculated both from the consumption of CO and the production of CO2 in the outlet.
000 h−1. The inlet and outlet gases were monitored on-line using a gas chromatograph (HP 6820 series) equipped with molecular sieve 5A and Porapak Q columns. The CO conversion was calculated both from the consumption of CO and the production of CO2 in the outlet.
For kinetics study, 0.05–0.15 g sample (sieve fraction of 0.16–0.25 mm, small enough to exclude mass transfer limitations) was employed and the total flow rate of the gas mixture (5000 ppm CO, air balance) was fixed at 80 mL min−1. The reactor was well approximated as an isothermal plug-flow reactor and the CO conversion was restricted to below 15% to ensure that the data obtained were differentiated. The kinetic data were acquired after 60 min of steady-state reaction and the first data point was well duplicated after each kinetic run.
In situ
FTIR studies were performed using a Bruker Tensor 27spectrometer with 256 scans at a resolution of 4 cm−1. All samples were used as self-supporting wafers (ca. 0.05 g) and pretreated in He at 400 °C for 1h prior to experiments. After cooling to desired temperature in flowing air, the samples were exposed to reactant mixture (5000 ppm CO in air) at a constant temperature. After holding this temperature for 30 min, it was stepwise increased to the next designed temperature. The FTIR spectra were recorded every 20 °C (from 20 to 160 °C) after 30 min of steady state reaction.
Results and discussion
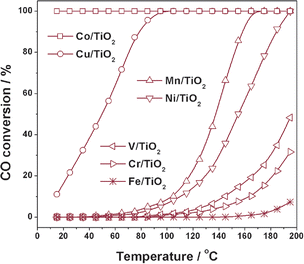
Fig. 1 shows the CO oxidation activities over a series of TiO2 supported catalysts prepared by photodeposition and the activity order is observed as Co/TiO2 > Cu/TiO2 > Mn/TiO2 > Ni/TiO2 > V/TiO2 > Cr/TiO2 > Fe/TiO2 (all catalysts activated at 400 °C). Co/TiO2 exhibits the best activity and 100% CO conversion could be obtained at temperatures below 15 °C. However, the activity drops gradually with reaction time, indicating the quick deactivation of Co/TiO2 catalyst (not shown here). For Cu/TiO2, a 50% CO conversion is obtained at 50 °C and a 100% CO conversion is obtained at 95 °C. The activity of Cu/TiO2 is remarkable high when compared to other Cu catalysts under similar reaction conditions.15–19Mn/TiO2 and Ni/TiO2 catalysts also exhibit high activity and overall CO oxidation could be obtained at below 200 °C. To our knowledge, Ni and Mn are not popular active components during the past researches on CO oxidation and it is the first time to report highly active Mn/TiO2 and Ni/TiO2 catalysts. From Fig. 1, it is seen that quite good CO oxidation activities can be achieved on some TiO2 supported catalysts prepared by photodeposition. The great success of these catalysts may be ascribed to the advanced preparation method and the proper activation process. Since Cu/TiO2 appears to be very promising catalyst for CO oxidation, a detailed study on Cu/TiO2 will be presented in the following sections.
 |
| | Fig. 1
Catalytic activities for CO oxidation on TiO2 supported catalysts prepared by photo-deposition. Reaction conditions: 0.2 g catalyst, 5000 ppm CO, air balance, GHSV = 24![[thin space (1/6-em)]](https://www.rsc.org/images/entities/char_2009.gif) 000 h−1. 000 h−1. | |
 |
| | Fig. 2
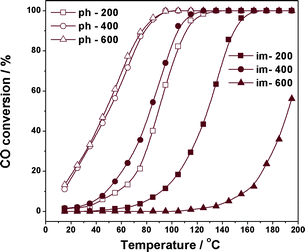
Catalytic activities for CO oxidation on Cu/TiO2 prepared by photodeposition or impregnation, and activated at different temperatures. Reaction conditions: 0.2 g catalyst, 5000 ppm CO, air balance, GHSV = 24![[thin space (1/6-em)]](https://www.rsc.org/images/entities/char_2009.gif) 000 h−1. 000 h−1. | |
The effects of activation temperature on CO oxidation over Cu/TiO2 catalysts can be ascribed to the change in the states of active copper species during activation process, similar to those reported for cobalt-based catalysts.22,23 From Fig. 2, it is also seen that Cu/TiO2 catalyst prepared by photodeposition exhibits much better CO oxidation activity than that prepared by wet impregnation activated at the same temperature. The good activity and stability of Cu/TiO2 prepared by photodeposition demonstrates its great potential for future application.
Effect of reaction conditions on CO oxidation over Cu/TiO2
The effects of GHSV and initial CO concentration on CO oxidation activity over Cu/TiO2 prepared by photo-deposition are shown in Fig. 3. The CO conversion drops gradually with increasing GHSV from 12![[thin space (1/6-em)]](https://www.rsc.org/images/entities/char_2009.gif) 000 h−1 to 48
000 h−1 to 48![[thin space (1/6-em)]](https://www.rsc.org/images/entities/char_2009.gif) 000 h−1. Nevertheless, an overall CO oxidation to CO2 is obtained at below 150 °C even at the highest GHSV of 48
000 h−1. Nevertheless, an overall CO oxidation to CO2 is obtained at below 150 °C even at the highest GHSV of 48![[thin space (1/6-em)]](https://www.rsc.org/images/entities/char_2009.gif) 000 h−1. Under fixed GHSV of 24
000 h−1. Under fixed GHSV of 24![[thin space (1/6-em)]](https://www.rsc.org/images/entities/char_2009.gif) 000 h−1, a slight decrease in CO conversion is observed on Cu/TiO2 catalyst with initial CO concentration increasing from 1000 ppm to 5000 ppm, and a more serious decrease in CO conversion is observed with CO concentration further increasing to 10
000 h−1, a slight decrease in CO conversion is observed on Cu/TiO2 catalyst with initial CO concentration increasing from 1000 ppm to 5000 ppm, and a more serious decrease in CO conversion is observed with CO concentration further increasing to 10![[thin space (1/6-em)]](https://www.rsc.org/images/entities/char_2009.gif) 000 ppm.
000 ppm.
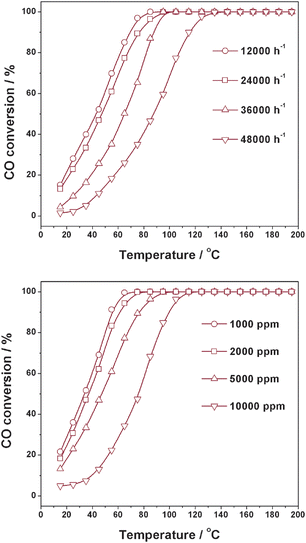 |
| | Fig. 3 Effects of GHSV and initial CO concentration on CO oxidation activity over Cu/TiO2 catalyst. | |
Kinetic for CO oxidation over Cu/TiO2
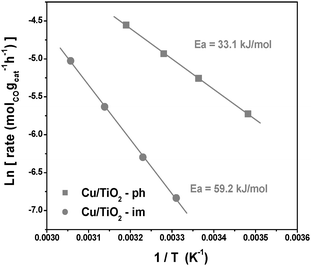
The Arrhenius plots of CO oxidation on different Cu/TiO2 catalysts are shown in Fig. 4. The apparent activation energy for CO oxidation on Cu/TiO2 prepared by photodeposition is as low as 35.5 kJ mol−1, while the apparent activation energy on Cu/TiO2 prepared by wet impregnation is 59.2 kJ mol−1. Notablely, the pre-exponential A on Cu/TiO2-ph (7.64 × 10³ s−1) is much lower than that on Cu/TiO2-im (1.87 × 10⁷ s−1), indicating the effective active sites on Cu/TiO2-ph are much less than that on Cu/TiO2-im. The CO oxidation reaction rate on Cu/TiO2 is governed by apparent activation energy. The formation of different copper species on TiO2 support is proposed to be responsible for the kinetics difference of Cu/TiO2 prepared by different methods.
Characterization of Cu/TiO2 catalysts
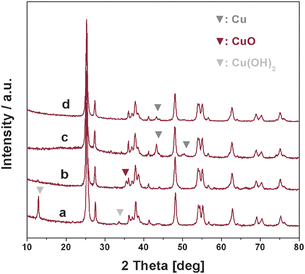
The XRD patterns of different Cu/TiO2 samples are shown in Fig. 5. Typical diffraction peaks of TiO2 support corresponding to anatase (JCPDS 21-1272) and rutile (JCPDS 21-1276) phase are observed in all Cu/TiO2 samples. Besides, diffraction peaks at 13.1° and 33.6° corresponding to Cu(OH)2 (JCPDS 42-0746) can be found in as-prepared Cu/TiO2-im. Through activation at 400 °C, the Cu(OH)2 transforms to CuO (JCPDS 41-0254), as illustrated by the diffraction peak at 35.5°. Based on the above observation, it is deduced that copper species adsorb on TiO2 support in the form of Cu(OH)2 during wet impregnation and then transform to CuO during activation process. For Cu/TiO2 by photo-deposition, diffraction peaks at 43.2° and 50.3° corresponding to metallic Cu (JCPDF 04-0836), are observed in the as-prepared sample. Through activation, the intensities of diffraction peaks corresponding to metallic Cu decrease, while no new diffraction peaks appear. It is easily seen that some of metallic Cu has transformed to other copper species, probably Cu2O and/or CuO, during activation. However, the main diffraction peak of Cu2O (JCPDF 65-3288), e.g. the peak at 36.2°, cannot be distinguished due to overlapped by the diffraction peaks of TiO2 support.
 |
| | Fig. 5
XRD patterns of different Cu/TiO2 samples. (a) as-prepared Cu/TiO2-im, (b) Cu/TiO2-im activated at 400 °C for 1 h, (c) as-prepared Cu/TiO2-ph and (d) Cu/TiO2-ph activated at 400 °C for 1 h. | |
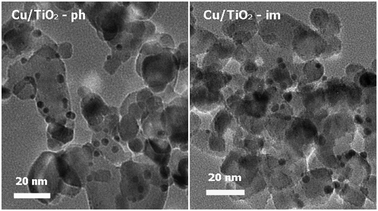
The TEM images of Cu/TiO2 prepared by wet impregnation and by photo-deposition are shown in Fig. 6. It is seen that similar spherical clusters with diameters of 3–6 nm are observed to disperse on the TiO2 support. So, the cluster size, distribution and morphology of copper species should not be the key factors controlling the catalytic activity.
 |
| | Fig. 6
TEM images of Cu/TiO2 prepared by different methods and activated at 400 °C for 1 h. | |
Fig. 7 shows the X-ray photoelectron and Auger electronic spectra of Cu/TiO2 prepared by wet impregnation and photodeposition. For Cu/TiO2-ph, the binding energy of 932.5 and 952.3 eV is observed in Cu 2p region, associated with the Cu0 and/or CuI2O.24 Meanwhile, the kinetic energy of 913 eV associated with CuI2O and/or CuIIO,25 together with kinetic energy of 914.5 eV associated with Cu0, is observed. Based on the results from both X-ray photoelectron and Auger electronic spectra, the Cu species in Cu/TiO2-ph should exist in the form of CuI2O and Cu0. For Cu/TiO2-im, the binding energy of 932.5, 934.4, 952.3 and 954.0 eV is observed in the Cu 2p region. The binding energy of 934.4 and 954.0 eV is associated with CuIIO, while binding energy of 932.5 eV and 952.3 eV is associated with the Cu0 and/or CuI2O. The absence of kinetic energy of 914.5 eV in Auger electronic spectra excludes the existence of Cu0, so the Cu species in Cu/TiO2-im should exist in the form of CuI2O and CuIIO. Based on the areas of deconvoluted Cu 2p3/2 XPS peak, ca. 60% of copper species are in the form of CuI2O and ca. 40% copper species are in the form of CuIIO.
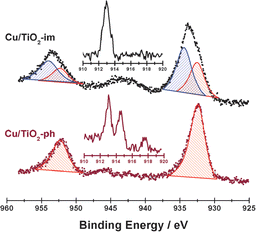 |
| | Fig. 7 X-Ray photoelectron and Auger electronic spectra (inset) of Cu/TiO2 prepared by different methods and activated at 400 °C for 1 h. | |
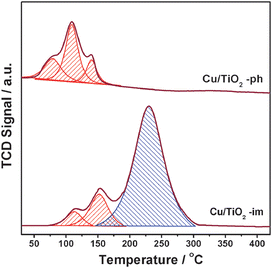
The different Cu species on TiO2 are further investigated by means of temperature-programmed reduction and the H2-TPR profiles of Cu/TiO2 are shown in Fig. 8. Since the TiO2 support is almost irreducible at below 400 °C, the reduction peaks in this temperature range correspond to the reduction of different types of copper oxides. For Cu/TiO2-ph, three reduction peaks centered at 80, 110 and 140 °C can be observed, corresponding to the reduction of various Cu2O on TiO2.16 While for Cu/TiO2-im two peaks at 110 and 150 °C corresponding to the reduction of Cu2O are observed. Besides, a reduction peak at centered at 240 °C is observed and assigned to the reduction of crystalline CuO.18 For a quantitative analysis, the H2 consumption of each reduction peak and corresponding quantity of copper oxides are carefully calculated. For Cu/TiO2-im, Cu(I) is 395.8 μmol g−1 and Cu(II) is 741.5 μmol g−1, as displayed in Table 1. Based on the total copper loading of 1126.5 μmol g−1, we determine that copper species exist in the form of oxides, 35% Cu2O and 65% CuO. It should be mentioned that a slightly higher proportion of Cu2O is obtained from XPS analysis (40%) than that from TPR analysis (35%). As is known, XPS is surface analysis technique with detection depth of several nanometres, while TPR is bulk analysis technique. The different quantitative results from XPS and TPR analysis therefore indicate the slight enrichment of Cu2O species in Cu/TiO2-im, which is formed during activation process. While for Cu/TiO2-ph, part of copper exists in the form of Cu(I) (733.8 μmol g−1, ca. 65%) and the rest of copper (ca. 35%) should exist in the form of Cu0.
 |
| | Fig. 8
H2-TPR profiles of Cu/TiO2 prepared by different methods and activated at 400 °C for 1 h. | |
Table 1 H2 consumption during TPR of Cu/TiO2 catalysts
|
Catalyst
|
Reduction peaks |
|
T/°C |
H2/μmol g−1 |
T/°C |
H2/μmol g−1 |
T/°C |
H2/μmol g−1 |
Cu(I)/μmol g−1 |
Cu(II)/μmol g−1 |
Suma/μmol g−1 |
Cu0b/μmol g−1 |
|
Analyzed by ICP.
Cu0 = Sum–Cu(I)–Cu(II).
|
|
Cu/TiO2-ph |
80 |
105.5 |
110 |
183.9 |
140 |
77.5 |
733.8 |
— |
1101.5 |
367.7 |
|
Cu/TiO2-im |
110 |
69.6 |
150 |
128.3 |
240 |
741.5 |
395.8 |
741.5 |
1126.5 |
— |
Transformation of copper species on TiO2
Based on above characterization results, the transformation of copper species in Cu/TiO2 prepared by different methods is proposed. For Cu/TiO2-im, copper species adsorb on the surface of TiO2 support in the form of Cu(OH)2 after wet impregnation. During activation at 400 °C, the decomposition of Cu(OH)2 to CuO takes places and some of CuO species are reduced to Cu2O species due to the existence of CO in the reactant gas mixture. As a result, Cu2O–CuO/TiO2 is the final product we obtained after activation. While for the preparation of Cu/TiO2 by photodeposition, a much more complicated process is involved as follows:
| TiO2 + hv → TiO2 + e− + p+ |
First, the copper cations in aqueous solution adsorb on the surface of TiO2. Under the ultraviolet irradiation (hv ≥ Eg = 3.02 eV), electron-hole pairs are also created on the surface of TiO2. The adsorbed copper cations are subsequently reduced to copper atoms by the photo-induced electrons (E0Cu2+/Cu = −1.25 eV) and then agglomerate to form copper nano-clusters on TiO2. During activation, parts of metallic Cu species are oxidized to Cu2O (ca. 35%) in oxidizing conditions, while the rests are preserved in the metallic form. On the whole, Cu–Cu2O/TiO2 is obtained as the final product after activation.
CO adsorption on Cu/TiO2 at room temperature
Fig. 9 presents the time-resolved FTIR spectra of CO adsorption on Cu/TiO2 at room temperature. In the normal carbonyls region, a strong band at 2105 cm−1 and a weak band at 2060 cm−1 are observed on Cu/TiO2 prepared by impregnation, which significantly increase in intensity with adsorption time. The band at 2105 cm−1 is attributed to the mono-carbonyl group on Cu+ while that at 2060 cm−1 is attributed to mono-carbonyl on metallic Cu.26–28 Besides, some other bands at 1650, 1560, 1535, 1360 and 1305 cm−1 are observed and their intensities also increase with the adsorption time. These bands are attributed to the products of reactive CO adsorption, e.g.carbonates, bicarbonates, carboxylates or formates.29,30 The FTIR spectra of CO adsorption on Cu/TiO2-im indicate that CO predominantly adsorbs on Cu2+ cationic center, accompanied by the reduction of Cu2+ to Cu+ and Cu0 (E0Cu2+/Cu+ = 0.153 eV; E0Cu2+/Cu = −1.25 eV). Since carbonyls of Cu2+ are not detectable at room temperature, the IR bands we observed are carbonyls of Cu+ and Cu0 together with products of reactive CO adsorption.
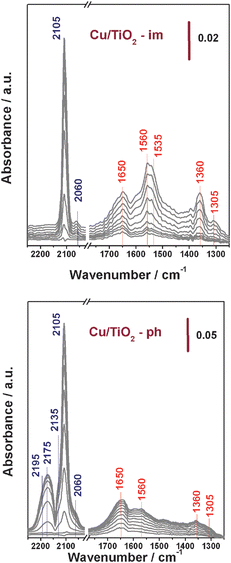 |
| | Fig. 9 Time-resolved FTIR spectra of CO adsorption on Cu/TiO2 prepared by different methods at room temperature. | |
In the case of Cu/TiO2-ph, CO adsorption proceeds in some other way. As seen in Fig. 9, a strong band at 2105 cm−1 corresponding to Cu+–CO and a weak band 2060 cm−1 corresponding to Cu0–CO are observed, similar to the results on Cu/TiO2-im. Besides, bands at 2135, 2175 and 2195 cm−1 corresponding to polycarbonyls of Cu+, e.g.Cu+(CO)2 and Cu+(CO)3,30 can be clearly observed in the carbonyls region. Because Cu+ cannot be reduced to Cu0 at room temperature with high E0Cu+/Cu of −2.53 eV, the Cu0–CO should be originated from CO adsorption on already-existed Cu0 on TiO2. In contrast, the band corresponding to Cu0–CO observed on Cu/TiO2-im is originated from CO adsorption on newly-formed Cu0 reduced from Cu2+. The Cu+–CO observed on Cu/TiO2-ph is originated from CO adsorption on already-existed Cu+ and hence polycarbonyls of Cu+ are observed on Cu/TiO2-ph. Based on the above observations, it is indicated that both Cu+ and Cu0 in Cu/TiO2 prepared by photo-deposition are accessible and CO molecular adsorb as carbonyls on both Cu+ and Cu0, followed by the oxidation of carbonyls.
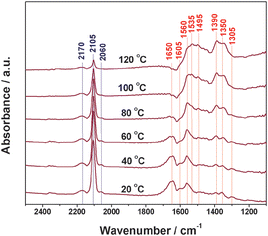
The results of IR bands observed on Cu/TiO2 prepared by photo-deposition, i.e.Cu–Cu2O/TiO2, under steady-state CO–O2 reaction conditions are shown in Fig. 10. At 20 °C, a strong band at 2105 cm−1 corresponding to Cu+–CO and a weak band 2060 cm−1 corresponding to Cu0–CO together with broad bands centered at 2170 cm−1 corresponding to Cu+–(CO)x are observed in the carbonyls region. Meanwhile, a series of bands in the region of below 1700 cm−1 are observed. Briefly, band at 1650 cm−1 is assigned to bidentate carbonates,31 while the bands at 1495 and 1305 cm−1 are assigned to monodentate carbonates.29 The bands at 1560 and 1350 cm−1 are assigned to formates,32 formed through the interaction between CO and surface hydroxyls. The bands at 1535 and 1390 cm−1 is assigned to carboxylates,29 while the band at 1605 cm−1 is assigned to bi-carbonates.33 It is seen that CO predominantly adsorbs on the Cu+ site in Cu–Cu2O/TiO2 and the formed carbonyls can be oxidized even at room temperature. With increasing temperature from 20 °C to 120 °C, the intensity of IR bands associated with carbonyls decreases gradually. Considering that the carbonyls on Cu+ are quite stable at below 200 °C,30 the decrease in the intensity of IR bands is mainly attributed to the consumption of carbonyls. Meanwhile, the intensity of IR band corresponding to bidentate carbonates also decreases with increasing temperatures. However, in contrast, the intensity of IR bands associated with formates and carboxylates increases gradually, indicating the accumulation of these species. Based on the above observations, we propose that the carbonyls on Cu+ are initially oxidized to bidentate carbonates, which finally transform to CO2.
CO
oxidation mechanism on Cu–Cu2O/TiO2
By means of a series of different characterization techniques, the exact composition of Cu/TiO2 prepared by photo-deposition is well defined as Cu–Cu2O/TiO2. In the early work of Jernigan and Somorjai,12 quite different activation energy for CO oxidation was observed over copper catalysts with different oxidation states (Cu: 37.1 kJ mol−1; Cu2O: 58.8 kJ mol−1; CuO: 71.4 kJ mol−1). In this work, the apparent activation energy for CO oxidation on Cu–Cu2O/TiO2 is determined to be 33.1 kJ mol−1 and therefore, Cu2O should not be the actual active sites for reaction. For more precise information, the detailed CO oxidation pathway is described as follows.
First, the CO–O2 reaction over copper catalyst is of Langmuir-Hinshelwood type where adsorbed CO reacts with adsorbed oxygen and the following elementary reactions are considered:
The
adsorption of CO and O
2 are fast reaction in equilibrium and the adsorption entropies are dependent on the type of
adsorption sites. For CO, the adsorption entropy is much greater on Cu
2O than that on metallic copper
34 and as a consequence CO prefers to adsorb on the Cu
+ cation site with σ bonding and π back-bonding synergistic effect. This is also proved by the FTIR results (
Fig. 10) where Cu
+–CO is observed as key reaction intermediate. However, the kinetic results indicate that Cu
2O should not be the active sites for CO
oxidation. Since both metallic Cu and Cu
2O are accessible in Cu–Cu
2O/TiO
2, we propose that CO
oxidation proceeds through the cooperation of Cu
2O and Cu. The apparent
activation energy
EApp for CO
oxidation can be obtained as
EApp =
ELH +
Edis +
Ediff −
ECO −
EO2. Herein,
ELH is the barrier for Langmuir-Hinshelwood reaction and
Edis is the barrier for oxygen dissociation.
ECO and
EO2 are the adsorption energy of CO and O
2, respectively.
Ediff is the energy barrier for adsorbed CO diffusing from Cu
2O to Cu or adsorbed O diffusing from Cu to CuO
2. It should be mentioned that
Ediff might be varied in a large range, determined by the diffusion pathway and surface coverage. If the Langmuir–Hinshelwood reaction occurs at the borders between Cu
2O and metallic copper, the
Ediff may be very small, or even can be neglected. Thus, the formula is approximately simplified as
EApp =
ELH +
Edis −
ECO −
EO2. The cooperation between Cu
2O and metallic Cu contributes to the low apparent
activation energy of 33.1 kJ mol
−1 for CO
oxidation. Meanwhile, since very limited borders between Cu
2O and Cu is available in Cu–Cu
2O/TiO
2, very low pre-exponential A of 7.64 × 10
3s
−1 is obtained on Cu–Cu
2O/TiO
2.
Durability of Cu–Cu2O/TiO2 for CO oxidation
The durability of Cu–Cu2O/TiO2 catalyst under different reaction conditions is further studied. No deactivation can be observed on Cu–Cu2O/TiO2 after 200 h reaction at 100 °C in the absence of H2O (not shown in the figure), suggesting the good stability of catalyst under dry conditions. However in contrast, the presence of 2% H2O in the reaction stream results in an obvious decrease in the CO conversion from 100% to 76%, as seen in Fig. 11. After turning off the H2O supply, the CO conversion on Cu–Cu2O/TiO2 gradually recovers to 100%. Turning on the H2O supply again results in more serious deactivation of catalyst and the CO conversion cannot recover to the initial level (100%) after turning off the H2O supply. Based on these observations, two types of catalyst deactivation by H2O are proposed. One type of deactivation is due to the competitive adsorption of H2O on the active sites, which inhibits the adsorption of CO and O2. Generally, this type of deactivation is impermanent and easily recovered. The other type of deactivation is caused by the H2O-promoted oxidation of Cu or Cu2O. Obviously, this type of deactivation is permanent and irreversible.
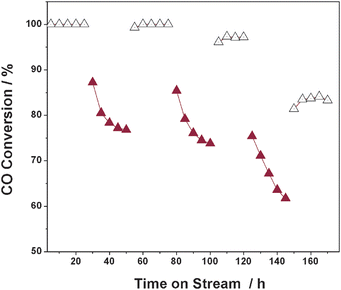 |
| | Fig. 11 Time-on-stream behaviour of Cu–Cu2O/TiO2 catalyst for CO oxidation at 100 °C. Reaction conditions: 0.2 g catalyst, 5000 ppm CO, 0 (hollow symbol) or 2% (filled symbol) H2O, balance air, GHSV = 24![[thin space (1/6-em)]](https://www.rsc.org/images/entities/char_2009.gif) 000 h−1. 000 h−1. | |
Conclusions
The catalytic oxidation of CO over a series of Me/TiO2 catalysts (Me![[thin space (1/6-em)]](https://www.rsc.org/images/entities/char_2009.gif) :
:![[thin space (1/6-em)]](https://www.rsc.org/images/entities/char_2009.gif) TiO2 = 1
TiO2 = 1![[thin space (1/6-em)]](https://www.rsc.org/images/entities/char_2009.gif) :
:![[thin space (1/6-em)]](https://www.rsc.org/images/entities/char_2009.gif) 10) prepared by photodeposition was investigated. Cu/TiO2 exhibited remarkably high activity with low apparent activation energy of 33.1 kJ mol−1 and a detailed study was carried out on Cu/TiO2 catalyst. The exact composition of Cu/TiO2 prepared by photo-deposition was determined to be Cu–Cu2O/TiO2, based on the characterization results from XRD, XPS-AES, H2-TPR and FTIR of CO adsorption. The CO oxidation over Cu–Cu2O/TiO2 was investigated by in situFTIR spectra and carbonyls on Cu+ were observed as key intermediates. The mechanism for CO oxidation over Cu–Cu2O/TiO2 was further discussed and the step of Langmuir-Hinshelwood reaction (CO* + O* → CO2 + 2*) was proposed to occur through the cooperation between Cu2O and metallic copper. Time-on-stream behaviour of Cu–Cu2O/TiO2 for CO oxidation indicated no deactivation at 100 °C for over 200 h in the absence of H2O. While in the presence of 2% H2O, two types of deactivation was observed, which was then attributed to the competitive adsorption of H2O on the active sites and H2O-promoted oxidation of Cu or Cu2O.
10) prepared by photodeposition was investigated. Cu/TiO2 exhibited remarkably high activity with low apparent activation energy of 33.1 kJ mol−1 and a detailed study was carried out on Cu/TiO2 catalyst. The exact composition of Cu/TiO2 prepared by photo-deposition was determined to be Cu–Cu2O/TiO2, based on the characterization results from XRD, XPS-AES, H2-TPR and FTIR of CO adsorption. The CO oxidation over Cu–Cu2O/TiO2 was investigated by in situFTIR spectra and carbonyls on Cu+ were observed as key intermediates. The mechanism for CO oxidation over Cu–Cu2O/TiO2 was further discussed and the step of Langmuir-Hinshelwood reaction (CO* + O* → CO2 + 2*) was proposed to occur through the cooperation between Cu2O and metallic copper. Time-on-stream behaviour of Cu–Cu2O/TiO2 for CO oxidation indicated no deactivation at 100 °C for over 200 h in the absence of H2O. While in the presence of 2% H2O, two types of deactivation was observed, which was then attributed to the competitive adsorption of H2O on the active sites and H2O-promoted oxidation of Cu or Cu2O.
Acknowledgements
This work is financially supported by the National Basic Research Program of China (2009CB623502) and MOE (IRT0927). L. L. thanks the support from the State Key Laboratory of Catalytic Materials and Reaction Engineering (RIPP, SINOPEC).
References
- M. Haruta, S. Tsubota, T. Kobayashi, H. Kageyama, M. J. Genet and B. Delmon, J. Catal., 1993, 144, 175 CrossRef CAS.
- G. C. Bond and D. T. Thompson, Gold Bullet., 2000, 33, 41 Search PubMed.
- M. Comotti, W. C. Li, B. Spliethoff and F. Schüth, J. Am. Chem. Soc., 2006, 128, 917 CrossRef CAS.
- T. Schalow, B. Brandt, M. Laurin, S. Schauermann, J. Libuda and H. J. Freund, J. Catal., 2006, 242, 58 CrossRef CAS.
- B. T. Qiao, L. Q. Liu, J. Zhang and Y. Q. Deng, J. Catal., 2009, 261, 241 CrossRef CAS.
- J. Jansson, M. Skoglundh, E. Fridell and P. Thormählen, Top. Catal., 2001, 16/17, 385 CrossRef.
- J. Jansson, A. E. C. Palmqvist, E. Fridell, M. Skoglundh, L. Osterlund, P. Thormählen and V. Langer, J. Catal., 2002, 211, 387 CrossRef CAS.
- F. Grillo, M. M. Natile and A. Glisenti, Appl. Catal., B, 2004, 48, 267 CrossRef CAS.
- M. M. Yung, E. M. Holmgreen and U. S. Ozkan, Catal. Lett., 2007, 118, 180–186 CrossRef CAS.
- M. J. Pollard, B. A. Weinstock, T. E. Bitterwolf, P. R. Griffiths, A. P. Newbery and J. B. Paine III, J. Catal., 2008, 254, 218 CrossRef CAS.
- K. I. Choi and M. A. Vannice, J. Catal., 1991, 131, 22 CrossRef CAS.
- G. G. Jernigan and G. A. Somorjai, J. Catal., 1994, 147, 567 CrossRef CAS.
- F. H. M. Dekker, M. C. Dekker, A. Bliek, F. Kapteijn and J. A. Moulijn, Catal. Today, 1994, 20, 409 CrossRef CAS.
- B. White, M. Yin, A. Hall, D. Le, S. Stolbov, T. Rahman, N. Turro and S. O'Brien, Nano Lett., 2006, 6, 2095 CrossRef CAS.
- C. S. Chen, J. H. You, J. H Lin and Y. Y. Chen, Catal. Commun., 2008, 9, 2381 CrossRef CAS.
- H. Q. Wan, Z. Wang, J. Zhu, X. W. Li, B. Liu, F. Gao, L. Dong and Y. Chen, Appl. Catal., B, 2008, 79, 254 CrossRef CAS.
- J. L. Cao, Y. Wang, X. L. Yu, S. R. Wang, S. H. Wu and Z. Y. Yuan, Appl. Catal., B, 2008, 79, 26 CrossRef CAS.
- J. L. Cao, Y. Wang, T. Y. Zhang, S. H. Wu and Z. Y. Yuan, Appl. Catal., B, 2008, 78, 120 CrossRef CAS.
- V. A. Sadykov, S. F. Tikhov, N. N. Bulgakov and A. P. Gerasev, Catal. Today, 2009, 144, 324 CrossRef CAS.
- J. M. Herrmann, J. Disdier and P. Pichat, J. Phys. Chem., 1986, 90, 6028 CrossRef CAS.
- L. D. Li, Q. Shen, J. Cheng and Z. P. Hao, Appl. Catal., B, 2010, 93, 259 CrossRef CAS.
- W. H. Yang, M. H. Kim and S. W. Ham, Catal. Today, 2007, 123, 94 CrossRef CAS.
- C. W. Tang, C. C. Kuo, M. C. Kuo, C. B. Wang and S. H. Chien, Appl. Catal., A, 2006, 309, 37 CrossRef CAS.
- H. J. Choi and M. Kang, Int. J. Hydrogen Energy, 2007, 32, 3841 CrossRef CAS.
- S. Y. Lee, N. Mettlach, N. Nguyen, Y. M. Sun and J. M. White, Appl. Surf. Sci., 2003, 206, 102 CrossRef CAS.
- K. Hadjiivanov and H. Knozinger, Phys. Chem. Chem. Phys., 2001, 3, 1132 RSC.
- D. Scarano, S. Bordiga, C. Lamberti, G. Spoto, G. Ricchiardi, A. Zecchina and C. O. Areán, Surf. Sci., 1998, 411, 272 CrossRef CAS.
- F. Boccuzzi, A. Chiorino, G. Martra, M. Gargano, N. Ravasio and B. Carrozzini, J. Catal., 1997, 165, 129 CrossRef CAS.
-
A. Davydov, IR Spectroscopy Applied to Surface Chemistry of Oxides, Nauka, Novosibirsk, 1984 Search PubMed.
- K. I. Hadjiivanov and G. N. Vayssilov, Adv. Catal., 47, 307 Search PubMed.
- A. Dandekar and M. A. Vannice, J. Catal., 1998, 178, 621 CrossRef CAS.
- M. Kantcheva, M. U. Kucukkal and S. Suzer, J. Catal., 2000, 190, 144 CrossRef CAS.
- K. I. Hadjiivanov and G. Busca, Langmuir, 1994, 10, 4534 CrossRef CAS.
- D. F. Cox and K. H. Schulz, Surf. Sci., 1991, 249, 138 CrossRef CAS.
|
| This journal is © The Royal Society of Chemistry 2011 |
Click here to see how this site uses Cookies. View our privacy policy here. ![[thin space (1/6-em)]](https://www.rsc.org/images/entities/char_2009.gif) :
:![[thin space (1/6-em)]](https://www.rsc.org/images/entities/char_2009.gif) TiO2 ratio of 1
TiO2 ratio of 1![[thin space (1/6-em)]](https://www.rsc.org/images/entities/char_2009.gif) :
:![[thin space (1/6-em)]](https://www.rsc.org/images/entities/char_2009.gif) 10 were prepared by a photodeposition method and studied for the oxidation of CO. The Cu/TiO2 catalyst exhibited remarkably high activity and an overall CO oxidation could be achieved at <100 °C. The effects of activation temperatures, GHSV and initial CO concentration on CO oxidation over Cu/TiO2 were further investigated. XRD, TEM, XPS-AES, H2-TPR and FTIR of CO adsorption were employed to characterize Cu/TiO2 samples and the exact composition of Cu/TiO2 prepared by photo-deposition was determined to be Cu–Cu2O/TiO2. Based on the catalytic and characterization results, the possible mechanism for CO oxidation over Cu–Cu2O/TiO2 was discussed. Finally, the durability and deactivation of Cu–Cu2O/TiO2 during CO oxidation was investigated in time-on-stream reaction.
10 were prepared by a photodeposition method and studied for the oxidation of CO. The Cu/TiO2 catalyst exhibited remarkably high activity and an overall CO oxidation could be achieved at <100 °C. The effects of activation temperatures, GHSV and initial CO concentration on CO oxidation over Cu/TiO2 were further investigated. XRD, TEM, XPS-AES, H2-TPR and FTIR of CO adsorption were employed to characterize Cu/TiO2 samples and the exact composition of Cu/TiO2 prepared by photo-deposition was determined to be Cu–Cu2O/TiO2. Based on the catalytic and characterization results, the possible mechanism for CO oxidation over Cu–Cu2O/TiO2 was discussed. Finally, the durability and deactivation of Cu–Cu2O/TiO2 during CO oxidation was investigated in time-on-stream reaction.![[thin space (1/6-em)]](https://www.rsc.org/images/entities/char_2009.gif) :
:![[thin space (1/6-em)]](https://www.rsc.org/images/entities/char_2009.gif) TiO2 ratio of 1
TiO2 ratio of 1![[thin space (1/6-em)]](https://www.rsc.org/images/entities/char_2009.gif) :
:![[thin space (1/6-em)]](https://www.rsc.org/images/entities/char_2009.gif) 10 were prepared by so-called photodeposition method.20,21 In a typical synthesis of Cu/TiO2, 100 mL 2 mM Cu(NO3)2 solution, 160 mg of TiO2 and 10 mL of ethanol were added into a round-bottom quartz flask under vigorous stirring to form slurry. The slurry was adjusted to pH = 9.5 ± 0.5 using either 1 M HCl or 1 M NaOH aqueous solution and irradiated by a high-pressure mercury light with the main wavelength of 365 nm for 6 h under the protection of pure nitrogen. Finally, the particles were filtered, dried at ambient conditions and denoted as Cu/TiO2-ph. The exact Cu loading in Cu/TiO2-ph is 7.05%, as determined by ICP analysis.
10 were prepared by so-called photodeposition method.20,21 In a typical synthesis of Cu/TiO2, 100 mL 2 mM Cu(NO3)2 solution, 160 mg of TiO2 and 10 mL of ethanol were added into a round-bottom quartz flask under vigorous stirring to form slurry. The slurry was adjusted to pH = 9.5 ± 0.5 using either 1 M HCl or 1 M NaOH aqueous solution and irradiated by a high-pressure mercury light with the main wavelength of 365 nm for 6 h under the protection of pure nitrogen. Finally, the particles were filtered, dried at ambient conditions and denoted as Cu/TiO2-ph. The exact Cu loading in Cu/TiO2-ph is 7.05%, as determined by ICP analysis.
![[thin space (1/6-em)]](https://www.rsc.org/images/entities/char_2009.gif) :
:![[thin space (1/6-em)]](https://www.rsc.org/images/entities/char_2009.gif) TiO2 ratio of 1
TiO2 ratio of 1![[thin space (1/6-em)]](https://www.rsc.org/images/entities/char_2009.gif) :
:![[thin space (1/6-em)]](https://www.rsc.org/images/entities/char_2009.gif) 10 was also prepared by wet impregnation and the obtained sample was denoted as Cu/TiO2-im (Cu loading: 7.21%).
10 was also prepared by wet impregnation and the obtained sample was denoted as Cu/TiO2-im (Cu loading: 7.21%).![[thin space (1/6-em)]](https://www.rsc.org/images/entities/char_2009.gif) 000 h−1. The inlet and outlet gases were monitored on-line using a gas chromatograph (HP 6820 series) equipped with molecular sieve 5A and Porapak Q columns. The CO conversion was calculated both from the consumption of CO and the production of CO2 in the outlet.
000 h−1. The inlet and outlet gases were monitored on-line using a gas chromatograph (HP 6820 series) equipped with molecular sieve 5A and Porapak Q columns. The CO conversion was calculated both from the consumption of CO and the production of CO2 in the outlet.

![[thin space (1/6-em)]](https://www.rsc.org/images/entities/char_2009.gif) 000 h−1.
000 h−1.
![[thin space (1/6-em)]](https://www.rsc.org/images/entities/char_2009.gif) 000 h−1.
000 h−1.![[thin space (1/6-em)]](https://www.rsc.org/images/entities/char_2009.gif) 000 h−1 to 48
000 h−1 to 48![[thin space (1/6-em)]](https://www.rsc.org/images/entities/char_2009.gif) 000 h−1. Nevertheless, an overall CO oxidation to CO2 is obtained at below 150 °C even at the highest GHSV of 48
000 h−1. Nevertheless, an overall CO oxidation to CO2 is obtained at below 150 °C even at the highest GHSV of 48![[thin space (1/6-em)]](https://www.rsc.org/images/entities/char_2009.gif) 000 h−1. Under fixed GHSV of 24
000 h−1. Under fixed GHSV of 24![[thin space (1/6-em)]](https://www.rsc.org/images/entities/char_2009.gif) 000 h−1, a slight decrease in CO conversion is observed on Cu/TiO2 catalyst with initial CO concentration increasing from 1000 ppm to 5000 ppm, and a more serious decrease in CO conversion is observed with CO concentration further increasing to 10
000 h−1, a slight decrease in CO conversion is observed on Cu/TiO2 catalyst with initial CO concentration increasing from 1000 ppm to 5000 ppm, and a more serious decrease in CO conversion is observed with CO concentration further increasing to 10![[thin space (1/6-em)]](https://www.rsc.org/images/entities/char_2009.gif) 000 ppm.
000 ppm.



![[thin space (1/6-em)]](https://www.rsc.org/images/entities/char_2009.gif) 000 h−1.
000 h−1.![[thin space (1/6-em)]](https://www.rsc.org/images/entities/char_2009.gif) :
:![[thin space (1/6-em)]](https://www.rsc.org/images/entities/char_2009.gif) TiO2 = 1
TiO2 = 1![[thin space (1/6-em)]](https://www.rsc.org/images/entities/char_2009.gif) :
:![[thin space (1/6-em)]](https://www.rsc.org/images/entities/char_2009.gif) 10) prepared by photodeposition was investigated. Cu/TiO2 exhibited remarkably high activity with low apparent activation energy of 33.1 kJ mol−1 and a detailed study was carried out on Cu/TiO2 catalyst. The exact composition of Cu/TiO2 prepared by photo-deposition was determined to be Cu–Cu2O/TiO2, based on the characterization results from XRD, XPS-AES, H2-TPR and FTIR of CO adsorption. The CO oxidation over Cu–Cu2O/TiO2 was investigated by in situFTIR spectra and carbonyls on Cu+ were observed as key intermediates. The mechanism for CO oxidation over Cu–Cu2O/TiO2 was further discussed and the step of Langmuir-Hinshelwood reaction (CO* + O* → CO2 + 2*) was proposed to occur through the cooperation between Cu2O and metallic copper. Time-on-stream behaviour of Cu–Cu2O/TiO2 for CO oxidation indicated no deactivation at 100 °C for over 200 h in the absence of H2O. While in the presence of 2% H2O, two types of deactivation was observed, which was then attributed to the competitive adsorption of H2O on the active sites and H2O-promoted oxidation of Cu or Cu2O.
10) prepared by photodeposition was investigated. Cu/TiO2 exhibited remarkably high activity with low apparent activation energy of 33.1 kJ mol−1 and a detailed study was carried out on Cu/TiO2 catalyst. The exact composition of Cu/TiO2 prepared by photo-deposition was determined to be Cu–Cu2O/TiO2, based on the characterization results from XRD, XPS-AES, H2-TPR and FTIR of CO adsorption. The CO oxidation over Cu–Cu2O/TiO2 was investigated by in situFTIR spectra and carbonyls on Cu+ were observed as key intermediates. The mechanism for CO oxidation over Cu–Cu2O/TiO2 was further discussed and the step of Langmuir-Hinshelwood reaction (CO* + O* → CO2 + 2*) was proposed to occur through the cooperation between Cu2O and metallic copper. Time-on-stream behaviour of Cu–Cu2O/TiO2 for CO oxidation indicated no deactivation at 100 °C for over 200 h in the absence of H2O. While in the presence of 2% H2O, two types of deactivation was observed, which was then attributed to the competitive adsorption of H2O on the active sites and H2O-promoted oxidation of Cu or Cu2O.


