Photocatalytic degradation of Rhodamine B using nanocrystalline TiO2–zeolite surface composite catalysts: effects of photocatalytic condition on degradation efficiency
Received
8th January 2011
, Accepted 21st April 2011
First published on 20th June 2011
Abstract
Nanocrystalline TiO2–zeolite surface (TZS) composites were prepared by a novel technique, i.e., sol–gel method with the assistance of supercritical pretreatment. The samples were characterized by X-ray diffraction (XRD), thermogravimetric and differential thermal analysis (TG-DTA), scanning electron microscopy (SEM) and BET surface area analysis. The behavior of TZS in the catalytic degradation of Rhodamine B (RhB) dye under UV-light was examined as a function of the pH values in solution, light intensity, irradiation time, TiO2 coating ratio of TZS and its concentration in solution, and initial RhB concentration. The kinetics of photocatalytic RhB degradation was found to follow a pseudo-first-order rate law. It was observed that the presence of the zeolites enhanced the photoefficiency of the titanium dioxide due to synergistic effects of the improved adsorption of RhB with efficient delocalisation of photogenerated electrons and TiO2 photocatalysis. Furthermore, the photocatalytic activity of TiO2 was further enhanced by a zeolite support pretreated in supercritical CO2. It is mainly attributed to the fact that TZS has high surface area in comparison with TiO2–zeolite (TZ) composites prepared by the sol–gel method only. The optimal conditions were a concentration of 2 mg L−1 at pH 10 with 32 mW cm−2 of illumination and a catalyst content of 6 g L−1 for the fastest rate of RhB photocatalytic degradation.
1. Introduction
Over the past few decades, the fabrication of porous nanocrystalline titanium dioxide has attracted much attention in terms of its versatile applications in solar cells and electrical and photocatalytic systems because it is highly stable and non-toxic.1–3 Several studies have focused on the use of porous nanocrystalline TiO2 for the purpose of improving the photocatalytic efficiency with respect to the high surface-to-volume ratio.4–7 However, the drawbacks of this material, such as easy loss of photocatalytic activity, agglomeration and difficulty in being recovered, restrict its application in photocatalytic systems. Several studies immobilized nanocrystalline TiO2 onto porous carriers, forming composites with high surface areas, to overcome these disadvantages by synergistic effects.8–10 However, the conventional preparation techniques usually suffer from their inherent disadvantages. For example, the deposition of TiO2 nanoparticles in pores and agglomeration between neighboring TiO2 particles at the entrance to pores in most preparation processes often causes the surface area of the porous support to greatly decrease, which weakens the enhancement of the photocatalytic efficiency by means of the increase of composite surface area. Therefore, the development of an immobilization technique that can maintain a high surface area and the excellent physicochemical properties of TiO2 for photocatalysis is thus required. However, few efforts have been made to prepare photocatalysts only coated on a porous material’s surface. It has been well known that supercritical CO2 has a high diffusivity because of its low viscosity and low surface tension, which makes it enter into the deep space of nanoscale pores more easily than any liquid solvents.11–13 The supercritical fluid can dissolve substances of low volatility, so supercritical CO2 is a good solvent for substances of low volatility that are impregnated into the pores or vessels of porous materials to synthesize a “twin template” without pores due to a plugging effect. Zeolites have been chosen as the catalyst support in wastewater treatment since zeolites can delocalise the band gap excited electrons of TiO2 and thereby minimise electron–hole recombination14 besides relatively high surface areas. In addition, the ability of zeolites to favor photoinduced electron-transfer reactions and retard undesired back electron transfer has been reported.15 Based on all the advantages mentioned above, herein, using the sol–gel method combined with supercritical fluid impregnation process, we explore a new strategy to synthesize nanocrystalline titania coated on the surface of porous zeolites.
The dye under consideration is Rhodamine B, which is a highly water soluble, basic red dye of the xanthene class. It is widely used as a colorant in textiles and food stuffs, and is also a well-known water tracer fluorescent. RhB is highly soluble in water and organic solvents, and its colour is fluorescent bluish-red. This compound is now banned from use in foods and cosmetics because it has been found to be potentially toxic and carcinogenic. So the photodegradation of RhB is important with regard to the purification of dye effluents.4
In the present work, nanocrystalline TiO2–zeolite surface (TZS) composite catalysts are prepared by the pretreatment of zeolites in supercritical CO2 using paraffin as a plugging agent, and sol–gel processing using tetrabutyl titanate as a precursor. The effects of the photocatalytic conditions on TZS photoactivity are investigated by the photocatalytic degradation of Rhodamine B.
2. Experimental
2.1 Preparation of TiO2-coated zeolite surface
Porous natural zeolites were used as substrates to support nanocrystalline TiO2. Paraffin used as a plugging agent was dissolved in supercritical CO2, and then impregnated into the porous zeolite under the desired supercritical condition to form twin templates. Precursor solutions for the TiO2 sol were prepared as follows: tetrabutyl titanate (11.2 mL) and diethanolamine (3.8 mL) were dissolved in 105.7 mL of ethanol. The solution was stirred vigorously at 20 °C, followed by the addition of a mixture of distilled water (4.5 mL), ethanol (30 mL) and the desired amount of HCl. The resulting alkoxide solution was left at 20 °C to hydrolyze for a period of time to obtain a TiO2 sol. The desired amount of twin templates were immersed into the TiO2 sol with a certain viscosity, and the mixture stirred in an ultrasonic bath. When the TiO2 sol coated on the twin templates changed to a TiO2 gel with ultrasonic treatment, the TiO2 gel-coated twin templates were vacuum dried and, subsequently, the process was repeated from immersion to drying. Finally, the grains obtained were calcined at 500 °C in air for 2 h, which resulted in the preparation of nanocrystalline TiO2–zeolite surface (TZS) composite catalysts with different TiO2 coating ratios, i.e., TZS-n, where n represents the coating ratio. TiO2 weight was maintained to obtain 2, 4, 5 and 7 wt% TiO2 in the finished forms of the TSZ catalyst and T/TSZ was used to represent the concentration of the TiO2 catalyst. In addition, according to the described process, porous zeolite has been used to replace the twin templates for the formation of TiO2–zeolite with a coating ratio of 5% (TZ-5) composites by the sol–gel method only, with repeating the cycle from dipping to calcination. Pure TiO2 powders were prepared as a reference using the same hydrolysis procedure for tetrabutyl titanate.
2.2 Characterization
Crystalline phases of the samples were identified by X-ray diffraction (XRD) measurements (Y-2000, Dandongaolong in China) using Cu-Kα as radiation. The BET surface area of the samples was determined by nitrogen adsorption using BET surface area analysis (ASAP2010; Micromeritics Company, USA). Morphologies were observed by SEM (S-3400N, Japan). Thermochemical processes were identified by thermogravimetric and differential thermal analysis (WCT-2C, Bejing in China).
2.3 Photocatalytic properties of the samples
Rhodamine B (RhB) was chosen as a model organic compound to evaluate the photoactivity of the prepared samples and the effects of photocatalytic conditions on their catalytic performance. Fig. 1 shows a scheme of the experimental equipment (400 mL volume). The main component of the system is the reactor with a height of 500 mm and an inner diameter of 80 mm, with internal stirring by air sparging with a flow capacity of 10 mL s−1. An ultraviolet lamp is positioned inside a pyrex cell with a diameter of 30 mm, and the wavelength range of the UV lamp was 320–400 nm. To adjust the solution pH values to the desired levels, dilute NaOH and HNO3 are used. Photocatalyst was suspended in 350 mL of air-sparged aqueous solution containing RhB in the pyrex reaction vessel. The temperature of the photocatalytic reaction is maintained at 25 ± 1 °C by water circulation. To determine the change in RhB concentration in solution during the process, a few millilitres of the solution was taken from the reaction mixture, subsequently centrifuged, filtered through a millipore filter to separate the catalysts, and loaded into a UV-Vis spectrometer (JascoV-500, Japan). The RhB concentration was calculated from the absorbance at 556 nm using a calibration curve.
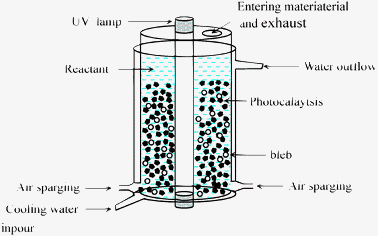 |
| | Fig. 1 The experimental setup for the photocatalytic reaction. | |
3. Results and discussion
3.1 Characterization of samples
Thermal analysis is a useful tool to provide information about the dehydration and dehydroxylation temperatures of zeolites and also about the thermal stability of the zeolite framework. Typical TG-DTA curves of the zeolites, TiO2 gels/zeolites and TiO2 gel/twin template composites are shown in Fig. 2. The dehydration and dehydroxylation process of zeolites can be followed on DTA curves by two endothermic peaks between 150–160 and 700–800 °C, respectively. The obtained TG-DTA curves of zeolites are in strong agreement with the findings for similar zeolites.16,17 Weight loss values of TiO2 gels/zeolites and TiO2 gel/twin template are about 35% and 42%, respectively. The different amount of TiO2 gels coated on the zeolite surface followed the same trend and were not included in Fig. 2. The total weight loss profile became flat after 450 °C, indicating that all paraffin or organic residues are eliminated before this temperature. Additionally, the weight loss ratio of TiO2 gel/twin template is obviously more than that of TiO2 gel/zeolites due to much paraffin existing in the twin template that contains the same TiO2 content. As indicated in Fig. 2B, four peaks are observed in the composites from 100–800 °C. The 1 peak ranging from 100–200 °C is an endothermic peak mainly due to the desorption of water molecules. The 2 label is an exothermic peak ranging from 200–350 °C, which is attributed to the decomposition and combustion of the organic species. The 3 label with the exothermic peak is from 500–700 °C without further loss in weight, corresponding to the TG curves in Fig. 2A, which are due to the phase transformation from anatase to rutile.18,19 The 4 label with the endothermic peak the same as pure zeolites is from 700–800 °C due to dehydroxylation. Compared with the TiO2 gel/zeolites, the intensity of the second exotherm of TiO2 gel/twin template increases. The result also confirmed that paraffin could effectively penetrate into the pores of the zeolites when supercritical CO2 was used as the solvent.
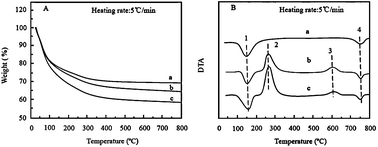 |
| | Fig. 2 The weight loss profiles (A) and DTA curves (B) of various samples dried at room temperature. Symbols are zeolites (a), TiO2 gel/zeolites (b) and TiO2 gel/twin template (c). Labels 1 and 4 represent endothermic peaks, while labels 2 and 3 correspond to two exothermic peaks. | |
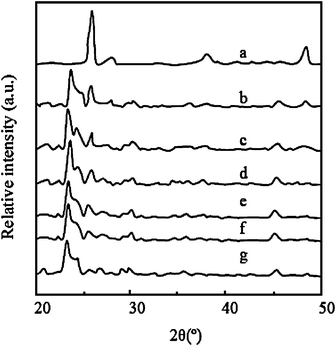
Fig. 3 shows the XRD patterns of prepared samples calcined at 500 °C in air for 2 h. The XRD peak of crystal plane 101 for anatase appeared at 25.4° (2θ) and crystal plane 110 for rutile appeared at 27.5° (2θ), which is in agreement with the literature report.20 The intensity of the peak at 2θ = 23.6° corresponds to natural zeolites. The full width at half maximum (FWHM) of the XRD reflections is an indication of the size of the crystallites present in the system. The obtained crystallite sizes for the samples calculated from the FWHM data using Scherrer formulae are listed in Table 1. Compared with pure TiO2, the low intensity of the X-ray reflection corresponding to the composites shows that the TiO2 crystallites grow relatively slowly. The restriction of the crystalline growth of TiO2 is attributed to the high surface areas of zeolites. Additionally, the TiO2 crystalline size of TZ-5 is smaller than that of TZS due to lots of the titania source being only coated on the surface of TZS. For TZS samples with an increase in the loading of TiO2, it is obviously found that the intensity of the peak (2θ = 25.4°) of TiO2 gradually increases and the intensity of the zeolite peak (2θ = 23.6°) simultaneously decreases, which indicates high TiO2 coating is available with the growth of crystallites and improvement of crystallization.
 |
| | Fig. 3
XRD patterns of samples: a, b, c, d, e, f and g are pure TiO2, TZS with 7, 5, 4 and 2 wt% TiO2, TZ-5 and zeolites, respectively. | |
Table 1 Characteristics of samples, including zeolites, twin template and composites calcined at 500 °C with different TiO2 coating ratios
| Samples |
TiO2 coating ratio (wt%) |
BET surface area (m2 g−1) |
Crystalline size (nm) |
k
app (min−1) |
|
Zeolites
|
0 |
287 |
— |
— |
| Twin template |
0 |
21 |
— |
— |
| TZ-5 |
5 |
103 |
7 |
0.0040 |
| TZS-2 |
2 |
267 |
10 |
0.0057 |
| TZS-4 |
4 |
242 |
12 |
0.0076 |
| TZS-5 |
5 |
235 |
15 |
0.0155 |
| TZS-7 |
7 |
195 |
18 |
0.0098 |
The TiO2 coating ratio and the BET surface area in supported samples and the original zeolites are summarized in Table 1, together with the crystalline size of TiO2 and the first-order kinetic constant. Compared to the zeolites, the BET surface area of the twin template greatly decreased due to the penetration of paraffin into the pores of the zeolites, which implies that paraffin could effectively block the pores of the zeolites. This reduces the nitrogen adsorption considerably and hence a low surface area is observed. When the TiO2 gel/twin template is calcined at 500 °C for 2 h, the prepared TZS has a high surface area in comparison to the twin template. It is indicated that the substance blocking the pores of the zeolites has been excluded and the pores appear again, which is in agreement with the TG-DTA results. Additionally, the interstices of TiO2 coating layers can also improve the TZS surface area. The decrease in the surface area of TZ-5 in comparison to the corresponding zeolite support could be due to blocking of the pores. Similar effects of low surface area with TiO2 loading onto zeolite-supported photocatalysts were reported.21 The TZS surface areas are obviously more than TZ-5. This is attributed the fact that for TZS, the TiO2 sol did not enter the zeolite pores and cracks due to the paraffin blocking effect, and then macropores, mesopores and micropores are regenerated with removal of paraffin during the course of calcination. These are possible reasons why the nanocrystalline TiO2 is only coated on the zeolite surface. However, for TZ, the TiO2 coating layer decreases the surface area by blocking the pore entrances on the surface of the zeolites.
As seen in Fig. 4a, the surface of original zeolite is smooth, with pores. However, it can be seen that a layer of TiO2 nanoparticles exists on the zeolite surface, meanwhile, there are some gaps and holes among the particles (Fig. 4b). As indicated in Fig. 6c, compared to the original zeolites (Fig. 4a), the cross-section of TZS is also hardly coated with the TiO2 layer. It is mainly due to TiO2 sol coated on the surface of sealing substrates and then transformed to a TiO2 layer in the calcination process. It is a probable reason why TZS has high surface areas.
 |
| | Fig. 4
SEM images of original zeolite (a), TiO2–zeolite surface (b) and its cross-section (c). | |
3.2 Adsorption
Prior to photocatalysis, adsorption studies were carried out initially over TiO2, TZ-5 and TZS with different TiO2 coating ratios. From the results it was found that adsorption attains a steady state in 60 min, illustrating the establishment of an adsorption equilibrium. Hence 60 min was chosen as the optimum time for adsorption equilibrium. Therefore, all the photodegradation experiments were carried out after this time. The order of adsorption capacity of composites is TZS-2 > TZS-4 > TZS-5 > TZS-7 > TZ-5 (28%, 25%, 20%, 17% and 10%, respectively). Under identical experimental conditions, it was found that only 3% of RhB in solution adsorbed on naked TiO2. This suggests that adsorption of RhB is mainly on the surface of the zeolite carrier. Additionally, the adsorption results are in accordance with the number of protonic sites and surface areas of the composites. The adsorption performance of these samples is largely affected by the photocatalytic conditions, but their adsorption-capability order is unchanged.
3.3 Photocatalytic activity
The results of RhB removal by the photocatalysts are presented in Fig. 5. The photodegradation of RhB followed the pseudo-first-order kinetics and the pseudo-first-order rate constant (kapp) for RhB degradation increased from 0.0040 min−1 for TZ-5 to 0.155 min−1 for TZS-5, as listed in Table 1. The photodegradation efficiency of RhB by TZS was higher than that of TZ-5, depicting the high photocatalytic activity of the prepared TZS mainly due to high surface areas.
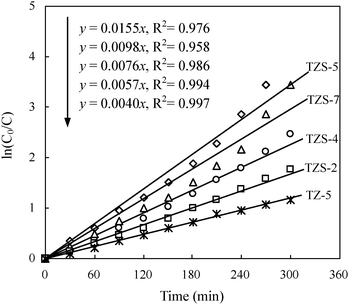 |
| | Fig. 5 The relationship between photocatalytic degradation (ln(C0/C)) of RhB and irradation time by samples with a catalyst content of 6 g L−1. C0 = 2 mg L−1, I0 = 32 mW cm−2, pH = 10. | |
The photodegradation efficiency of RhB by TZS increased and then decreased with the increase in TiO2 coating ratio from 2 to 7%. A parabolic curve relationship between the rate constant (kapp) and TiO2 concentration was also established. It is noted that the TZS-5 fabricated has the appropriate surface area and TiO2 concentration, resulting in it having the highest kapp for RhB photodegradation, because the TiO2 coating ratio and the BET surface area for the TZS photocatalyst are two mutually constrained factors in increasing photocatalytic efficiency although enhancing either of them will benefit the photocatalytic efficiency. So the increase in TiO2 coating ratio is able to improve TiO2 photoactivity by providing more activated centres and at the same time decreased photoactivity by reducing the surface areas of composites. For TZS catalysts with a coating ratio of 2, 4, and 5 wt%, because the former effect on photoactivity is stronger than the latter effect, their rate constant kapp increased along with the coating ratio of TiO2. However, for TZS-7, the decrease of photoactivity is reasonably supposed to be the fact that the effect of TiO2 coating ratio on enhancing photoactivity was less than that of the surface area decrease. To confirm cyclic usage is possible for the TiO2–zeolite surface composite photocatalysts produced, the photocatalyst TZS-5 was selected.
The degradation efficiency of RhB by TZS-5 with different utilization times is presented in Fig. 6. The rate constant (kapp) values of RhB degradation are found to be variable with utilization time mainly due to the different degradation intermedia in TZS. An equation (y = −0.000018x + 0.0153) was found by linear analysis to describe the relationship between the decay rate and the utilization time of the catalyst. Although the photocatalytic reactivity of the present photocatalyst is just slightly reduced in stirred aqueous solution, this equation indicates that cyclic usage of the photocatalyst is possible and its stability in treating harazdous-dye polluted water is satisfactory. At the same time, it also proves that the final removal of RhB from solutions is caused by the photocatalytic degradation rather than the adsorption process that will lead to the saturated adsorption of RhB on the photocatalyst.
![The photoactivity changes of TZS in the continuous experiment. C0 = 2 mg L−1, I0 = 32 mW cm−2, [TZS]= 6 g L−1, T/TZS = 5%, pH = 10.](/image/article/2011/CY/c1cy00012h/c1cy00012h-f6.gif) |
| | Fig. 6 The photoactivity changes of TZS in the continuous experiment. C0 = 2 mg L−1, I0 = 32 mW cm−2, [TZS]= 6 g L−1, T/TZS = 5%, pH = 10. | |
A mechanism for the enhanced photocatalysis of the TZS composite is shown schematically in Fig. 7. Due to an intimate contact between an anatase nanoparticle and zeolites, electrons (e−) are excited from the valence band (VB) to the conduction band (CB) of the TiO2 under UV illumination, creating a hole (h+) in the VB. In the absence of the zeolites, most of these charges quickly recombine. Typically, only a small number of electrons (<1%) and holes are trapped and participate in photocatalytic reactions, resulting in low reactivity.18,22Zeolites, attached to the surface of the TiO2, may mainly assist the efficient delocalisation of photogenerated electrons by the electrical conductance between the zeolites and the TiO2 surface due to the electrical conductance of the zeolites.15,23 So the corresponding high concentration of holes on the TiO2, then, accounts for the higher activity of the composite photocatalyst. The RhB molecules in the bulk solutions are supposed to be condensed around TiO2 particles by zeolite adsorption, and then a high RhB concentration is provided for photocatalytic reaction. Additionally, TiO2 photocatalysis for adsorbed RhB on support can keep the adsorptive capacity of the support unsaturated. The adsorption of the zeolites with efficient electron delocalisation properties and photocatalysis of the deposited TiO2, have been combined, resulting in synergistic effects in improving the photoefficiency of titanium dioxide.
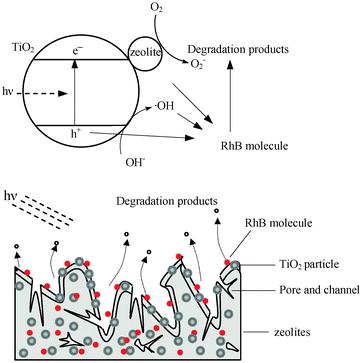 |
| | Fig. 7 A schematic diagram for the adsorption and photocatalytic degradation of RhB molecules on TZS. | |
3.4 Effect of operational parameters on photocatalytic activity
There are many factors affecting the photocatalytic process by TZS, for example coating ratio, annealing temperature, light intensity and dye concentration.24–27
3.4.1 Effect of solution pH.
The pH value is an important operational variable in actual wastewater treatment. In photocatalysis systems, the pH value is also one of the factors influencing the rate of degradation. It is clearly observed that with the increasing of pH, the photocatalytic rate is also increased (Fig. 8). Strong acid is not available for decomposing RhB. It is due to the effect of pH on the ionization state of the surface according to the following reactions,
so pH changes can thus influence the adsorption of dye molecules onto the TiO2 surfaces, an important step for photocatalytic oxidation to take place.24 At acidic pH values, the surface of TZS is positively charged and offers unfavourable conditions to adsorb positively charged particles, such as RhB molecules. When the pH value was less than 4, the molecule of RhB was in its cationic form and its adsorption on the catalyst surface became difficult due to an electrostatic repulsive force.25,26 The degradation rate of some azo dyes increases with decrease in pH, as reported elsewhere.27 At alkaline pH values, the surface of the catalysts is negatively charged and the adsorption of RhB becomes easy due to an electrostatic attraction force.24 Since the molecule of RhB was in the zwitterionic form in the alkaline solution, a certain part of the molecule was attracted by the catalyst surface, thus kapp increases. Additionally, it was stated that in alkaline solution, ˙OH are easier to generate by oxidizing more hydroxide ions available on the TiO2 surface, thus the efficiency of the photocatalytic process is logically enhanced.
![The effect of pH values of RhB on its photocatalytic degradation. C0 = 2 mg L−1, I0 = 32 mW cm−2, [TZS] = 6 g L−1, T/TZS = 5%.](/image/article/2011/CY/c1cy00012h/c1cy00012h-f8.gif) |
| | Fig. 8 The effect of pH values of RhB on its photocatalytic degradation. C0 = 2 mg L−1, I0 = 32 mW cm−2, [TZS] = 6 g L−1, T/TZS = 5%. | |
3.4.2 Effect of dye concentration.
The relation between the photodegradation rate of RhB and its concentration is shown in Fig. 9. Under the same experimental conditions, the photocatalytic curves follow first-order reaction kinetics. The observed results reveal that the initial dye concentration influences the degradation rate of the dye. As the initial concentration of dye increases, the degradation rate decreases. This negative effect can be described as follows: when the dye concentration increases, the amount of dye adsorbed on the catalyst surface increases. The generation of OH˙ radicals on the surface of the catalyst is reduced at high dye concentrations, since active sites are covered by dye ions.28,29 Additionally, the increase in dye concentration also decreases the path length of the photon entering the dye solution. Meanwhile, at high dye concentration a significant amount of solar light may be absorbed by the dye molecules rather than the catalyst and this may also reduce the photocatalytic rate. Consequently, the degradation rate of the dye decreases as the dye concentration increases.
![The effect of initial concentration of RhB on its photocatalytic degradation. I0 = 32 mW cm−2, [TZS] = 6 g L−1, T/TZS = 5%, pH = 10.](/image/article/2011/CY/c1cy00012h/c1cy00012h-f9.gif) |
| | Fig. 9 The effect of initial concentration of RhB on its photocatalytic degradation. I0 = 32 mW cm−2, [TZS] = 6 g L−1, T/TZS = 5%, pH = 10. | |
3.4.3 Effect of light intensity.
Light intensity is a major factor in photocatalytic reactions, because electron–hole pairs are produced by light energy.30 The decomposition rate of RhB increased with increasing light intensity, as shown in Fig. 10. This was because higher electric power provides higher energy for more TiO2 in the composite to produce electron–hole pairs. However, the rate of kapp increase with electric power beyond 32 mW cm−2 is obviously much less than that under 32 mW cm−2 for RhB degradation. The effect of light intensity on the kinetics of a photocatalytic process has been explained as (a) at low light intensity, the rate would increase linearly or depend on the square root of the light intensity,31,32 and (b) at high light intensities, the rate is independent of light intensity.33 At increased light intensity electron–hole pair separation competes with recombination, thereby causing a lower effect on the reaction rate. Some research has found that enhancement of the rate of degradation as the light intensity increased was also observed,34–36 meanwhile, this dependency is not linear, as revealed by a regression analysis. In our work, the degradation rate was increased and then slightly changed with increased light power. In terms of considerations of the energy and the degradation efficiency, the optimal light intensity is 32 mW cm−2 for RhB degradation.
![The effect of light intensity on photocatalytic degradation of RhB. C0 = 2 mg L−1, [TZS] = 6 g L−1, T/TZS = 5%, pH = 10.](/image/article/2011/CY/c1cy00012h/c1cy00012h-f10.gif) |
| | Fig. 10 The effect of light intensity on photocatalytic degradation of RhB. C0 = 2 mg L−1, [TZS] = 6 g L−1, T/TZS = 5%, pH = 10. | |
3.4.4
Catalyst concentration.
The reaction rate as a function of catalyst concentration is important.33 Hence a series of experiments were carried out to find the optimum catalyst concentration by varying TZS-5 from 3 to 10 g L−1 (Fig. 11). The turbidity of the solution above 6 g L−1 reduced the light transmission through the solution, while below this level the adsorption on TiO2 surface and the absorption of light by TiO2 were the limiting factors. It is reported that the catalyst concentration has both a positive and negative impact on the photodecomposition rate. The increased concentration of catalyst increases the quantity of photons absorbed and consequently the degradation rate. Further increase in catalyst concentration beyond 6 g L−1 may result in the deactivation of activated molecules due to collision with the ground state molecules. Meanwhile, when the concentration of the catalyst increases above the optimum value (6 g L−1), the degradation rate decreases due to the interception of the light by the suspension.33 The excess catalyst prevents the formation of the ˙OH radical, a primary oxidant in the photocatalytic system and then the efficiency of the degradation is reduced accordingly. Additionally, the increase of catalyst concentration beyond the optimum may result in the agglomeration of catalyst particles, hence part of the catalyst surface becomes unavailable for photon absorption, and the degradation rate decreases.37
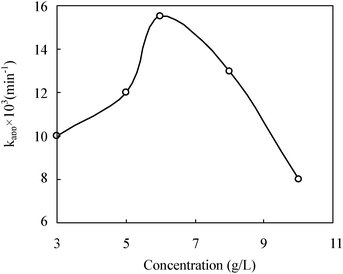 |
| | Fig. 11 The effect of catalyst content on the photocatalytic degradation of RhB. C0 = 2 mg L−1, I0 = 32 mW cm−2, T/TZS = 5%, pH = 10. | |
4. Conclusions
Nanocrystalline TiO2–zeolite surface (TZS) composites were prepared via a novel technique, i.e., sol–gel method with the assistance of supercritical pretreatment. The zeolites can control the growth of the crystalline TiO2 , delocalise excited band gap electrons of TiO2 and provide a high RhB concentration for photocatalytic reaction. Thus, the synergistic effects of zeolite supports and TiO2 are responsible for the enhanced degradation of RhB. Furthermore, zeolites, pretreated in supercritical CO2, were used as supports to synthesize TZS with a high surface area. Thus, the TZS is proven to exhibit high efficiency in the photocatalytic degradation of RhB in comparison with TZ-5. The photocatalytic efficiency is strongly dependent on the TiO2 coating ratio in the course of RhB degradation by TZS. The sample with 5 wt% of TiO2 coating ratio, shows the highest photocatalytic activity among all samples. Additionally, the used TZS-5 retains high photocatalytic activity for the decay rate of RhB.
A mechanism for the enhanced reactivity is an electron shuttle from TiO2 particles to the zeolites that stabilizes charge separation and reduces charge recombination. In addition, the significant synergistic effects occur between the high adsorption capacity of zeolites with the efficient delocalisation of photogenerated electrons and the photocatalytic activity of TiO2. The optimal conditions were a RhB concentration of 2 mg L−1 at pH 10 with 32 mW cm−2 of illumination and a catalyst content of 6 g L−1 for the fastest rate of RhB photocatalytic degradation.
Acknowledgements
This work was supported by National Natural Science Foundation of China (50802034) and the Natural Science Foundation of Hunan Province (No.09JJ6101.).
References
- J. Beusen, M. K. Van Bael, H. Van den Rul, J. D'Haen and J. Mullens, J. Eur. Ceram. Soc., 2007, 27, 4529 Search PubMed.
- H. Yoneyama and T. Torimoto, Catal. Today, 2000, 58, 133 CrossRef CAS.
- S. Karuppuchamy, M. Iwasaki and H. Minoura, Vacuum, 2007, 81, 708 Search PubMed.
- N. Barka, S. Qourzal, A. Assabbane, A. Nounah and Y. Ait-Ichou, J. Photochem. Photobiol., A, 2008, 195, 346 Search PubMed.
- H. G. Oliveira, D. C. Nery and C. Longo, Appl. Catal., B, 2010, 93, 205 Search PubMed.
- H. Choi, E. Stathatos and D. D. Dionysiou, Thin Solid Films, 2006, 510, 107 Search PubMed.
- S. Bakardjieva, J. Šubrt, V. Štengl, M. J. Dianez and M. J. Sayagues, Appl. Catal., B, 2005, 58, 193 CrossRef CAS.
- Y. Liu, S. Gi Yang, J. Hong and C. Sun, J. Hazard. Mater., 2007, 142, 208 Search PubMed.
- H. Ichiura, T. Kitaoka and H. Tanaka, Chemosphere, 2003, 50, 79 CrossRef CAS.
- V. Belessi, D. Lambropoulou, I. Konstantinou, A. Katsoulidis, P. Pomonis, D. Petridis and T. Albanis, Appl. Catal., B, 2007, 73, 292 Search PubMed.
- E. Alonso, I. Montequi and M. J. Cocero, J. Supercrit. Fluids, 2009, 49, 233 CrossRef CAS.
- E. Alonso, I. Montequi, S. Lucas and M. J. Cocero, J. Supercrit. Fluids, 2007, 39, 453 Search PubMed.
- S. Pereda, E. A. Brignole and S. B. Bottini, J. Supercrit. Fluids, 2009, 47, 336 Search PubMed.
- M. V. Shankar, S. Anandan, N. Venkatachalam, B. Arabindoo and V. Murugesan, Chemosphere, 2006, 63, 1014 Search PubMed.
- C. Ratiu, F. Manea, C. Lazau, I. Grozescu, C. Radovan and J. Schoonman, Desalination, 2010, 260, 51 Search PubMed.
- A. Hassan and A. Sayari, Appl. Catal., A, 2005, 297, 159 Search PubMed.
- X. J. Zhang, Y. Wang and F. Xin, Appl. Catal., A, 2006, 307, 222 Search PubMed.
- C. P. Sibu, S. Rajesh Kumar, P. Mukundan and K. G. K. Warrier, Chem. Mater., 2002, 14, 2876 CrossRef CAS.
- V. Durgakumari, M. Subrahmanyam, K. V. Subba Rao, A. Ratnamala, M. Noorjahan and Keiichi Tanaka, Appl. Catal., A, 2002, 234, 155 CrossRef CAS.
- V. Durgakumari, M. Subrahmanyam, K. V. Subba Rao, A. Ratnamala, M. Noorjahan and Keiichi Tanaka, Appl. Catal., A, 2002, 234, 155 CrossRef CAS.
- H. Ichiura, T. Kitaoka and H. Tanaka, Chemosphere, 2003, 50, 79 CrossRef CAS.
- S. Zheng, L. Gao, Q. H. Zhang and J. K. Guo, J. Mater. Chem., 2000, 10, 723 RSC.
- T. K. Kim, M. N. Lee, S. H. Lee, Y. C. Park, C. K. Jung and J. H. Boo, Thin Solid Films, 2005, 475, 171 Search PubMed.
- J. Q. Li, L. P. Li, L. Zheng, Y. Z. Xian and L. T. Jin, Electrochim. Acta, 2006, 51, 4942 Search PubMed.
- Y. Guo, J. Zhao, H. Zhang, S. Yang, J. Qi, Z. Wang and H. Xu, Dyes Pigm., 2005, 66, 123 Search PubMed.
- M. L. Huang, C. F. Xu, Z. B. Wu, Y. F. Huang, J. M. Lin and J. H. Wu, Dyes Pigm., 2008, 77, 327 Search PubMed.
- S. Sakthivel, B. Neppolian, M. V. Shankar, B. Arabindoo, M. Palanichamy and V. Murugesan, Sol. Energy Mater. Sol. Cells, 2003, 77, 65 CrossRef CAS.
- C. M. So, M. Y. Cheng, J. C. Yu and P. K. Wong, Chemosphere, 2002, 46, 905 CrossRef CAS.
- N. Daneshvar, D. Salari and A. R. Khataee, J. Photochem. Photobiol., A, 2003, 157, 111 Search PubMed.
- T. Zhang, T. Oyama and A. Aoshima, J. Photochem. Photobiol., A, 2001, 140, 163 CrossRef CAS.
- G. Vincent, P. M. Marquaire and O. Zahraa, J. Hazard. Mater., 2009, 161, 1173 Search PubMed.
- N. Daneshvar, M. Rabbani, N. Modirshahla and M. A. Behnajady, J. Photochem. Photobiol., A, 2004, 168, 39 Search PubMed.
- M. Asiltürka, F. Sayılkan, S. Erdemŏglu, M. Akarsu, H. Sayılkan, M. Erdemŏglu and E. Arpac, J. Hazard. Mater., 2006, 129, 164 CrossRef.
- B. Neppolian, H. C. Choi, S. Sakthivel, B. Arabindoo and V. Murugesan, Chemosphere, 2002, 46, 1173 CrossRef CAS.
- S. Sakthivel, B. Neppolian, M. V. Shankar, B. Arabindoo, M. Palanichamy and V. Murugesan, Sol. Energy Mater. Sol. Cells, 2003, 77, 65 CrossRef CAS.
- C. M. So, M. Y. Cheng, J. C. Yu and P. K. Wong, Chemosphere, 2002, 46, 905 CrossRef CAS.
- M. Huang, C. Xu, Z. Wu, Y. Huang, J. Lin and J. Wu, Dyes Pigm., 2008, 77, 327–334 Search PubMed.
|
| This journal is © The Royal Society of Chemistry 2011 |
Click here to see how this site uses Cookies. View our privacy policy here. 


![The photoactivity changes of TZS in the continuous experiment. C0 = 2 mg L−1, I0 = 32 mW cm−2, [TZS]= 6 g L−1, T/TZS = 5%, pH = 10.](/image/article/2011/CY/c1cy00012h/c1cy00012h-f6.gif)

![The effect of pH values of RhB on its photocatalytic degradation. C0 = 2 mg L−1, I0 = 32 mW cm−2, [TZS] = 6 g L−1, T/TZS = 5%.](/image/article/2011/CY/c1cy00012h/c1cy00012h-f8.gif)
![The effect of initial concentration of RhB on its photocatalytic degradation. I0 = 32 mW cm−2, [TZS] = 6 g L−1, T/TZS = 5%, pH = 10.](/image/article/2011/CY/c1cy00012h/c1cy00012h-f9.gif)
![The effect of light intensity on photocatalytic degradation of RhB. C0 = 2 mg L−1, [TZS] = 6 g L−1, T/TZS = 5%, pH = 10.](/image/article/2011/CY/c1cy00012h/c1cy00012h-f10.gif)


