β-Molybdenum nitride: synthesis mechanism and catalytic response in the gas phase hydrogenation of p-chloronitrobenzene
Received
8th October 2010
, Accepted 14th December 2010
First published on 10th February 2011
Abstract
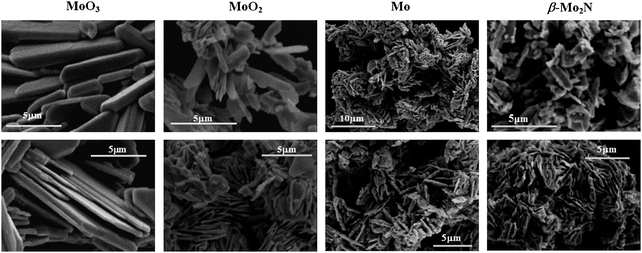
A temperature programmed treatment of MoO3 in flowing N2 + H2 has been employed to prepare β-phase molybdenum nitride (β-Mo2N) which has been used to promote, for the first time, the catalytic hydrogenation of p-chloronitrobenzene. The reduction/nitridation synthesis steps have been monitored in situ and the starting oxide, reaction intermediates and nitride product have been identified and characterized by powder X-ray diffraction (XRD), diffuse reflectance UV-Vis (DRS UV-Vis), elemental analysis, scanning electron microscopy (SEM) and BET/pore volume measurements. Our results demonstrate that MoO3 → β-Mo2N is a kinetically controlled process where an initial reduction stage generates (sequentially) MoO2 and Mo as reaction intermediates with a subsequent incorporation of N to produce β-Mo2N. SEM analysis has established that the transformation is non-topotactic with a disruption to the platelet morphology that characterizes MoO3 and an increase in BET area (from 1 m2 g−1 to 17 m2 g−1). Moreover, temperature programmed desorption measurements have revealed a significant hydrogen uptake (0.71 μmol m−2) on β-Mo2N. This has been exploited in the hydrogenation of p-chloronitrobenzene where p-chloroaniline was generated as the sole product with an associated rate constant (k = 2.0 min−1) that is higher than values recorded for supported transition metals. Our study establishes the reaction mechanism involved in the synthesis of β-Mo2N and demonstrates its viability to promote selective –NO2group reduction as an alternative sustainable, high throughput route to commercially important haloamines.
1. Introduction
Transition-metal nitrides in general, and Mo nitride in particular, exhibit a combination of properties that have resulted in multiple applications as coatings/structural components,1 high performance magnets,2 in electronic and optical devices3 and as catalytic materials.4,5 Conventional preparative routes have involved either (a) high temperature (1400–1900 K) reaction of the base metal and elemental nitrogen,6 (b) carbothermal nitridation of metal oxides6 or (c) a self-propagating high temperature synthesis.7 Alternative methods that can operate under milder reaction conditions have drawn on controlled temperature programmed procedures. Examples include the reaction of MoO3 with NH38–11 and N2 + H2,12,13 reaction of MoCl5 with urea,14reduction of MoO2 with NH4Cl,15chemical vapour deposition of MoCl5 (in the presence of NH3)16 and the thermal decomposition of (HMT)2(NH4)4Mo7O24.17,18 A combination of NH3 + H2 has been the most widely employed reacting gas in reduction–nitridation processes.4,19,20 However, the use of a N2 + H2 mixture circumvents the heat transfer problems associated with the endothermic NH3 decomposition.12 The methodologies applied to date have generated a combination of MoxNy phases, principally metastable cubic (γ-Mo2N) and hexagonal (δ-MoN) structures.6 Although γ-Mo2N is the most commonly synthesized form by thermal treatment of MoO3,9,12,19,21 there is also evidence in the literature for the formation of a body centred tetragonal β-nitride phase with a Mo/N ratio in the range 2.0–2.6.13,22–26
The literature dealing with the temperature programmed synthesis of Mo nitrides is still quite limited and we could not find any comprehensive analysis of the mechanism(s) involved in the formation of β-Mo nitride from MoO3. It is, however, worth noting a number of reports that deal (in part) with Mo nitride preparation,13,23,24,27–29 physical/chemical properties6 and morphology.13,24 We can also flag published studies in which the formation of partially reduced oxides (Mo4O11,30MoO2)9 or ordered bronzes (HxMoO3, 0.07 < x < 0.34)31 and/or Mo22 have been observed during the reduction–nitridation process. Nagai et al.23 recorded the formation of MoO2, γ-Mo2N, β-Mo2N and Mo during treatment of MoO3 with NH3 up to 1173 K. In terms of applications, it has been reported that group VI nitrides can exhibit comparable catalytic activity in hydrogen mediated reactions to that obtained with conventional metal catalysts.4,32 This has been ascribed to a contraction of the d-band and modification of electron density due to the incorporation of N interstitially in the metal lattice,33 resulting in a capacity for H2 adsorption.4 Molybdenum nitrides have been successfully used to promote the hydrogenation of long chain alkadienes,34CO35 and ethylene,36 the hydrodenitrogenation of carbazole23,28,37 and the hydrodesulfuration of thiophene13,24 and dibenzothiophene.38 Moreover, Mckay et al., in a recent study,39 demonstrated an enhanced catalytic response in ammonia synthesis for β-Mo2N (prepared by MoO3 treatment in H2/N2 at 973 K) when compared with δ-MoN and γ-Mo2N. However, we were unable to find any study in the open literature dealing with the hydrogenation of nitro-compounds over molybdenum nitride.
In this paper, we set out to explicitly identify the intermediates in β-Mo nitride synthesis and report the first application of this nitride in the catalytic hydrogenation of nitroarenes. The selective hydrogenation of p-chloronitrobenzene (p-CNB) to p-chloroaniline (p-CAN) has been selected as a model reaction. p-CAN is a high production volume compound,40 extensively used in the manufacture of a range of fine chemicals.41 Existing routes to p-CAN involve high pressure batch liquid phase operations that generate toxic by-products with a low overall yield42 and there is now a pressing demand for alternative cleaner catalytic routes. In this study, we establish the feasibility of β-Mo nitride as a catalytic material to promote the continuous gas phase hydrogenation of p-CNB to p-CAN.
2. Results and discussion
2.1
β-Mo2N synthesis and characterization
2.1.1 Synthesis mechanism.
2.1.1.1 TPR.
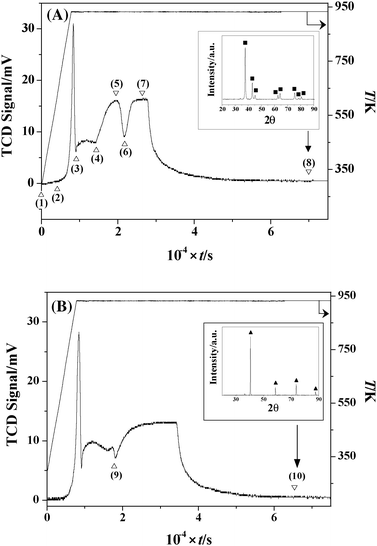
The commercial MoO3 sample (as received), when subjected to a temperature programmed treatment in 15% v/v N2/H2 to 933 K, generated the profile presented in Fig. 1(A). The emergence of four positive (H2 consumption) peaks suggests four separate reaction steps. To probe this response, the thermal treatment was repeated, stopping at different stages in order to generate eight samples for ex situ analysis, as identified in Fig. 1(A). Sample selection included starting material (1), final product (8) and intermediate samples (2–4 and 6) obtained pre- and post- a stage of significant H2 consumption. Given the broadness of the two final peaks, samples 5 and 7 were taken at the peak maxima. Sample 2 was selected, although no significant response was noted, as there is some evidence in the literature31 of a transition from MoO3 to MoO2 at this temperature (623 K). The associated time, temperature related peak maxima (Tmax), BET surface area, total pore volume and phase composition associated with each sample are given in Table 1. Taking the profile in Fig. 1(A), intermediate(s) formation and conversion occurred during the final isothermal (933 K) hold, suggesting a kinetically controlled process. In contrast, previous studies have suggested that Mo nitride intermediate(s) formation was temperature dependant, i.e. thermochemically controlled: MoO2 (613–773 K)9,12,13,43; HxMoOx (≤623 K)31,43,44; Mo4O11 (673 K)45; γ-Mo2OxN1−x (773 K)46; Mo (900–1153 K).13,45,47
 |
| | Fig. 1
TCD response resulting from the temperature programmed treatment of MoO3 (at 5 K min−1 to 933 K) in (A) 15% v/v N2/H2 and (B) 15% v/v Ar/H2. Insets: XRD patterns for the passivated products post thermal treatment. Note: peak assignments based on JCPDS-ICDD standards for (A) β-Mo2N (25-1368, ■) and (B) Mo (42-1120, ▲). | |
Table 1 Reaction time, temperature related TCD signal maximum (Tmax), BET surface area, total pore volume and % fraction of each phase associated with the passivated samples: see Fig. 1(A)
| Sample |
Time/min |
T
max/K |
BET area/m2 g−1 |
Pore volume (10−3 cm3 g−1) |
% (Phase) |
| (1) |
0 |
298 |
1 |
2 |
100 (MoO3) |
| (2) |
69 |
623 |
2 |
3 |
100 (MoO3) |
| (3) |
150 |
933 |
2 |
3 |
100 (MoO2) |
| (4) |
240 |
933 |
6 |
7 |
90 (MoO2) 10 (Mo) |
| (5) |
325 |
933 |
14 |
11 |
25 (Mo) 75 (β-Mo2N) |
| (6) |
365 |
933 |
14 |
10 |
20 (Mo) 80 (β-Mo2N) |
| (7) |
440 |
933 |
14 |
10 |
100 (β-Mo2N) |
| (8) |
1165 |
933 |
17 |
11 |
100 (β-Mo2N) |
2.1.1.2
XRD/elemental analysis/DRS UV-Vis.
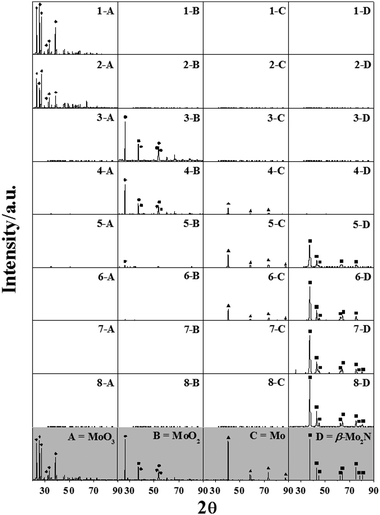
Powder XRD patterns of passivated samples (see experimental section) obtained at points 1–8 are presented in Fig. 2. It has been established previously48 that the passivation step provides a protective oxide surface layer without deeper oxidation. In order to confirm the composition of each sample, the XRD patterns were compared with commercial samples (MoO3 (A), MoO2 (B) and Mo (C)) and the JCPDS-ICDD standards for MoO3 (35-0609), MoO2 (32-0671), Mo (42-1120) and β-Mo2N (25-1368, (D)). In Fig. 2, each of the four columns represent the specific contribution at that stage of reduction and/or nitridation (1–8) due to (A) MoO3, (B) MoO2, (C) Mo and (D) β-Mo2N and serves to illustrate the evolution of the MoO3 reactant to β-Mo2N product. The diffractogram for the final product shows peaks at 37.73°, 43.14°, 45.28°, 62.67°, 64.28°, 75.48°, 78.64° and 80.54° (Fig. 2, profile 8-D), which are consistent with the (112), (200), (004), (220), (204), (312), (116) and (224) reflections of bulk β-Mo2N. This result agrees with the findings of Gong et al.13 who reported the formation of β-Mo2Nvia temperature programmed treatment of MoO3 with N2 + H2 at 923–1023 K. In contrast, Nagai and co-workers23,28 proposed that β-phase formation (from MoO3 treatment in NH3) required a higher synthesis temperature where the conversion of the (cubic) γ-phase to the β-form occurred at 1070 K (in He). A decrease in the intensity of the characteristic signals for MoO3 in Fig. 2 (comparing profiles 1-A with 2-A) suggests a transformation of the trioxide over the temperature range 298–623 K. While Ressler et al.31 have proposed a transition of MoO3 to MoO2 at 623 K, we observed no detectable signals due to (bulk) MoO2 associated with sample 2 (see profile 2-B). The sharp H2 TPR consumption peak recorded at 933 K (between samples 2 and 3, see Fig. 1(A)) can be attributed to the reduction of MoO3 to MoO2 as confirmed in profile 3-B (Fig. 2). Moreover, the amount of H2 associated with this signal matched that required for the oxide reduction (to within ±10%), confirming the sole transition of trioxide to Mo dioxide. Furthermore, the ill-defined positive peak between points 3 and 4 (Fig. 1(A)) can be linked to a partial reduction of MoO2 to Mo (Fig. 2, profile 4-C and Table 1). The latter proceeds further from stage 4 to 5 (Fig. 1(A)) where the XRD response for sample 5 shows only trace MoO2. Nitrogen consumption generated a negative TCD signal (see Fig. 1(A)) and the XRD profiles for samples 5 and 6 are consistent with the nitridation of Mo (profiles 5-D and 6-D in Fig. 2). The nitridation process is complete by stage 7, at which point there was no detectable Mo present (Fig. 2, Table 1). Moreover, elemental analysis of samples 5 and 7 revealed an increase in nitrogen content (from 2.4 ± 0.3 to 5.7 ± 0.3% w/w), which can be attributed to the progressive nitridation of Mo. Samples 7 and 8 exhibited equivalent nitrogen contents, close to that for β-Mo2N. The occurrence of a final positive signal (stage 6–8, Fig. 1(A)) can be attributed to H2 uptake on β-Mo2N.4 Our results confirm that the reaction of MoO3 with N2 + H2 follows the sequence:
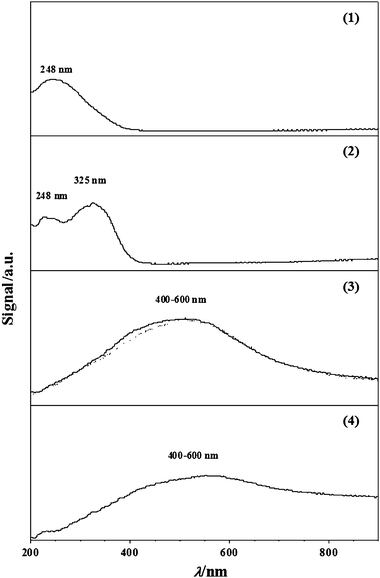
Previous studies have suggested the participation of MoO2,9,10,12,13,24MoOxHy,31,43,44Mo4O1149,50 and Mo13,24 as intermediates during the temperature programmed treatment of MoO3 to form Mo nitride. Matsuda et al.44 proposed the reduction pathway MoO3 → HxMoO3 → MoO2 for reaction at 623 K, Wise and Markel12 suggested the steps MoO3 → MoO2 → Mo at 773 K and Słoczyński51 reported MoO3 → Mo4O11 → MoO2 where T < 823 K. In order to facilitate identification of the reaction intermediates, DRS UV-Vis measurements were also conducted (see Fig. 3). Profiles 1 and 2 (representing samples 1 and 2, Fig. 1(A)) exhibit bands centred at 248 and 325 nm. We can draw on the literature52 for MoO3 where bands at 220–250 nm and 320 nm have been observed and attributed to tetrahedral Mo–O and octahedral Mo–O–Mo bridging, respectively. The appearance of the higher wavelength band (at 325 nm) in profile 2 suggests a partial transition of Mo6+ from tetrahedral to octahedral coordination, a result that is in line with findings reported by Aritani et al.53 The broad band over the 400–600 nm range for samples 3 and 4 suggests the formation of Mo5+ and/or Mo4+![[thin space (1/6-em)]](https://www.rsc.org/images/entities/char_2009.gif) 54,55 and is consistent with our TPR (Fig. 1(A)) and XRD (Fig. 2) measurements, i.e.MoO2 is produced at the final isothermal (933 K) hold (see Table 1). Indeed the UV-Vis spectrum associated with sample 3 coincides directly with that recorded for the commercial MoO2 (dotted profile). The decrease in intensity of the MoO2 signal for sample 4 (profile 4) can be attributed to a partial reduction to Mo during steps 3 and 4 (see Fig. 1(A) and 2).
54,55 and is consistent with our TPR (Fig. 1(A)) and XRD (Fig. 2) measurements, i.e.MoO2 is produced at the final isothermal (933 K) hold (see Table 1). Indeed the UV-Vis spectrum associated with sample 3 coincides directly with that recorded for the commercial MoO2 (dotted profile). The decrease in intensity of the MoO2 signal for sample 4 (profile 4) can be attributed to a partial reduction to Mo during steps 3 and 4 (see Fig. 1(A) and 2).
 |
| | Fig. 2
XRD profiles of samples 1–8 (see Fig. 1(A)) focusing on the contributions due to (A) MoO3, (B) MoO2, (C) Mo and (D) β-Mo2N. Diffractograms for model samples and peak assignment based on JCPDS-ICDD reference data are denoted by A (MoO3; Alfa Aesar, 99.9995; 35-0609, ◆), B (MoO2; Aldrich, 99%; 32-0671, ●), C (Mo; Aldrich, ≥ 99.9%; 42-1120, ▲) and D (JCPDS-ICDD β-Mo2N standard (25-1368), ■). | |
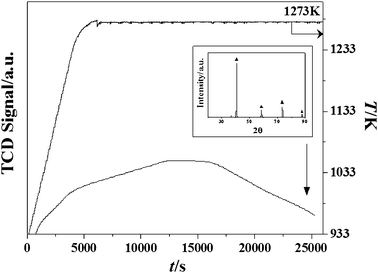 |
| | Fig. 4
TCD response for the temperature programmed treatment of β-Mo2N to 1273 K (at 5 K min−1) in He. Inset: XRD pattern for passivated product post thermal treatment. Note: peak assignments based on the JCPDS-ICDD standard for Mo (42-1120, ▲). | |
2.1.2
H2-TPD
.
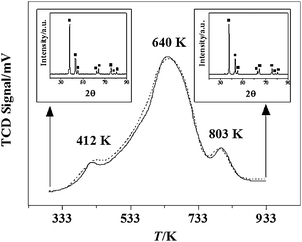
The possibility of hydrogen uptake by the nitride (Fig. 1(A), stage 6–7) has been confirmed by the H2-TPD response recorded for sample 8 and is shown in Fig. 6; the degree of reproducibility can be assessed from the repeated measurements that are presented. The profile exhibits three different stages of hydrogen release at 412 K, 640 K and 803 K, which suggests different degrees of interaction of H2 with β-Mo2N. The ability of Mo nitrides to adsorb hydrogen has been noted in the review by Furimsky4 where the reported studies have either focused on the γ-phase or did not specify the allotropic form. Guerrero-Ruiz et al.63 demonstrated the co-existence of different surface sites for hydrogen adsorption on Mo2N (with a BET area of 8 m2 g−1). Li and co-workers64 reported a dependence of hydrogen adsorption–desorption on the treatment temperature where at T > 500 K the presence of three distinct hydrogen species located on the surface, subsurface and bulk of Mo2N was proposed and discussed in terms of a dissociation (on Mo–N) and diffusion mechanism. Nitrogen removal post-H2 treatment has been reported in the literature20,65 and associated with desorption peaks at T > 823 K.66 In this study, the nitride structure was unaffected by the TPD treatment as can be evaluated from the XRD response pre- and post-TPD (see insets in Fig. 6); there was no significant change in nitrogen content post-TPD. The overall amount of H2 released was 0.71 μmol m−2, a value that is close to that reported (0.78 μmol m−2) by Liet al.67 for Mo2N, although the authors did not identify the crystallographic phase.
 |
| | Fig. 6
Hydrogen TPD response for β-Mo2N (50 K min−1 to 933 K) in Ar (dotted and solid lines represent two separate measurements). Insets: XRD patterns for samples pre- and post-TPD. Note: peak assignments based on the JCPDS-ICDD standard for β-Mo2N (25-1368, ■). | |
The observed capacity of β-Mo2N for hydrogen uptake suggests possible hydrogenation properties. We tested this in the gas phase hydrogenation of p-CNB where p-CAN was detected as the sole product. There was no evidence of aromatic ring hydrogenation or hydrogenolysis of the –Cl or –NO2 substituents. This ultra-selectivity with respect to –NO2group reduction is a significant result as the hydrogenation of p-CNB has been invariably accompanied by dechlorination and side-reactions resulting in the formation of azoxyderivates,68,69aniline70–72 and nitrobenzene.71–73 This has been a feature of reaction over Ru–Ir/γ-Al2O3,68silica supported group VIII metals (Ag, Cu, Co Fe and Ni),69PtMOx (M = Sm, Pr, Ce, Nd and La) supported on carbon nanotubes71 and unsupported NiB alloys (as nanotubes (20–25 nm)73 and nanoparticles (6–100 nm)).70,72 The variation in fractional p-CNB conversion (Xp-CNB) as a function of time-on-stream is presented (as an inset) in Fig. 7. An initial temporal decline in conversion is in evidence with a subsequent steady state at extended reaction times (>250 min). The temporal variation of conversion can be expressed in terms of the empirical relationship74| |  | (1) |
where X300min represents fractional conversion after 300 min on-stream and β is a time scale fitting parameter. Fit convergence (R2 > 0.99) yields values for X0 (initial conversion). For reactor operation under plug-flow conditions where hydrogen was maintained far in excess, the following reactor/kinetic expression applies| |  | (2) |
where k (min−1) is the pseudo-first order kinetic constant and n/F (min) has the physical meaning of contact time. The associated linear relationship (forced through the origin, see Fig. 7) serves to validate our approach and the resultant k = 2.0 min−1. This value exceeds the rate constants (0.1–0.3 min−1) that we have previously recorded (over the T range 453–523 K) for p-CNB → p-CAN promoted using Au/Al2O375,76 and Au/TiO2.76 Reaction over Pd/Al2O3 also delivered a lower rate (k = 1.5 min−1),75 albeit at a lower reaction temperature (453 K) but nitrobenzene and aniline were formed as the principal products. Moreover, catalytic nitroarene hydrogenation has typically involved batch liquid phase systems operated at elevated pressures.42,77–80 The use of β-Mo2N to promote ultra-selective continuous gas phase (atmospheric pressure) hydrogenation represents a new direction in the production of industrially important aromatic amines. It must be noted that the β-Mo2N catalytic system has not been optimized and future work will consider the role of the nitride crystallographic phase/surface area and the catalytic consequences of combining a transition metal (e.g.Au or Pd) with the nitride.
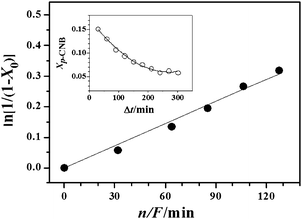 |
| | Fig. 7 Pseudo-first order kinetic plot for the hydrogenation of p-CNB over β-Mo2N; line represents fit to eqn (2). Inset: variation of p-CNB fractional conversion (Xp-CNB) with time-on-stream; n/F = 85 min; line represents fit to eqn (1). T = 493 K. | |
3. Experimental
3.1
Mo nitride synthesis
The MoO3 (99.9995% w/w) precursor was obtained from Alfa Aesar and used as received. Mo nitride synthesis was conducted in a commercial CHEM-BET 3000 (Quantachrome) unit. The precursor (0.150 g MoO3) was loaded in a U-shaped quartz cell (10 cm × 3.76 mm id) and heated in 15 cm3 min−1 (GHSV = 7 × 10³ h−1, Brooks mass flow controlled) 15% v/v N2/H2 at 5 K min−1 to 933 K. The effluent gas passed through a liquid N2 trap and changes in composition (consumption/release of H2 and/or N2) were monitored by a thermal conductivity detector (TCD) with data acquisition/manipulation using the TPR WinTM software. The reaction was quenched by switching to a He flow (15 cm3 min−1), the temperature was maintained at 933 K for 3 h and the sample was cooled to room temperature. In order to independently analyze precursor reduction, the thermal treatment of MoO3 in 15 cm3 min−1 15% v/v Ar/H2 at 5 K min−1 to 933 K was also monitored. In addition, nitride decomposition was examined by a controlled thermal treatment at 5 K min−1 in a flow (60 cm3 min−1, GHSV = 2 × 10⁴ h−1) of He to 1273 K. Samples for off-line analysis were passivated at room temperature in 1% v/v O2/He; there was no detectable temperature increase during sample passivation.
3.2 Sample characterisation
Temperature programmed desorption (TPD) and BET surface area measurements were conducted in situ in the CHEM-BET unit. After the reduction–nitridation procedure, the sample was thoroughly flushed with Ar for 30 min and a TPD in 65 cm3 min−1 Ar (GHSV = 2 × 10⁴ h−1) to 933 K (at 50 K min−1) was conducted to measure the amount of H2 released from the nitride. The BET surface area was obtained from analysis in a 30% v/v N2/He flow with ultra pure N2 (>99.99%, BOC) as the internal standard. At least two cycles of nitrogen adsorption–desorption in the flow mode were employed using the standard single point BET method. Pore volume measurements were performed using the commercial Micromeritics Flowsorb II 2300 unit. Prior to analysis, the samples were outgassed at 423 K for 1 h and the total pore volume was obtained at a relative N2 pressure of P/P0 = 0.95. BET and pore volume measurements were reproducible to within ±5%; the values quoted represent the mean. Identification of the intermediate and final products was confirmed by XRD, employing a Bruker/Siemens D500 incident X-ray diffractometer using Cu Kα radiation. The samples were scanned at a rate of 0.02° step−1 over the range 20° ≤ 2θ ≤ 90° (scan time = 5 s step−1). Diffractograms were identified by direct comparison with either commercial samples (MoO3 (Aldrich, 99%) and Mo powder (Aldrich, ≥ 99.9%)) or the JCPDS-ICDD reference standards, i.e.MoO3 (35-609), MoO2 (32-0671), Mo (42-1120) and β-Mo2N (25-1368). Diffuse reflectance UV-Vis (DRS UV-Vis) measurements were conducted using a Perkin Elmer Lambda 35 UV-Vis Spectrometer with BaSO4 powder as reference; absorption profiles were calculated from the reflectance data using the Kubelka–Munk function. Analysis by scanning electron microscopy (SEM) was carried out using a Hitachi S2700 field emission SEM unit operated at an accelerating voltage of 10 kV. The sample was deposited on a standard aluminium SEM holder and coated with gold. Elemental (nitrogen) analysis was determined using an Exeter CE-440 Elemental Analyser after sample combustion at ca. 1873 K.
3.3.1
Catalytic system.
The hydrogenation of p-CNB (Sigma-Aldrich, purity ≥ 99%) as a solution in ethanol (Sigma-Aldrich ≥ 99%) was carried out under atmospheric pressure at 493 K, in situ immediately after β-Mo2N activation, in a fixed bed vertical glass reactor (l = 450 mm; id = 15 mm). The catalytic reactor and operating conditions to ensure negligible heat/mass transport limitations have been fully described elsewhere81 but some features, pertinent to this study, are given below. A layer of borosilicate glass beads served as the preheating zone, ensuring that the organic reactant was vaporized and reached reaction temperature before contacting the catalyst. Isothermal conditions (±1 K) were maintained by diluting the catalyst bed with ground glass (75 μm); the ground glass was mixed thoroughly with catalyst before insertion in the reactor. The reaction temperature was continuously monitored using a thermocouple inserted in a thermowell within the catalyst bed. The p-CNB reactant was delivered at a fixed calibrated flow rate (F = 0.76 μmolp-CNB min−1) to the reactor via a glass/Teflon air-tight syringe and Teflon line using a microprocessor controlled infusion pump (Model 100 kd Scientific). A co-current flow of ultra pure (>99.99%, BOC) H2 (<1% v/v p-CNB in H2) was maintained at GHSV = 330 min−1; H2 content was well in excess of the stoichiometric requirement where the flow rate was monitored using a Humonics (Model 520) digital flowmeter. The molar β-Mo2N to inlet p-CNB molar feed rate (n/F) spanned the range 32–128 min. In a series of blank tests, passage of p-CNB in a stream of H2 through the empty reactor did not result in any detectable conversion. The reactor effluent was frozen in a liquid nitrogen trap for subsequent analysis. Carbon balance during the reaction was complete to better than ±4%.
3.3.2 Analytical method and activity/selectivity evaluation.
The composition of the reaction/product(s) mixture was determined using a Perkin-Elmer Auto System XL chromatograph equipped with a programmed split/splitless injector and a flame ionization detector, employing a DB-1 capillary column (id = 0.33 mm, length = 30 m, film thickness = 0.20 μm). Data acquisition and manipulation were performed using the TotalChrom Workstation Version 6.1.2 (for Windows) chromatography data system and the overall reactant/product molar fractions (xi) were obtained using detailed calibrations (not shown). Fractional hydrogenation (Xp-CNB) was obtained from| |  | (3) |
where selectivity with respect to p-chloroaniline (p-CAN) is given by| |  | (4) |
Repeated reactions with different samples from the same batch of catalysts delivered conversion/selectivity values that were reproducible to within ±7%.
4. Conclusions
We have established that the formation of β-Mo2N by temperature programmed treatment (to 933 K) of MoO3 in N2/H2 (15% v/v) occurs via a kinetically controlled stepwise reduction (MoO3 → MoO2 → Mo) and subsequent nitridation (Mo → β-Mo2N). The transformation is non-topotactic with an increase in BET (from 1 to 17 m2 g−1) and total pore volume (from 2 × 10⁻³ to 11 × 10−3 cm3 g−1). Hydrogen TPD measurements have revealed a significant hydrogen content (0.71 μmol m−2) associated with the nitride. We have demonstrated, for the first time, the catalytic action of β-Mo2N to promote the continuous gas phase hydrogenation of p-CNB where p-CAN was the sole product, i.e. 100% selective in terms of –NO2group reduction. We have recorded a hydrogenation rate constant (2.0 min−1) for β-Mo2N that is higher than those achieved with supported transition metals (Au/Al2O3, Au/TiO2 and Pd/Al2O3) under comparable reaction conditions. These findings can serve as the basis for the development of Mo2N materials as new catalysts for the cleaner production of commercially important aromatic amines with multiple applications in the fine chemical industry.
Acknowledgements
The authors are grateful to C. Burnett, R. Blackley and X. Wang for their contribution to this work, which was supported by EPSRC through Grant 0231 110525. EPSRC support for free access to the TEM/SEM facility at the University of St Andrews is also acknowledged as is financial support from the Swiss National Science Foundation.
References
- V. P. Anitha, S. Vitta and S. Major, Thin Solid Films, 1994, 245, 1–3 Search PubMed.
- K.-I. Machida, A. Nakamoto and G.-Y. Adachi, Chem. Lett., 1993, 1381–1384 Search PubMed.
- V. P. Anitha, A. Bhattacharya, N. G. Patil and S. Major, Thin Solid Films, 1993, 236, 306–310 Search PubMed.
- E. Furimsky, Appl. Catal., A, 2003, 240, 1–28 CrossRef CAS.
- E. Furimsky and F. E. Massoth, Catal. Rev. Sci. Eng., 2005, 47, 297–489 CrossRef CAS.
-
S. T. Oyama, The Chemistry of Transition Metal Carbides and Nitrides, Blackie Academic, Glasgow, 1996, pp. 14–576 Search PubMed.
- P. Ronsheim, A. Mazza and A. N. Christensen, Plasma Chem. Plasma Process., 1981, 1, 135–147 Search PubMed.
- L. Volpe and M. Boudart, J. Solid State Chem., 1985, 59, 332–347 CrossRef CAS.
- R. Kojima and K.-I. Aika, Appl. Catal., A, 2001, 219, 141–147 CrossRef CAS.
- R. N. Panda and S. Kaskel, J. Mater. Sci., 2006, 41, 2465–2470 CrossRef CAS.
- D. Mckay, J. S. J. Hargreaves and R. F. Howe, Catal. Lett., 2006, 112, 109–113 CrossRef CAS.
- R. S. Wise and E. J. Markel, J. Catal., 1994, 145, 344–355 CrossRef CAS.
- S. Gong, H. Chen, W. Li and B. Li, Appl. Catal., A, 2005, 279, 257–261 CrossRef CAS.
- A. Gomathi, A. Simdaresam and C. N. R. Rao, J. Solid State Chem., 2007, 180, 291–295 Search PubMed.
- X. Zhao and K.-J. Range, J. Alloys Compd., 2000, 296, 72–74 CrossRef CAS.
- S. L. Roberson, D. Finello and R. F. Davis, Thin Solid Films, 1998, 324, 30–36 Search PubMed.
- S. Chouzier, P. Afanasiev, M. Vrinat, T. Cseri and M. Roy-Auberger, J. Solid State Chem., 2006, 179, 3314–3323 CrossRef CAS.
- P. Afanasiev, Inorg. Chem., 2002, 41, 5317–5319 CrossRef.
- R. C. V. Mcgee, S. K. Bej and L. T. Thompson, Appl. Catal., A, 2005, 284, 139–146 CrossRef CAS.
- C. W. Colling, J.-G. Choi and L. T. Thompson, J. Catal., 1996, 160, 35–42 CrossRef CAS.
- G. S. Ranhotra, G. W. Haddix, A. T. Bell and J. A. Reimer, J. Catal., 1987, 108, 24–39 CrossRef CAS.
- S. Li, W. B. Kim and J. S. Lee, Chem. Mater., 1998, 10, 1853–1862 CrossRef CAS.
- M. Nagai, Y. Goto, A. Miyata, M. Kiyoshi, K. Hada, K. Oshikawa and S. Omi, J. Catal., 1999, 182, 292–301 CrossRef CAS.
- S. W. Gong, H. K. Chen, W. Li and B. Q. Li, Energy Fuels, 2006, 20, 1372–1376 Search PubMed.
- K. Inumaru, K. Baba and S. Yamanaka, Chem. Mater., 2005, 17, 5935–5940 CrossRef CAS.
- H. J. Lee, J.-G. Choi, C. W. Colling, M. S. Mudholkar and L. T. Thompson, Appl. Surf. Sci., 1995, 89, 121–130 CrossRef.
- M. Nagai, Appl. Catal., A, 2007, 322, 178–190 CrossRef CAS.
- M. Nagai, Y. Goto, A. Irisawa and S. Omi, J. Catal., 2000, 191, 128–137 CrossRef CAS.
- M. Nagai, Y. Goto, O. Uchino and S. Omi, Catal. Today, 1998, 45, 335–340 Search PubMed.
- T. Ressler, R. E. Jentoft, J. Wienold, M. M. Günter and O. Timpe, J. Phys. Chem. B, 2000, 104, 6360–6370 CrossRef CAS.
- T. Ressler, J. Wienold and R. E. Jentoft, Solid State Ionics, 2001, 141–142, 243–251 Search PubMed.
- J. G. Chen, Chem. Rev., 1996, 96, 1477–1498 CrossRef CAS.
- L. Volpe and M. Boudart, J. Solid State Chem., 1985, 59, 348–356 CrossRef CAS.
- Y. Li, Y. Fan, J. He, B. Xu, H. Yang, J. Miao and Y. Chen, Chem. Eng. J., 2004, 99, 213–218 Search PubMed.
- D. Liu, Y. Q. Liu, T. Zhou, C. G. Liu and G. H. Que, Abstr. Pap. Am. Chem. Soc., 2003, 226, U530 Search PubMed.
- Y. Shigehara, Nippon Kagaku Kaishi, 1977, 470–474 Search PubMed.
- M. Nagai, Y. Goto, O. Uchino and S. Omi, Catal. Today, 1998, 43, 249–259 Search PubMed.
- M. Nagai, Y. Goto, H. Ishii and S. Omi, Appl. Catal., A, 2000, 192, 189–199 Search PubMed.
- D. Mckay, J. S. J. Hargreaves, J. L. Rico, J. L. Rivera and X.-L. Sun, J. Solid State Chem., 2008, 181, 325–333 CrossRef CAS.
- G. Konnecker, A. Boehncke and S. Schmidt, Fresenius Environ. Bull., 2003, 12, 589–593 Search PubMed.
-
P. F. Vogt and J. J. Gerulis, in Ullmann's Encyclopedia of Industrial Chemistry. “Aromatic Amines”, Wiley-VCH Verlag GmbH & Co. KGaA, Weinheim, 2005, pp. 2–21 Search PubMed.
- X. D. Wang, M. H. Liang, J. L. Zhang and Y. Wang, Curr. Org. Chem., 2007, 11, 299–314 CrossRef CAS.
- P. Delporte, F. Meunier, C. Pham-Huu, P. Vennegues, M. J. Ledoux and J. Guille, Catal. Today, 1995, 23, 251–267 CrossRef CAS.
- T. Matsuda, Y. Hirata, H. Itoh, H. Sakagami and N. Takahashi, Microporous Mesoporous Mater., 2001, 42, 337–344 CrossRef CAS.
- H. Sakagami, Y. Asano, T. Ohno, N. Takahashi, H. Itoh and T. Matsuda, Appl. Catal., A, 2006, 297, 189–197 Search PubMed.
- Y.-J. Zhang, Q. Xin, I. Rodriguez-Ramos and A. Guerrero-Ruiz, Appl. Catal., A, 1999, 180, 237–245 CrossRef CAS.
- Z. B. Wei, Q. Xin, P. Grange and B. Delmon, Solid State Ionics, 1997, 101–103, 761–767 Search PubMed.
- A. de Lucas Consuegra, P. M. Patterson and M. A. Keane, Appl. Catal., B, 2006, 65, 227–239 CrossRef CAS.
- T. Ressler, J. Phys. Chem. B, 2002, 106, 7719–7720 Search PubMed.
- E. Lalik, W. I. F. David, P. Barnes and J. F. C. Turner, J. Phys. Chem. B, 2001, 105, 9153–9156 Search PubMed.
- J. Słoczyński, J. Solid State Chem., 1995, 118, 84–92 CrossRef CAS.
- G. Xiong, C. Li, Y. Feng, P. Ying, Q. Xin and J. Liu, J. Catal., 1999, 186, 234–237 CrossRef CAS.
- H. Aritani, T. Tanaka, T. Funabiki, S. Yoshida, K. Eda, N. Sotani, M. Kudo and S. Hasegawa, J. Phys. Chem., 1996, 100, 19495–19501 CrossRef CAS.
-
H. Prialiaud, in Proceeding of the Second International Conference on Chemistry and Uses of Molybdenum, Climax Molybdenum Co. Ltd., London, 1996, pp. 1–195 Search PubMed.
- K. A. Vikulov, B. N. Shelimov and V. B. Kazansky, J. Mol. Catal., 1991, 65, 393–402 CrossRef CAS.
- G. Benítez, J. M. Heras and L. Viscido, J. Phys.: Condens. Matter, 1993, 5, A221–A222 Search PubMed.
- R. Bafrali and A. T. Bell, Surf. Sci., 1992, 278, 353–363 Search PubMed.
- S. T. Oyama, Catal. Today, 1992, 15, 179–200 CrossRef CAS.
- J. S. Lee, L. Volpe, F. H. Ribeiro and M. Boudart, J. Catal., 1988, 112, 44–53 CrossRef CAS.
- J. S. Lee, S. T. Oyama and M. Boudart, J. Catal., 1987, 106, 125–133 CrossRef CAS.
- C. Bouchy, I. Schmidt, J. R. Anderson, C. J. H. Jacobsen, E. G. Derouane and S. B. D. A. Hamid, J. Mol. Catal. A: Chem., 2000, 163, 283–296 CrossRef CAS.
- W. V. Schulmeyer and H. M. Ortner, Int. J. Refract. Met. Hard Mater., 2002, 20, 261–269 Search PubMed.
- A. Guerrero-Ruiz, Q. Xin, Y. J. Zhang, A. Maroto-Valiente and I. Rodriguez-Ramos, Langmuir, 1999, 15, 4927–4929 CrossRef CAS.
- X. S. Li, Y. X. Chen, Y. J. Zhang, C. X. Ji and Q. Xin, React. Kinet. Catal. Lett., 1996, 58, 391–396 Search PubMed.
- J.-G. Choi, H. J. Lee and L. T. Thompson, Appl. Surf. Sci., 1994, 78, 299–307 Search PubMed.
- Z. Wei, Q. Xin, P. Grange and B. Delmon, J. Catal., 1997, 168, 176–182 CrossRef CAS.
- X. S. Li, Y. J. Zhang, Q. Xin, C. X. Ji, Y. F. Miao and L. Wang, React. Kinet. Catal. Lett., 1996, 57, 177–182 Search PubMed.
- Q. Xu, L. Wang, J. R. Chen, X. J. Li and R. X. Li, Chin. J. Catal., 2007, 28, 579–581 Search PubMed.
- J. Ning, J. Xu, J. Liu, H. Miao, H. Ma, C. Chen, X. Li, L. Zhou and W. Yu, Catal. Commun., 2007, 8, 1763–1766 CrossRef CAS.
- B. Zhao, C.-J. Chou and Y.-W. Chen, Ind. Eng. Chem. Res., 2010, 49, 1669–1676 Search PubMed.
- X. X. Han, J. R. Li and R. X. Zhou, Chin. Chem. Lett., 2009, 20, 96–98 Search PubMed.
- H. Li, J. Zhang and H. Li, Catal. Commun., 2007, 8, 2212–2216 Search PubMed.
- M. Mo, L. Han, J. Lv, Y. Zhu, L. Peng, X. Guo and W. Ding, Chem. Commun., 2010, 46, 2268–2270 RSC.
- F. Cárdenas-Lizana, S. Gómez-Quero and M. A. Keane, Appl. Catal., A, 2008, 334, 199–206 CrossRef CAS.
- F. Cárdenas-Lizana, S. Gómez-Quero and M. A. Keane, Catal. Commun., 2008, 9, 475–481 Search PubMed.
- F. Cárdenas-Lizana, S. Gómez-Quero and M. A. Keane, ChemSusChem, 2008, 1, 215–221 Search PubMed.
- H. U. Blaser, H. Steiner and M. Studer, ChemCatChem, 2009, 1, 210–221 Search PubMed.
- Y.-C. Liu and Y.-W. Chen, Ind. Eng. Chem. Res., 2006, 45, 2973–2980 Search PubMed.
- V. Kratky, M. Kralik, M. Mecarova, M. Stolcova, L. Zalibera and M. Hronec, Appl. Catal., A, 2002, 235, 225–231 CrossRef CAS.
- B. Coq, A. Tijani, R. Dutartre and F. Figuéras, J. Mol. Catal., 1993, 79, 253–264 CrossRef CAS.
- G. Tavoularis and M. A. Keane, J. Chem. Technol. Biotechnol., 1999, 74, 60–70 CrossRef CAS.
|
| This journal is © The Royal Society of Chemistry 2011 |
Click here to see how this site uses Cookies. View our privacy policy here. 
![[thin space (1/6-em)]](https://www.rsc.org/images/entities/char_2009.gif) 54,55 and is consistent with our TPR (Fig. 1(A)) and XRD (Fig. 2) measurements, i.e.MoO2 is produced at the final isothermal (933 K) hold (see Table 1). Indeed the UV-Vis spectrum associated with sample 3 coincides directly with that recorded for the commercial MoO2 (dotted profile). The decrease in intensity of the MoO2 signal for sample 4 (profile 4) can be attributed to a partial reduction to Mo during steps 3 and 4 (see Fig. 1(A) and 2).
54,55 and is consistent with our TPR (Fig. 1(A)) and XRD (Fig. 2) measurements, i.e.MoO2 is produced at the final isothermal (933 K) hold (see Table 1). Indeed the UV-Vis spectrum associated with sample 3 coincides directly with that recorded for the commercial MoO2 (dotted profile). The decrease in intensity of the MoO2 signal for sample 4 (profile 4) can be attributed to a partial reduction to Mo during steps 3 and 4 (see Fig. 1(A) and 2).

