Kinetic studies and modelling of the production of fructooligosaccharides by fructosyltransferase from Rhodotorula sp
Received
23rd November 2010
, Accepted 24th March 2011
First published on 18th May 2011
Abstract
Fructosyltransferase was produced by a strain of Rhodotorula, isolated from flowers collected in the costal Atlantic Forest located in Southern Brazil and screened according to its ability to produce the enzyme. The production was carried out in submerged fermentation and subsequently purified using the following three procedures: alcohol precipitation, Q-Sepharose ion-exchange chromatography and ultrafiltration. The studies of fructooligossacaride production were carried out in a batch stirred reactor using sucrose as the substrate and 5 UTF mL−1 of fructosyltransferase at pH 4.5 and 50 °C. Since the industrial application of this enzyme does not require a highly purified enzymatic solution, the enzyme kinetics were comparatively performed using both partially purified (only alcohol precipitated enzyme) and purified (using all steps specified above) enzyme. The kinetics showed a characteristic Michaelis–Menten behavior with substrate inhibition effects at high sucrose concentrations (up to 70% w/v). Additionally, glucose competitive inhibition relating to the sucrose, 1-kestose and nystose uptakes were verified. An inhibitory effect was also noticed with high concentrations of fructose (over 50%) but considered meaningless since the fructose concentration is always low in the actual medium reaction. The hydrolyzing activity over nystose was found to be significant, so it was included in the mathematical model. The initial values for the kinetic constants, Km, Vm and Ki, for each substrate were obtained, and then fine-tuned by simulations, after a parameter sensitivity analysis was carried out. The model predictions fitted well the experimental data, either for the purified or partially purified enzyme, while a different set of adjusted parameters was used in each case. Model predictions for FOS production deviated by not more than 5% in both cases, so they can be used for bioreactor designs.
1. Introduction
Fructosyltransferase is an enzyme known for its capability in catalyzing the transformation of sucrose into fructooligosaccharides (FOS), which are sugars with beneficial functional properties in the proliferation of bifidobacteria in the human colon, and classified as probiotics. This enzyme is produced in the extra and intracellular forms from different microorganisms, including Aspergillus niger, Aspergillus oryzae, Aspergillus awamori, Aureobasidium sp., Aureobasidium pullulans, Aspergillus japonicus, Aspergillus phoenicus and Arthobacter sp.1
Currently, there are different opinions about transfructosilation. Some authors, such as Chiang et al.,2 classified it as the reaction catalyzed by β-fructofuranosidase or invertase (FFase EC 3.2.1.26); others, such as Rubio et al.,3 Yun,4 Antošová and Polakovič5 and L'Hocine et al.6 classified it as a β-D-fructosyltransferase (FTase, EC 2.4.1.9) reaction. In the latter case, the enzyme shows fructosyltransferase activity at high sucrose concentrations, but at low concentrations it shows manly hydrolytic activity.
Fructooligosaccharides are produced according to the chain reaction shown below,7,8 producing the following sugars at the end of the syntheses: glucose (G), fructose (F), sucrose (GF), 1-kestose (GF2), nystose (GF3) and fructosylnystose (GF4).
| GFn + GFn → GFn−1 + GFn+1 |
The
enzyme used in this work was produced extracellularly by a yeast strain of the genus
Rhodotorula, isolated and characterized by Hernalsteens and Maugeri,
9 and was able to synthesize fructooligosaccharides with excellent yields from
sucrose. The main goal of this work was to describe a kinetic mathematical model for fructooligosaccharide synthesis using both the partially purified and the purified
enzyme, using
sucrose as substrate. The two
enzyme purification grades were used in order to estimate to what extent the contaminants can interfere with the kinetic parameters and also to verify how reliable the mathematical model can be for use in process design, in both situations, since for FOS production the
enzyme does not need to be highly purified.
2. Results and discussion
2.1 Fructooligosaccharide production
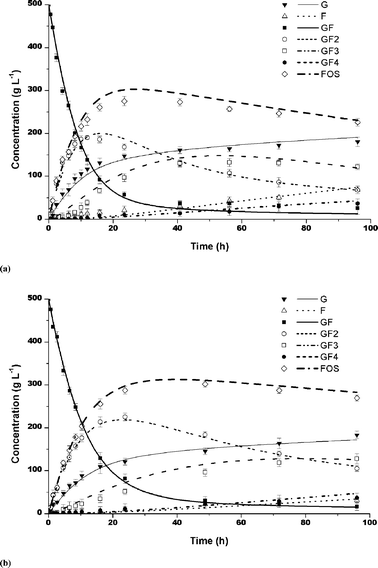
FOS was produced by both purified and partially purified samples of fructosyltransferase. In both cases, the maximum yield in FOS became independent of the sucrose concentration after 24 h of reaction, the sucrose concentrations being 50% and 70%, and enzyme activity of 5 UTF mL−1. The yields concerning the purified enzyme were about 7% higher than when the partially purified enzyme was used. They were about 57% and 50% for purified and partially purified enzymes, respectively (Fig. 1). The average compositions of the reaction mixtures were as follows: GF2 (44%), GF3 (9%) and GF4 (1.5%), for purified enzyme and GF2 (41%), GF3 (9%) and GF4 (1%) for partially purified enzyme.
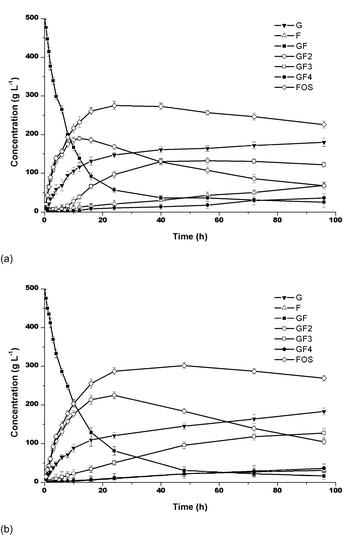 |
| | Fig. 1 FOS production at 50 °C, pH 4.5 and 50% of sucrose: (a) Partially purified and (b) Purified enzymes. Bars indicate the standard deviations. | |
In both cases, the sucrose was rapidly converted into 1-kestose and glucose. The maximum concentration of 1-kestose (GF2) was reached in 24 h. The 1-kestose produced was gradually converted into nystose (GF3). The nystose increased and was gradually transformed into fructosylnystose (GF4). The reaction time indicated that a lower sucrose concentration favored the faster reaction, producing higher GF3 concentrations (Fig. 1). According to Ballesteros et al.,10 the transferase![[thin space (1/6-em)]](https://www.rsc.org/images/entities/char_2009.gif) :hydrolase ratio and hence the maximum yield in FOS, depends basically on the sucrose concentration and the intrinsic enzyme properties. The FOS yields increases with increasing sucrose concentration. However, in this work, the yields in FOS were practically independent of the sucrose concentration.
:hydrolase ratio and hence the maximum yield in FOS, depends basically on the sucrose concentration and the intrinsic enzyme properties. The FOS yields increases with increasing sucrose concentration. However, in this work, the yields in FOS were practically independent of the sucrose concentration.
The synthesis of FOS by the purified enzyme from Rhodotorula sp. is as efficient as that reported for other enzymes. Hidaka et al.11 reported the results with Aspergillus niger to be 60% of FOS after 24 h of reaction with 50% sucrose and 6 UI. Yun,4 working with immobilized cells of Aspergillus niger and Aerobasidium pullulans, Hayashi et al.,12 using the enzyme from Aspergillus japonicus, and Yun et al.13 and Hayashi et al.14 working with the fructosyltransferase from Aspergillus pullulans, produced FOS with yields ranging from 55 to 60%. In addition, Aspergillus oryzae CFR 202 and Aspergillus pullulans CFR 77 produced 50–55% FOS,15,16 while using the immobilized mycelia of Aspergillus japonicus in gluten, allowed a maximum of about 61% of FOS to be reached. Hirayama et al.17 using Aspergillus pullulans KCCM 12017 obtained 46% of FOS using sugar cane molasses. Therefore, the results of 57% yield obtained in this work showed that the fructosyltransferase from Rhodotorula sp. has a high potential as an enzyme for FOS production.
2.2 Kinetic parameters
The effects of the initial sucrose (5 to 90% w/v), 1-kestose and nystose (5 to 35% w/v) concentrations were studied at 50 °C, pH 4.5 with an enzyme activity of 5 UTF mL−1. The enzyme kinetics fitted a characteristic Michaelis–Menten behavior with substrate inhibition, for high sucrose concentrations (higher than 70% w/v), as shown in Fig. 2. The time course reaction indicated that lower sucrose concentrations favored faster reaction times, resulting in a greater production of GF3.
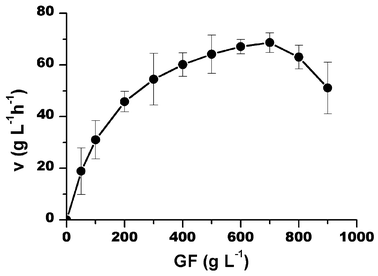 |
| | Fig. 2 Sucrose initial uptake rate as a function of substrate concentration at pH 4.5, 50 °C and 5UTF mL−1 of enzyme. Bars indicate the standard deviations. | |
The inhibitory effects of glucose and fructose were studied using concentrations from 5 to 20% (w/v), using sucrose, 1-kestose and nystose as substrates. Glucose showed a competitive inhibitory effect on sucrose, 1-kestose and nystose uptake (Fig. 3). Fructose only exhibited an inhibitory effect at concentrations above 50%, which was considered meaningless, since the fructose concentration (Fig. 3b) in the reaction mixture never reached such a high value and therefore the actual effect in the kinetics of the reaction was not considered significant. However, when the nystose concentration reached about 5% (w/v) significant hydrolytic activity was detected and this could not be neglected, so it was included in the model. Therefore, the transfructosylating reactions were substantially inhibited by glucose, mainly at the end of the synthesis reactions when there was glucose accumulation. The Km, Vmax and Ki values for each substrate were determined using the Lineweaver–Burk plot, as shown in Fig. 3.
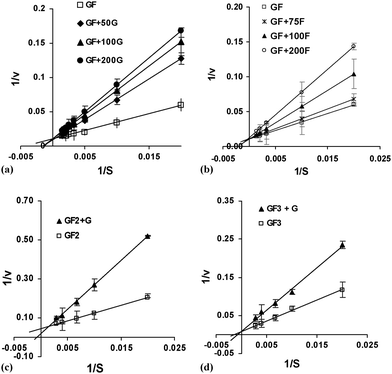 |
| | Fig. 3 Lineweaver–Burk plots for (a) sucrose as substrate with addition of glucose (50 to 200 g L−1), (b) sucrose as substrate with addition of frutose (50 to 200 g L−1), (c) 1-kestose as substrate with addition of glucose (100 g L−1) and (d) nystose as substrate with addition of glucose (100 g L−1). Bars indicate the standard deviations. | |
All estimated parameters are put together in Table 2, where it can be seen that the partially purified and purified enzymes show different behaviors, the kinetic parameters for the purified enzyme being lower for all the saturation constants, meaning greater affinity for the substrates. Additionally, a similar value for the sucrose inhibition constant was found, meaning that inhibition by sucrose is similar for both kinds of enzyme, and, interestingly, a much lower value for the nystose hydrolytic constant was found, which means that nystose is much less hydrolyzed when the synthesis is carried out with the purified enzyme, resulting in a higher conversion to FOS.
Table 1 Parametric analysis: sensitivity factor (SF) and FOSa prediction after 96 h
| Parameter |
SF |
FOS (%) |
|
Standard FOS concentration: 51.13%.
|
|
V
ms
|
0.000 |
51.13 |
|
K
ms
|
−0.003 |
51.10 |
|
K
gs
|
0.003 |
51.16 |
|
K
ss
|
−0.003 |
51.10 |
|
V
mk
|
−0.269 |
48.38 |
|
K
mk
|
0.192 |
53.09 |
|
K
gk
|
−0.139 |
49.71 |
|
V
mn
|
0.067 |
51.82 |
|
K
mn
|
−0.061 |
50.50 |
|
K
gn
|
0.036 |
51.50 |
|
V
mnh
|
−0.092 |
50.18 |
|
K
mnh
|
0.094 |
52.09 |
|
K
snh
|
0.000 |
51.12 |
| GF |
GF2 |
|
|
Exp. |
Adj |
|
Exp. |
Adj. |
|
V
ms
|
PPE |
87.8 ± 2.90 |
97.4 |
V
mk
|
PPE |
20.4 ± 1.38 |
30.3 |
|
|
PE |
|
82.6 |
|
PE |
|
18.9 |
|
K
ms
|
PPE |
187.9 ± 18.73 |
230.1 |
K
mk
|
PPE |
142.4 ± 2.34 |
185.4 |
|
|
PE |
|
220.1 |
|
PE |
|
132.4 |
|
K
gs
|
PPE |
275.0 ± 8.23 |
75.4 |
K
gk
|
PPE |
50.1 ± 2.54 |
145.2 |
|
|
PE |
|
49.9 |
|
PE |
|
60.4 |
|
K
ss
|
PPE |
785.0 ± 23.45 |
743.2 |
|
|
|
|
|
|
PE |
|
730.0 |
|
|
|
|
| GF3a |
GF3b |
|
|
|
Exp. |
Adj. |
|
|
Exp. |
Adj. |
| PPE, partially purified enzyme; PE, purified enzyme. Units for Vm [g L−1 h−1], and Km, Ki [g L−1]. GF, sucrose; GF2, 1-kestose; GF3, nystose. Transfructosylating reaction with nystose as substrate. Hydrolyzing reaction with nystose as substrate. |
|
V
mn
|
PPE |
70.0 ± 9.03 |
18.1 |
V
mnh
|
PPE |
47.0 ± 5.12 |
15.6 |
|
|
PE |
|
16.6 |
|
PE |
|
10.4 |
|
K
mn
|
PPE |
766.5 ± 24.96 |
766.4 |
K
mnh
|
PPE |
485.0 ± 18.58 |
475.3 |
|
|
PE |
|
471.5 |
|
PE |
|
445.8 |
|
K
gn
|
PPE |
104.7 ± 16.59 |
59.7 |
K
sn
|
PPE |
446.0 ± 9.76 |
255.0 |
|
|
PE |
|
48.2 |
|
PE |
|
79.0 |
Similar kinetics for fructosyltransferase with sucrose as substrate have been reported, using enzymes from other microorganisms, such as that reported by Duan et al.8 for the enzyme from Aspergillus japonicus, whose Vmax values were 41.3, 30.7 and 11.7 g L−1 h, Km were 93.4, 349.5 and 338.4 g L−1, the glucose inhibition constants being 23.6, 35.3 and 10.3 g L−1 for GF, GF2 and GF3, respectively, and the hydrolytic constants being 428.9 g L−1 for Km and 5.8 g L−1 h for the Vmax. When the enzyme from Rhodotorula sp. is compared to that from Aspergillus japonicus, the first one has lower saturation constant concerning the GF2 production and higher saturation constants related to GF consumption and GF3 production. On the other hand, the enzyme from Aureobasidium pullulans7 showed different kinetic behavior, since it is not affected by substrate inhibition. Some other studies can be found in the literature concerning the kinetics of fructosyltransferase, but they are partial studies with no information about the possible effects of all the different components in the reaction mixture, such as the studies using the enzyme from Aureobasidium pullulans,7Aspergillus niger,6A. pullulans,18A. niger ATCC 20611,17 and Aureobasidium sp.15
2.3 Mathematical modelling
The fructooligosaccharides are produced according to the chain reaction shown below:7,8The mathematical model was proposed based on the above reactions and on the kinetics observed in the production of fructooligosaccharides from sucrose.
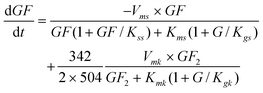
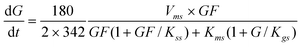
According to the above mechanism (eqn (1)), 2 moles of GF produce 1 mol of GF2 and 1 mol of G. Including the inhibition by the substrate and competitive inhibition by glucose the sucrose uptake rate can be represented by eqn (5).
| |  | (5) |
The
glucose production rate is according to
eqn (6).
| |  | (6) |
The GF
2 production rate includes G inhibition, where GF
2 is produced by the transfructosylating reaction of two molecules of GF (
eqn (1)), the transfructosylating reaction of two molecules of GF
3 (
eqn (3)) and the
hydrolysis of GF
3 (
eqn (4)), and transformed into GF
3 and GF (
eqn (2)).
| | 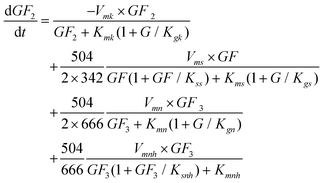 | (7) |
The GF
3 production rate is given by the transfructosylating reaction of two molecules of GF
2 (
eqn (2)), the consumption of GF
3 by the transfructosylating reaction to form GF
2 and GF
4 (
eqn (3)), less its own
hydrolysis (
eqn (4)), all of these reactions being inhibited by G.
| | 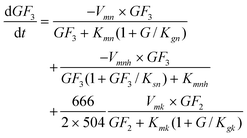 | (8) |
The GF
4 production rate is according to
eqn (3), where 2 moles of GF
3 produce 1 mol of GF
4 and 1 mol of GF
2, resulting in
eqn (9).
| | 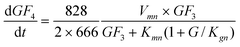 | (9) |
The production rate of F (
eqn (10)) is according to
reaction (4), where one mol of GF
3 gives one mol of GF
2 and F.
| |  | (10) |
In the above equations the
glucose inhibition constants for each substrate are included, as well as the conversion factors represented by the molecular weight of each substrate. Therefore, the model was described by six ordinary differential equations.
2.4 Parametric sensitivity analysis
The first attempt to compare the experimental data with data from the mathematical model described by eqn (5)–(10), using the parameters experimentally determined, showed poor fitting. Therefore, a fine tuning of the parameters had to be done, and this was accomplished on the basis of a parametric sensitivity study. The sensitivity of a system refers to a change in output variable that can be attributed to a change in one of the parameters of the system. As one measure, the sensitivity has a very significant contribution, because it allows the evaluation of changes in the output of the system. In order to check the influence of the process variables of the synthesis of FOS, the sensitivity factor as given by eqn (11) was used,19 where Vout is the output variable (FOS production), Vin is the input variable (kinetic parameters), the subscript r is the standard reference condition and the c is the changed condition. Data from the sensitivity factor can be interpreted as the percentage change in output variable for 1% change in the input variables. This factor represents the gain (SF positive) or loss (SF negative). The response or output variable was given by the total production of FOS.| |  | (11) |
In this study we investigated all the parameters with a change of 25% in the input variables. The model equations were simultaneously integrated using the SIMULINK of MATLAB software. Table 1 shows the responses obtained in terms of percentage of FOS and their sensitivity factors for the variables under study. It can be seen that the most relevant parameters are Vmk, Kmk and Kgk, which led to higher SF values. Relatively less influential but still relevant are the parameters Vmn, Kmn, Kgn, Vmnh and Kmnh. Therefore, focus should be put on these parameters in order to accomplish the parameter fine tuning with success. The remaining parameters Vms, Kms, Kgs,Kss and Ksnh show very low SF values and can be considered as not significant with respect to the parameter fitting.
2.5 Fine-tuning of the kinetic parameters
The model was again integrated using the SIMULINK of MATLAB software, however using this time the Parameter Estimation from its library for the fine-tuning of the kinetic parameters. The new parameters values are shown in the Table 2, together with experimental ones, for purified and partially purified enzyme. As can be observed, some kinetic parameters were significantly changed. Constants Vmn, Vmnh, Kgn, Ksn decreased significantly and were important in the production rate of GF3, GF4 and F. For constants Kgs and Kgn, they also changed significantly due to its influence in the production rate of G and GF3, respectively. On the other hand, Vms and Ksn showed no significant influence in the final FOS concentration, however they significantly affected the consumption rate of GF, and therefore they changed as well. The parameters Kms, Kss, Kmk, Kmn and Kmnh changed also, but more slightly. If the kinetics parameters from Table 2 are compared, it can be noticed that practically all parameters changed, some of them a great deal, while others slightly, in spite of results from the parametric sensitivity, which signaled that some of them could stay the same. This can be explained by the fact that the variable response used in this process was the final concentration of total FOS, which may have not represented the actual changes in the reaction kinetics. Therefore, another response variable, for example the correlation coefficient for each curve, could be more suitable and give more confident results. However, the final result is acceptable in terms of data fitting and deviation, as it can be seen in the validation step below.
The model predictions for sucrose concentrations from 50% and 70% (w/v) were compared to the experimental data for partially purified and purified enzymes. The data in Table 3 indicate that the model fitted better the experimental data for sucrose 50%, with deviations of about 4% with respect to the total amount of FOS, after 96 h. The results showed correlation coefficient (R) values higher than 0.97 for the both partially purified and purified enzymes. The model predictions and experimental data for both enzymes, with sucrose concentrations of 50 and 70%, are plotted in Fig. 4 and 5. It can be seen that the model predictions for sucrose conversion and FOS production, including GF2, GF3, GF4, GF, G and F can be considered satisfactory, showing that the mathematical model can be considered as a valid tool for the prediction and design of a FOS production process, either with purified or unpurified fructosyltransferase.
| |
Experimental |
Model predictions |
| PPE |
PE |
PPE |
REDppe |
PE |
REDpe |
| PPE, partially purified enzyme; PE, purified enzyme. GF, sucrose; GF2, 1-kestose; GF3, nystose; GF4, fructosylnystose. RED, relative error deviation between experimental data and model predictions, (%). |
| 50% GF |
|
|
|
|
|
|
| GF2 |
13.56 ± 1.6 |
21.98 ± 1.4 |
13.60 |
0.29 |
23.35 |
2.51 |
| GF3 |
24.39 ± 1.4 |
24.51 ± 2.4 |
23.91 |
1.97 |
24.77 |
5.68 |
| GF4 |
7.23 ± 2.2 |
8.34 ± 2.2 |
8.50 |
17.56 |
8.75 |
13.78 |
| FOS |
45.18 ± 1.4 |
54.83 ± 1.4 |
46.01 |
1.83 |
56.87 |
5.77 |
| 70% GF |
| GF2 |
17.08 ± 2.4 |
26.30 ± 1.6 |
16.65 |
6.23 |
27.86 |
5.93 |
| GF3 |
28.14 ± 1.8 |
24.00 ± 1.8 |
26.54 |
1.06 |
25.40 |
5.83 |
| GF4 |
7.40 ± 2.6 |
5.68 ± 2.4 |
6.38 |
3.91 |
6.40 |
12.67 |
| FOS |
52.601 ± 1.8 |
55.98 ± 1.4 |
49.57 |
3.72 |
58.33 |
4.19 |
 |
| | Fig. 4 Model predictions (lines) and experimental data (average of data in triplicate) (symbols), for 500 g L−1 sucrose (50 °C, pH 4.5) using: (a) partially purified and (b) purified fructosyltransferase. Bars indicate the standard deviations. | |
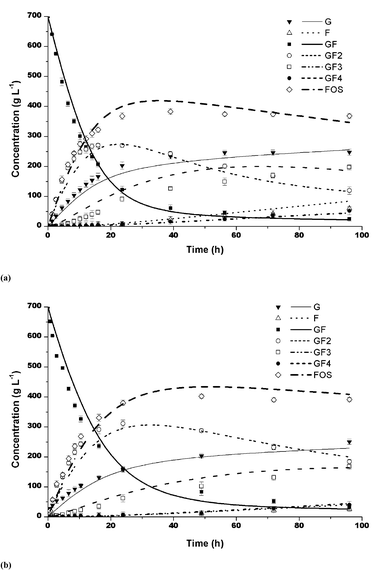 |
| | Fig. 5 Model predictions (lines) and experimental data (average of data in triplicate) (symbols), for 700 g L−1 sucrose (50 °C, pH 4.5) using: (a) partially purified and (b) purified fructosyltransferase. Bars indicate the standard deviations. | |
3. Material and methods
3.1 Microorganism and cultivation conditions
Rhodotorula sp. was isolated from the Atlantic Forest in Southern Brazil and screened by Hernalteens and Maugeri9 and maintained at the Laboratory of Bioprocess Engineering-UNICAMP-Brazil, on GYMP agar medium at 4 °C. The same medium used for both the inoculum and for enzyme production. The standard medium, consisting of: 50 g L−1 sucrose, 20 g L−1 yeast extract, 10 g L−1 NaNO3, 0.5 g L−1 MgSO4·7H2O and 5 g L−1 K2HPO4 (pH 4.5). The inoculum was incubated at 30 °C and 150 rpm for 24 h. The enzyme production was carried out with a culture medium consisting of a quantity of molasses performing 60 g L−1 of reducing sugars and 70 g L−1 of corn step liquor, both previously pretreated as follows: 4% (w/v) of active charcoal was added to the mixture and stirred for 10 min, at 150 rpm and 60 °C. The suspension was then centrifuged at 6000 × g, at 5 °C, for 10 min;20 solids were discarded and the clarified supernatant liquid used as the fermentation medium. The fermentations were performed without pH control, with 1.5 VVM aeration, at 30 °C and 650 rpm for 36 h, in a three-liter BioFlo III (New Brunswick Scientific-Edison N.J., USA) fermenter. After cultivation, the cells were separated by centrifugation (6000 × g, 5 °C and 10 min), discarded, and the cell-free extract solution used as the enzyme source. The enzyme was recovered as follows: ethanol was added to the supernatant solution at −20 °C up to a final concentration of 70% (v/v), in a magnetic stirred reactor at 2 °C, with mild agitation. The precipitate was centrifuged (6000 × g, 5 °C and 10 min), recovered and re-dissolved in sodium acetate buffer (0.05 M, pH 4.5), and stored at −20 °C as partially purified enzyme (PPE).
The above recovered and redissolved enzyme solution was applied to an anionic column (HiLoad™ 16/10 Q-Sepharose® Fast Flow—Pharmacia Biotech) and equilibrated with 50 mM sodium acetate buffer (pH 5.5). The non-adsorbed proteins were eluted with the starting buffer and the adsorbed protein enzyme eluted with a linear gradient of NaCl (0 to 1 M), in the same buffer, at a feed flow rate of 1 mL min−1. Active fractions were concentrated by ultrafiltration on Centricon YM-30 (Amicon, Millipore), according to Hernalteens and Maugeri9 and stored at −20 °C, as purified enzyme (PE).
The reaction medium used to determine enzyme activity consisted of 50% (w/v) sucrose (in 50 mM sodium acetate buffer, pH 4.5) and 10% (v/v) of adequately diluted enzyme solution at 50 °C. Samples were collected at regular time intervals during 30 min of reaction time, and used to quantify glucose with commercial glucose-oxidase kits (Laborlab, Guarulhos/SP/Brazil) and reducing sugars by the Somogi–Nelson method.21,22
Sucrose conversion by fructofuranosidase yields glucose and fructose, however when a transfructosylating activity is effective, part of the fructose is used to build a fructan polymer. By measuring the amounts of glucose and reducing sugars released into the reaction medium, the hydrolytic and transfructosylating activities can thus be assessed.23 The equation below allows the determination of the activities by estimating glucose (G) and reducing sugars (RS) in the reaction media (F: fructose, FT: transferred fructose):
| RS = F + G and F = RS − G |
However
so
Thus the activity (μmol min
−1) was calculated as:
and
where
UF is the hydrolytic activity and U
TF is the transfructosylating activity. One unit of fructofuranosidase activity (
FA) is defined as the amount of
enzyme required to hydrolyse 1 μmol of
sucrose per minute. One unit of transfructosylating activity (FTA) is defined as the amount of
enzyme required to transfer 1 μmol of
fructose (F
T) per minute.
3.4 Determination of the kinetic parameters
The kinetic parameters were determined in duplicate at 50 °C by means of the initial reaction rate procedures. Sucrose (5 to 90%, w/v), 1-kestose and nystose (5 to 35% w/v) and enzyme (5 UTF mL−1) were incubated in sodium acetate buffer (pH 4.5). Samples were taken and the enzyme was inactivated by heating in boiling water for 5 min and the sugars analyzed by HPLC-PAD DIONEX (USA) System DX-500 to determine the amounts of glucose, fructose, GF2, GF3 and GF4.
3.5 Fructooligosaccharide production
The assays were carried out in triplicate using sucrose (5 to 70% w/v), at 50 °C, in 50 mM sodium acetate buffer, pH 4.5 and 5 UTF mL−1 of enzyme. Samples were taken at regular intervals and the enzyme inactivated by heating for 5 min in boiling water, and then analyzed using the HPLC-PAD DIONEX System DX-500, with a Carbopac PA-100 column equilibrated with 50 mM NaOH, and eluted with a linear gradient (0–30%) of 500 mM sodium acetate in 50 mM NaOH (1 mL min−1). The standards kestose, nystose and fructofuranosyl–nystose were purchased from Wako Dako Industries (USA), and glucose, fructose and sucrose from Merck (Brazil).
4. Conclusion
The fructosyltransferase of Rhodotorula sp., in the purified and partially purified forms, was used for the production of fructoologosaccharides. The purified form of the enzyme yielded about 57% of FOS, after 24 h of synthesis, higher than the yield obtained with partially purified enzyme, which was about 50%, for sucrose concentrations of 50 and 70% (w/v). The higher yield of the purified enzyme was attributed to contaminant enzymes in the partially purified enzyme, probably an enzyme with hydrolytic activity, such as β-fructofuranosidase, which increased GF3 hydrolysis, increasing the fructose production. The kinetic studies showed that there is a substrate inhibition for high sucrose concentration (higher than 70%) and glucose competitive inhibition. Competitive inhibition by glucose was also found in 1-kestose and nystose uptakes, and, in addition, it was shown that there is hydrolytic activity over nystose. The purified enzyme was more efficient than the partially purified one, and this was reflected in the kinetic constants. However, as far as modelling is concerned, there were no significant differences in the prediction of FOS production, either with purified or partially purified enzyme. Therefore, the mathematical model can be used for both enzyme conditions, when parameters are found accordingly, and can be considered predictive and a valid tool for the design of a FOS production bioreactor.
Nomenclature
| F | fructose concentration (g L−1) |
| SF | sensitivity factor |
| G | glucose concentration (g L−1) |
| GF | sucrose concentration (g L−1) |
| GF2 | 1-kestose concentration (g L−1) |
| GF3 | nystose concentration (g L−1) |
| GF4 | fructosylnystose concentration (g L−1) |
|
K
gk
| glucose competitive inhibition constant for 1-kestose uptake (g L−1) |
|
K
gn
| glucose competitive inhibition constant for nystose uptake (g L−1) |
|
K
gs
| glucose competitive inhibition constant for sucrose uptake (g L−1) |
|
K
mk
| 1-kestose saturation constant (g L−1) |
|
K
mn
| nystose saturation constant (g L−1) |
|
K
mnh
| nystose saturation constant for the hydrolyzing activity (g L−1) |
|
K
ms
| sucrose saturation constant (g L−1) |
|
K
snh
| inhibition constant of the hydrolyzing activity over nystose (g L−1) |
|
K
ss
| sucrose uptake inhibition constant (g L−1) |
|
V
in
| input variable |
|
V
mk
| 1-kestose maximum uptake rate for transfructosylating activity (g L−1 h) |
|
V
mn
| nystose maximum uptake rate for transfructosylating activity (g L−1 h) |
|
V
mnh
| nystose maximum uptake rate for hydrolyzing activity (g L−1 h) |
|
V
ms
| sucrose maximum uptake rate (g L−1 h) |
|
V
out
| output variable |
Subscript
|
c
| changed condition |
|
r
| standard condition |
Acknowledgements
This study was supported by the Fundação de Amparo à Pesquisa do Estado de São Paulo (FAPESP).
References
- M. Hidaka, T. Eida, T. Takizawa, T. Tokunaga and Y. Tashiro, Bifidobacterium Microflora, 1986, 5, 37–50 Search PubMed.
- C. J. Chiang, W. C. Lee, D. C. Sheu and K. J. Duan, Biotechnol. Prog., 1997, 13, 557–582 Search PubMed.
- M. C. Rubio, R. Runco and A. R. Navarro, Phytochemistry, 2002, 61, 605–609 Search PubMed.
- J. W. Yun, Enzyme Microb. Technol., 1996, 19, 107–117 CrossRef CAS.
- M. Antošová and M. Polakovič, Chem Papers-Chemicke Zvesti, 2001, 55, 350–358 Search PubMed.
- L. L'Hocine, Z. Wang, B. Jiang and S. Xu, J. Biotechnol., 2000, 81, 73–84 Search PubMed.
- K. H. Jung, J. W. Yun, K. R. Kang and J. Y. Lim, Enzyme Microb. Technol., 1989, 11, 491–494 Search PubMed.
- K. J. Duan, J. S. Chen and D. C. Sheu, Enzyme Microb. Technol., 1994, 16, 334–339 Search PubMed.
- S. Hernalsteens and F. Maugeri, Appl. Microbiol. Biotechnol., 2008, 79, 589–596 Search PubMed.
-
A. Ballesteros, F. J. Plou, M. Alcalde, M. Ferrer, H. García-Arellano, D. Reyes-Duarte and I. Ghazi, in Enzymatic synthesis of sugar esters and oligosaccharides from renewable resources, CRC Press, New York, 2006, pp. 465–490 Search PubMed.
- H. Hidaka, M. Hirayama and N. A. Sumi, Agric. Biol. Chem., 1988, 52, 1181–1187 Search PubMed.
- S. Hayashi, T. Hayashi, J. Kinoshita, Y. Takasaki and K. Imada, J. Ind. Microbiol., 1992, 9, 247–250 Search PubMed.
- J. W. Yun, K. H. Jung, J. W. Oh and J. H. Lee, Appl. Biochem. Biotechnol., 1990, 24–25, 299–308 Search PubMed.
- S. Hayashi, J. Kinoshita, M. Nonoguchi, Y. Takasaki and K. Imada, Biotechnol. Lett., 1991, 13, 395–398 Search PubMed.
- P. T. Sangeetha, M. N. Ramesh and S. G. Prapulla, Appl. Microbiol. Biotechnol., 2004, 65, 530–537 Search PubMed.
- C. S. Chien, W. C. Lee and T. J. Lin, Enzyme Microb. Technol., 2001, 29, 252–257 Search PubMed.
- M. Hirayama, N. Sumi and H. Hidaka, Agric. Biol. Chem., 1989, 53, 667–673 Search PubMed.
- J. Yoshikawa, S. Amachi, H. Shinoyama and T. Fuji, J. Biosci. Bioeng., 2007, 103, 491–493 Search PubMed.
-
C. Burket, PhD Thesis, Universidade Estadual de Campinas, 2003 Search PubMed.
-
G. L. Mendes, Msc Thesis, Universidade Estadual de Campinas, 2006 Search PubMed.
- M. A. Somogyi, J. Biol. Chem., 1945, 160, 61–68 Search PubMed.
- N. Nelson, J. Biol. Chem., 1944, 153, 375–380 CAS.
- W. C. Chen and C. H. Lui, Enzyme Microb. Technol., 1996, 18, 153–160 Search PubMed.
|
| This journal is © The Royal Society of Chemistry 2011 |
Click here to see how this site uses Cookies. View our privacy policy here.