Evanescent wave cavity-based spectroscopic techniques as probes of interfacial processes
Mathias
Schnippering
a,
Simon R. T.
Neil
b,
Stuart R.
Mackenzie
*b and
Patrick R.
Unwin
*a
aDepartment of Chemistry, University of Warwick, Gibbet Hill Road, Coventry, CV4 7AL, UK. E-mail: p.r.unwin@warwick.ac.uk
bDepartment of Chemistry, University of Oxford, Physical and Theoretical Chemistry Laboratory, South Parks Road, Oxford, OX1 3QZ, UK. E-mail: stuart.mackenzie@chem.ox.ac.uk
First published on 30th September 2010
Abstract
Evanescent wave cavity ring-down spectroscopy (EW-CRDS) is a surface sensitive technique, which allows optical absorption measurements at interfaces with good time resolution. In EW-CRDS, a pulsed or modulated laser beam is coupled into an optical cavity which consists of at least one optical element, such as a silica prism, at the surface of which the beam undergoes total internal reflection (TIR). At the position of TIR, an evanescent field is established whose amplitude decays exponentially with distance from the boundary. This evanescent field can be exploited to investigate interfacial properties and processes such as adsorption and surface reactions, with most applications hitherto focusing on solid/liquid and solid/air interfaces. As highlighted herein, EW-CRDS is particularly powerful for investigations of interfacial processes when combined with other techniques such as basic electrochemical measurements and microfluidic or hydrodynamic techniques. In this tutorial review, the basic elements of EW-CRDS will be introduced and the relative merits of different configurations for EW-CRDS discussed, along with various aspects of instrumentation and design. The type of information which may be obtained using EW-CRDS is illustrated with a focus on recent examples such as molecular adsorption/desorption, deposition/dissolution of nanostructures and interfacial redox reactions. The comparatively new, but complementary, cavity technique of EW-broadband cavity enhanced absorption spectroscopy (EW-BB-CEAS) is also introduced and its advantages compared with EW-CRDS are discussed. Finally, future developments and trends in EW-cavity based spectroscopy are predicted. Notably, the potential for extending the technique to probe other interfaces is exemplified with a discussion of initial interfacial absorbance measurements at a water–air interface.
 Mathias Schnippering | Dr Mathias Schnippering obtained his MSc degree from the University of Bern in 2006 under the supervision of Dr David J. Fermín where his project was focused on synthesis and characterisation of 2D Ag nanoparticle arrays. His PhD project, co-supervised by Prof. Patrick Unwin at the University of Warwick and Dr Stuart Mackenzie of the University of Oxford, involved applying EW-CRDS to interfacial electrochemical processes. He currently works with Prof. Christofer Hierold in the Micro- and Nanosystems group at the Swiss Federal Institute of Technology Zurich where, in collaboration with spin-off company greenTEG, he develops thermoelectric generators based on electrochemical deposition. |
 Simon R. T. Neil and Stuart R. Mackenzie | Simon R. T. Neil (left) received his MChem degree from the University of Leicester. His final year project, with Dr Stephen Ball, ignited an interest in spectroscopy using optical cavities and in 2008 he joined the group of Dr Stuart Mackenzie at the University of Oxford where he is currently completing a DPhil degree. His research project involves the development of novel cavity-based spectroscopic techniques for the study of dynamical interfacial phenomena. Born in Durham, England, Stuart Mackenzie (right) graduated from Leeds University with a BSc in Chemistry and Physics and then completed a DPhil at Oxford with Prof. Tim Softley. Following Postdoctoral Fellowships in Boulder, USA (with Prof. David Nesbitt) and back in Oxford, he took up University Lectureships at Warwick (1999–2006) and then Cambridge (2006–2008). In 2008 he returned to Oxford to take up his current position as Lecturer in Physical and Theoretical Chemistry and Tutorial Fellow of Magdalen College. His research interests include the spectroscopy and reactivity of isolated gas-phase metal clusters and the development of novel techniques for studying dynamical interfacial phenomena. |
 Patrick R. Unwin | Patrick Unwin was born in Yorkshire in 1964 and is a graduate of the University of Liverpool (BSc, 1985), University of Oxford (MA, DPhil 1989) and University of Warwick (DSc, 2008). Following a Junior Research Fellowship at Balliol College and a NATO Fellowship at the University of Texas at Austin, Patrick joined the University of Warwick in 1992 and is now Professor (since 1998) and Director of the Warwick Centre for Analytical Science (since 2008). His research interests lie in the development of new experimental techniques for probing physicochemical phenomena at interfaces, spanning chemistry, the life sciences and materials science. He is a past winner of the Marlow Medal and Corday-Morgan Medal of the RSC and is currently an ERC Advanced Investigator. |
1. Introduction and principles of cavity-based spectroscopy
This tutorial review provides an introduction to evanescent wave cavity-based spectroscopic techniques and their applications in interfacial science. The methods discussed all benefit from the same principle, namely that by comparison with single-pass direct absorption methods, large gains in sensitivity may be achieved by realising multiple passes through a sample. In practice this involves placing the sample within a high finesse optical cavity, typically formed from two highly reflective mirrors. Evanescent wave variants of cavity ring-down spectroscopy (EW-CRDS) have been used to investigate dynamical interfacial processes with high sensitivity and good time resolution. As highlighted herein, a variety of functionalised surfaces can be studied and applications to date already encompass biomimetic models and nanostructured materials.This review is designed to highlight, for the newcomer to the field, the essential features of simple cavity-based techniques and then to illustrate the advantages of the method through practical examples. We begin, in Section 1, with an overview of the basic principles of cavity ring-down spectroscopy, and then introduce some common cavity geometries implementing the EW configuration and discuss the instrumental requirements to be considered. In Section 2, we review applications of EW-CRDS reported in the literature. Section 3 discusses the related technique of cavity enhanced absorption spectroscopy (CEAS) which we believe, when used in its broadband form, will find increasing application in interfacial science. Finally, we look to future developments in the field and demonstrate the ability of EW cavity-based techniques to make sensitive absorbance measurements at a water–air interface.
1.1 Gas-phase cavity ring-down spectroscopy
To understand the principles of CRDS and to place recent developments in EW-CRDS in a broader context, it is useful to first briefly consider early gas-phase CRDS studies. Introduced in 1988 by O'Keefe and Deacon,1CRDS has proved to be a powerful technique for trace analysis2 and spectroscopic studies of molecules and clusters as discussed in several excellent recent reviews.3–6 The extended optical path length is a major factor responsible for the exceptionally high sensitivity of CRDS and is typically achieved by multiple roundtrips of light trapped between two mirrors forming an optical cavity.In CRDS, light is injected into the cavity and the temporal decay in the light intensity circulating in the cavity is measured (see Fig. 1). Intracavity losses (due to transmission through the mirrors and/or any absorbing or scattering species within the cavity) result in an exponential decay whose time constant reflects the total per pass loss. The intensity of the light exiting the cavity, I(t), obeys the Beer–Lambert law and depends on the reflectivity of the mirrors, R, the length of the cavity, L, and length, l, over which the sample is present (in the gas phase this is often equivalent to L). For a simple two-mirror cavity, as shown in Fig. 1, the relationship is:
 | (1) |
 | (2) |
 | (3) |
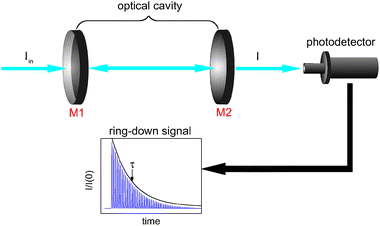 | ||
| Fig. 1 Schematic of a (linear) Fabry–Perot cavity. A light pulse, intensity Iin, enters the cavity from the left through mirror M1. The light intensity transmitted through the output mirror (M2) is measured with a photodetector. The light intensity decays exponentially from an initial value, I(0), and its temporal profile (ring-down, characterised by a decay constant, τ) is usually observed as a smoothed single exponential curve that envelops an unresolved pulse train. | ||
There are several varieties of the simple linear cavity arrangement (Fig. 1), the properties of which depend on the radii of curvature of the two mirrors (R1 and R2) and the cavity length (L). Optical cavities are said to be stable if light is refocused within the cavity after successive reflections from the mirrors, so that it becomes trapped. To achieve this, practical cavities have at least one concave element and a selection of common geometries is summarised in Table 1.
| Condition | Optical cavity |
|---|---|
| R 1 = R2 = L | Confocal |
| R 1 = R2 = L/2 | Concentric |
| R 1 = R2 ≫ L | Long-radius |
| R 1 = LR2 = ∞ | Hemispherical |
| R 1 = 2LR2 = ∞ | Semi-confocal |
| R 1 = R2 = ∞ | Fabry–Perot |
Whilst the large increase in effective path length and insensitivity to intensity fluctuations are the major advantages of CRDS over other absorption spectroscopic techniques, it has additional benefits too. Optical resonators are stable and less sensitive to minor changes of the path length or temperature fluctuations. Further, as is clear from eqn (3), by measuring the ring-down times in the presence and absence of the absorber, absolute absorbance values are obtained in a simple and direct way.
1.2 Condensed-phase cavity ring-down spectroscopy
Compared with the gas-phase, any implementation of CRDS in the condensed phase must contend with higher solvent extinctions and this has led to a range of novel cavity designs beyond that described above. As absorptive and scattering losses within any solvent also increase linearly with path length it is no longer clear that additional path length should lead to sensitivity gains. Advances in condensed phase CRDS have, accordingly, been slow in comparison with the gas phase but still offer significant advantages in applications where absorbances are weak. The evanescent wave (EW) variant of CRDS was one of the earliest attempts to harness the power of CRDS to study condensed phase and interfacial phenomena. EW-CRDS and related techniques are the subject of the remainder of this tutorial review but it is first worth highlighting other condensed phase applications in passing. For the interested reader, Vallance has provided an excellent review of general CRDS-based techniques, including a discussion of several of the variants outlined below.7Several early manifestations of condensed-phase CRDS involved coating the cavity mirrors or intra-cavity elements with thin films of interest. Engeln et al., studied solid C60 films on transparent ZnSe windows using the far infrared radiation of a free electron laser8 while Kleine et al. coated the cavity mirrors directly with molecular films of iodine.9 These techniques have been developed by several other groups for applications as diverse as structural determination of sub-monolayer dye films,10 the study of defects in amorphous silicon films11 and UHV studies of deposited metal clusters.12 In many of these variants, placing the intra-cavity elements at Brewster's angle significantly reduced reflection losses thereby enhancing sensitivity.
Conceptually, the simplest liquid-phase implementation of CRDS is achieved by filling the cavity with the liquid analyte. Pioneered by Zare and co-workers13 this approach has been applied to trace detection, solution reaction kinetics,14,15 and eluent detection in liquid chromatography (LC).16 In such studies, the presence of the solvent does not appear to interfere with the high-reflectivity mirrors needed for CRDS or significantly alter their performance. Of course, it is important to ensure that any solvent itself has negligible extinction in the region of interest as these will scale linearly with the increased path length. Where solvent absorption is a problem, the use of intra-cavity absorption cells offers a compromise solution. The first use of a Brewster's angle intra-cavity cell was by Xu et al. in their overtone study of liquid benzene.17 Since then, custom built cells have been developed in which every surface is presented at Brewster's angle to the cavity axis and which offer much improved sensitivity to UV-visible spectroscopy in the detection of components separated by high performance (HP)LC.18 It is also possible to perform liquid studies without any cell at all, as Alexander demonstrated with a novel “cell-free” liquid CRDS geometry making use of flowing liquid sheets.19 The condensed phase CRDS variants described above employ optical cavities based on highly reflective mirrors, but the use of simple optical fibers is also possible.20
1.3 Evanescent wave-cavity ring-down spectroscopy
One of the most successful applications of CRDS outside the gas-phase relies, like attenuated total internal reflection spectroscopy (ATR),21 on the evanescent field established when light undergoes total internal reflection (TIR) at the interface with an optically less dense medium. To achieve TIR, the angle of incidence (measured from the normal to the interface) must exceed the critical angle defined by the refractive indices n1 and n2 of the two media (see Fig. 2); | (4) |
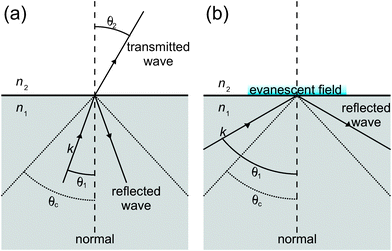 | ||
| Fig. 2 An interface consisting of two media with refractive indices n2 < n1. If the angle of incidence is smaller than the critical angle, θc, the incoming electromagnetic wave k is both reflected and transmitted at the interface (a). If the angle of incidence is larger than the critical angle, then the wave is totally internal reflected, generating an evanescent field (b). | ||
If a cavity can be constructed incorporating TIR at a suitable interface, then any light circulating within that cavity will be sensitive to absorptive or scattering losses within the evanescent field, the intensity of which decays exponentially beyond the interface (into the optically less dense medium, n2) by a distance characterised by the penetration depth,
 | (5) |
 as θ approaches π/2. Depending on the wavelength of the source, the difference of the refractive indices of the two media and the angle of incidence, the penetration depth typically ranges from 50–500 nm. Of course the total depth of sample probed in EW-CRDS is significantly greater than dp. In EW-CRDS, as in ATR, the measured natural logarithm absorbance, as determined by eqn (3), may be defined as A = αde where de, the effective thickness, is the equivalent thickness of solution or film required to produce the same absorbance in a conventional transmission measurement at normal incidence. Under typical conditions de ≈ 3dp.
The inherent interfacial layer sensitivity of EW-CRDS renders it ideal for the study of surface processes. For this purpose a variety of cavity configurations, described below, have been employed.
1.4 Cavity configurations for EW-CRDS
The use of EW-CRDS to study the solid–gas interface was first realised more than a decade ago by Pipino et al.22 In the same year they described an EW-CRDS study of adsorbed I2 films on silica using an intracavity Pellin–Broca prism (Fig. 3(a)).23 Since this pioneering work, a wide range of different cavity configurations have been developed, each of which have their own advantages and disadvantages in various applications and it is appropriate to briefly consider each in turn.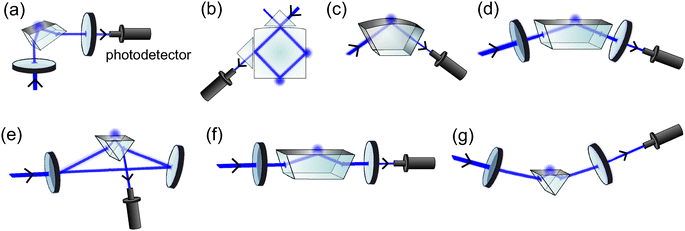 | ||
| Fig. 3 Schematics of a Pellin–Broca cavity (a), a polygonal monolithic cavity (b), a monolithic folded cavity configuration (c), a folded cavity (d), a ring cavity (e), a linear cavity employing a Dove prism (f) and a right angle prism cavity in a Brewster's angle configuration (g). | ||
A slightly simpler twist on the monolithic cavity is shown in Fig. 3(c) in which light enters and leaves the cavity perpendicular to the planar sides of a prism and the evanescent wave is formed at the larger convex face. The planar surfaces are high reflectivity-coated to provide a monolithic folded cavity arrangement whose high finesse has been used to study film growth and overtone spectroscopy of adsorbed species.25,26
Despite the very high finesse achieved by the geometry, monolithic cavities rely upon expensive custom-cut and polished optics in which at least one surface must be convex to ensure cavity stability; the Pipino group reported the first monolithic cavity measurements over two years after conceiving the geometry and the group remains the sole publisher of work using these configurations.
A small but significant part of the beam is reflected specularly at the entrance face of the prism (see Fig. 3(e)), providing a convenient measurement of the light circulating within the cavity. Whilst this reflection limits ring-down times to typically <1 μs, the high light levels detected permit the use of cheap low power light sources such as diode lasers (see Section 1.5). Furthermore, prisms for the ring cavity are cheap and readily available commercially. This configuration is versatile in terms of the range of interfaces and environments that can be studied and the minimum detectable interfacial absorbance per pass is ∼80 ppm which is sufficient for many purposes.31 The geometry does not, however, lend itself to polarization-sensitive measurements due to the need for anti-reflective prism coatings, nor does it permit broad spectral coverage as refraction at the prism surface is inherently wavelength dependent.
EW-CRDS using a right-angle prism in an arrangement shown in Fig. 3(g) has also been demonstrated.37 In this configuration the light beam enters and exits the (uncoated) prism boundaries at Brewster's angle. Like the Pellin–Broca prism cavity, this geometry allows incorporation of a low cost off-the-shelf prism within a high finesse optical cavity and may, therefore, be well suited to use in a commercial instrument.
The first report on an EW-based CRDS sensor using light circulation within closed loops of optical fibre (fibre-loop ring-down spectroscopy, FLRDS) was presented in 2002 by von Lerber and Sigrist.39 Part of the optical fibre sheath was etched with buffered hydrofluoric acid in order to allow access to the evanescent field in this region. The measurements were, however, complicated by the need to compensate for losses induced by bending of the optical fibre. Optical fibre sensing can also be coupled with continuous wave CRDS (see Section 1.5). In this FLRDS variant, a bi-conical taper is formed in a section of the optical fibre to serve as a low-loss sensing element. Cells with an average size of 10 μm have been detected due to induced scattering in the EW when adsorbed on a polypeptide coating on the taper.40 FLRDS may also be used as a sensitive pressure sensor, or to study absorption of bulk liquid samples and the interested reader is directed to the extensive review of FLRD provided by Waechter et al.41
1.5 Light sources for EW-CRDS
Thus far we have said little of the light sources used in EW-CRDS. In a similar trend to developments in gas-phase CRDS, initial EW-CRDS studies employed high powered tuneable pulsed lasers,23,24 whereas more recently the use of continuous wave (CW) diode lasers has become popular. The implementation and relative merits of these light sources in gas-phase CRDS are discussed in detail elsewhere and much of this information is directly applicable to EW-CRDS.4,42 It is, however, appropriate to discuss briefly, the essential features of light sources suitable for EW-CRDS.Light sources suitable for cavity-based spectroscopy are typically characterised by their spectral bandwidth by comparison with the frequency spacing, Δν, between adjacent longitudinal modes of the cavity itself:
 | (6) |
Tuneable pulsed lasers typically provide “broadband emission”, exciting multiple cavity modes simultaneously. The high pulse energy of these lasers delivers signal to noise ratios unmatched by other light sources and usually well beyond noise levels of modern detectors (e.g., photomultiplier tubes or photodiodes). Additionally, the tunability of dye lasers allows acquisition of full spectral information, i.e., as a function of wavelength. However, pulsed laser sources typically operate at low repetition rates (e.g., ∼10 Hz), which represents a significant limitation in making kinetic measurements.
CW diode lasers are typically either narrow linewidth (i.e., highly monochromatic, typically external cavity diode lasers which can have linewidths ≈ 1 MHz) or “broadband” (ca. 1 nm bandwidth) sources. The former have bandwidths significantly smaller than the spacing between cavity modes and provide the best way to make use of the full finesse of a cavity. When resonant with a cavity mode, optimal coupling into the cavity may be achieved, producing maximum circulating light levels determined by the product of the input intensity, Iin, and the cavity finesse. However, to accomplish optimal coupling, the laser either needs to be locked to a cavity mode (or vice versa) or one of either the cavity or laser needs to be scanned across several modes.43 In contrast, broadband sources may excite many thousands of cavity modes simultaneously, greatly simplifying the instrumentation for EW-CRDS.34,44,45 Some broadband diodes may be 100% intensity-modulated at high repetition rates (typically kHz) using simple laboratory signal generators on a timescale useful for CRDS (i.e., with rise/fall times of a few nanoseconds).32,33,45,46 If not, additional elements such as acousto-optic modulators must be incorporated to provide a pulse train for CRDS.31 In both cases the cavity is essentially filled with light (typically to a steady state, determined by the quality factor of the cavity) when the light is on and the light circulating decays in a continuous manner when the source is switched off.
2. Applications of EW-CRDS
The high spectral sensitivity, good temporal resolution (with rapid pulsed diode lasers) and, most importantly, the surface-sensitivity make EW-CRDS an excellent tool to study adsorption and reaction kinetics at interfaces. While we show herein that a growing body of applications is possible, it is important to point out some restrictions. The most obvious condition is the difference in the refractive indices of the two media (n1 > n2), since the light beam has to undergo TIR at the interface (see Section 1.3). Furthermore, the medium in which the laser pulse travels must be relatively transparent to prevent excessive losses due to scattering and absorption resulting in immeasurably short ring down times. Hitherto, the silica/air and silica/solution interfaces have received most attention. However, recent progress has seen the modification of the silica surface, for example, with polyelectrolyte polymers or other thin materials and this has diversified the range of interfaces that can be studied. In looking to the future, we also illustrate that it is possible to generate stable optical cavities with TIR at the water/air interface (see Section 4).2.1 Molecular adsorption studies
Among the first studies of adsorption was the use of a Pellin–Broca prism (Section 1.4) to probe the adsorption of I2 on silica. The equilibrium between solid I2 on the surface and I2 vapour was investigated at constant temperature by monitoring the optical absorbance of I2 at the surface. Several cycles of adsorption and desorption of I2 onto silica were observed. Additionally, it was shown that I2 adsorption followed a Langmuir-type isotherm and sub-monolayer sensitivity was demonstrated.23In a follow-up study the molecular orientation of I2 molecules on the silica surface was investigated.24 It was observed that the use of s-polarised light led to a significantly larger change in the ring-down time compared to the p-polarised mode, suggesting that I2 molecules were preferentially oriented parallel to the surface. The molecular orientation of Methylene Blue dye at the air/fused-silica interface was similarly investigated by Li and Zare.47 It was shown that at low coverages the molecules essentially lay flat on the surface and that by increasing the surface concentration, the molecules oriented more vertically.
Turning to solution phase systems, a number of studies have considered molecular adsorption at the silica/water interface. For example, the adsorption of Crystal Violet dye has been studied as a function of the pH and the ionic strength of the solution.35 Additionally the average molecular orientation angle of Crystal Violet has been studied, using polarization-sensitive EW-CRDS, as a function of surface concentration.48 The pH-dependence of the adsorption of a Nile Blue dye derivative at the silica/water interface has also been investigated.49 These, and other experiments, have revealed two types of Si–OH groups on silica48 and the titration of these was significantly different depending on whether this was carried out by increasing or decreasing the pH.49 With this information, a cooperative binding model has been developed to interpret the adsorption isotherm for charged chromophores which takes into account the degree of surface charge.
Another, not unrelated, example of the use of polarization sensitivity in cavity ringdown is provided by the recent work of Karaiskou et al., who used phase-shift cavity ringdown to make sensitive ellipsometric measurements of fenchone adsorbed onto cavity ringdown mirrors.50 Single laser shot sensitivities of <10−2 degrees were achieved in experiments which herald the use of ellipsometry in studying dynamical interfacial processes.
Fan et al. investigated the adsorption properties of neutral trans-4-[4-(dibutylamino)styril]-1-(3-sulfopropyl)pyridinium (DP) and charged trans-4-[4-(dibutylamino)styril]-1-methylpyridinium (DMP+), as the iodide salt, at the silica/acetonitrile interface and successfully applied EW-CRDS in a different silica/solvent system.51 By allowing other neutral molecules such as triethylamine to compete for the silanol binding sites, the nature of the binding of DP and DMP+ was determined. It was found that DP was hydrogen-bonded to the Si–OH groups, whereas DMP+ was electrostatically adsorbed. Because the adsorption followed a simple Langmuirian binding model, thermodynamic properties, such as free energy of adsorption, were calculated readily.
To diversify adsorption studies of this type and obtain information about interfacial electrostatic interactions, the surface can be functionalised by monolayer or multilayer assemblies of polyelectrolytes, such as poly-L-lysine (PLL) and poly-L-glutamic acid (PGA). The resulting surface charge is either positive in the case of PLL or negative in the case of a PLL/PGA bilayer (over a wide range of pH). Originally developed by Decher et al.,52,53 the electrostatic assembly of polyelectrolytes provides surfaces with well defined properties such as thickness and surface potential.54,55 We adopted this approach for the modification of silica surfaces,33 using a PLL/PGA bilayer to produce a negatively charged surface. This was used as a template to study the adsorption of tris(2,2′-bipyridine)ruthenium(II), Ru(bpy)32+, as a function of pH, Ru(bpy)32+ concentration and electrolyte concentration. An important demonstration in these studies was that the pH in the region of the evanescent field could be changed dynamically using an electrode close to the point of TIR (see Section 2.3 below for further details on the implementation of electrochemistry in EW-CRDS). By stepping the electrode potential to very positive values, H+ ions were generated in a quantitative manner to protonate the PGA layer, leading to the release of Ru(bpy)32+ from the interface. Because the electrochemical generation of H+ was well defined, it was possible to titrate the PGA film quantitatively, by simply changing the potential step time or the electrode/prism separation and thus generate different pH values at the interface.
Most recently, rhodamine B adsorption behaviour has been characterized at silica/methanol, silica/water and chlorotrimethylsilane-functionalized silica/methanol interfaces, allowing determination of adsorption equilibrium constants for each interface.36
2.2 Nanostructured materials and thin films
There is considerable interest in the assembly of nanostructured materials on surfaces and interfaces.56,57 Understanding the kinetics and extent of the assembly process provides important information for optimising and controlling the process. EW-CRDS is proving powerful as a methodology for monitoring the adsorption of nanoparticles (NPs) on surfaces in situ and in real time. For example, the Shaw group measured the binding kinetics of Au NPs, which they synthesised, with mean diameters of either 15 nm or 45 nm, at the silica/water interface.58 These particles appeared to adsorb onto the silica surface despite it being negatively charged, and the extinction coefficients of the NPs were obtained. The adsorption rate constant at sub-monolayer coverages was found to depend on the surface coverage. Both types of NPs eventually packed into multilayers and the aggregation appeared to be size- and ligand-dependent.In other experiments, the same group investigated the kinetics of the formation of a self-assembled monolayer (SAM) of thioctic acid (ToA) from aqueous solutions on a layer of the same type of gold NPs.59 It was found that the kinetics were highly dependent on the solution pH. Acid conditions produced a high-density neutral SAM, while deposition from basic conditions yielded low-density charged SAMs (deprotonated COOH groups). The monolayer formation transients were fitted successfully to a kinetic model in which the sticking probability of ToA depended on the lateral interactions of the adsorbed thiols. The nature of these interactions was electrostatic for the deprotonated acid, which accounted for the less dense SAM formed on the NPs.
In order to obtain more information about the binding properties of metal NPs to surfaces, our group investigated the adsorption of commercially available Au NPs onto PLL-modified silica.45 The measurements were carried out in a ring cavity arrangement using a 405 nm diode laser. The time-dependent adsorption kinetics of aqueous solutions of two different types of citrate-stabilised Au NPs, with average sizes of 5 nm and 20 nm, were followed at different dilutions. In contrast to the work mentioned above, it was found that neither type of NP adsorbed onto the bare silica surface, but both types possessed a high affinity towards positively charged PLL-modified silica. This is rational, given the electrostatic interaction between the PLL and the negatively charged citrate shell of the Au NPs. The surface coverage of the 5 nm Au NPs on the PLL-modified surface, as reflected in the interfacial optical absorbance showed a monotonic increase with time (Fig. 4(a)), ultimately attaining a limiting value. The data could be explained by a diffusion-limited irreversible adsorption model, as developed by Adamczyk.60 In essence, when the negatively charged Au NPs neutralise the charge of the PLL film, any further adsorption is inhibited and the maximal coverage is reached (schematic inset in Fig. 4(a)), which in this case was 55 (±14) NPs μm−2 (determined by ex situtapping mode atomic force microscopy (TM-AFM) measurements).
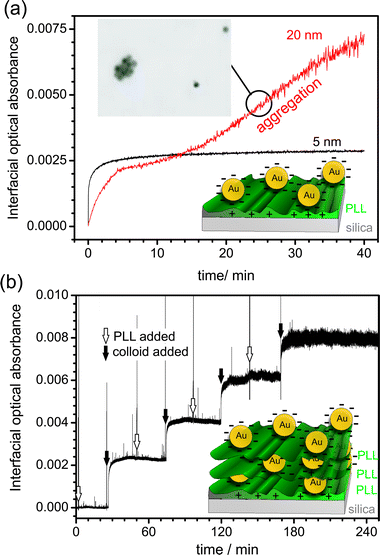 | ||
| Fig. 4 (a) (Black line) Absorbance transient for the adsorption of 5 nm commercially available citrate-stabilised Au NPs onto a PLL-modified silica surface. After 10 min, the maximal coverage has been achieved. (red line) Absorbance transient for the adsorption of 20 nm Au NPs onto a PLL surface. (Inset) tapping mode atomic force microscope image of the surface at 25 min, showing colloidal particle aggregation. (b) Interfacial optical absorbance as a function of time for several Au NP adsorption steps. 5 nm diameter colloids solution and PLL were added sequentially, as indicated, to form multilayer structures. | ||
The time-dependence of adsorption for the 20 nm Au particles was considerably different (Fig. 4(a)). After initial rapid adsorption, similar to that with the 5 nm particles, the surface coverage attained a plateau quasi-steady value after ca. 10 min. However, the optical absorbance subsequently increased linearly indicating a change in the coverage and/or surface structure. TM-AFM confirmed the formation of aggregates at this stage, as shown in Fig. 4(a). As illustrated in Fig. 4(b), it was also possible to monitor the formation of multilayer structures of alternating layers of (positively charged) PLL and (negatively charged) Au NPs, providing information on how complex multilayer structures are constructed. Understanding the formation of films of this type is important as they have proven particularly valuable for sensing applications.61
In later studies, we adopted a similar approach to investigate the adsorption of Ag NPs on PLL-modified silica.32 It was shown that very small quantities of adsorbed NPs could be detected in their intense surface plasmon band around 405 nm, with a detection limit of a few particles per μm2. The NPs were then electrochemically dissolved, using electrogenerated Ir(IV), IrCl62−. The electrochemical reaction took place at a Pt electrode positioned close to the evanescent field in a thin-layer cell configuration as shown in Fig. 5(a). A typical optical absorbance transient resulting from the diffusion-limited electrogeneration of Ir(IV) from Ir(III), in a 10 s potential step, is shown in Fig. 5(b). After a short lag period of ca. 5 s, which is due to the diffusion of Ir(IV) from the electrode to the prism surface, the optical absorbance decreases with time indicating dissolution and shrinkage of the particles. The dissolution kinetics (a model fit is indicated by the red line in Fig. 5(b)) were readily obtained because the optical absorbance is well-related to the NP size. Preliminary studies employing a microjet close to the evanescent field to induce dissolution via the flow of an Ir(IV) solution were also reported.32
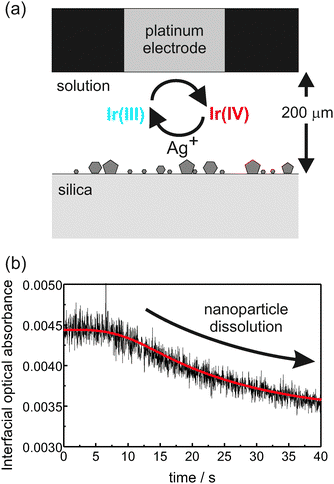 | ||
| Fig. 5 (a) Schematic representation of the thin layer electrochemical cell approach to dissolve the Ag NPs. (b) Absorbance transients (black line) and theoretical fit (red line) for a typical dissolution experiment where Ir(IV) was generated for the duration of a 10 s potential step. | ||
We recently investigated the polymerisation kinetics of aniline on silica.46 By careful selection of the reaction conditions, it was possible to initiate the oxidative polymerisation of aniline, using persulfate as the oxidizing agent, only on the silica surface. Fig. 6 shows typical EW-CRDS data, expressed as the ring-down time as a function of experimental time, for the polymerisation of aniline using a monomer concentration of 0.2 M. At the beginning of the experiment, the cell was filled with water (a). The ring-down time was slightly shorter when the water was replaced by the aniline solution (b). After adding sodium persulfate as the oxidant, the polymerisation process started and polyaniline (PAni) NPs were formed on the surface (c), which led to a decrease in the ring-down time (due to interfacial optical absorbance and scattering). The polymerisation was stopped by replacing the aniline/sodium persulfate solution with water (d), and the ring-down time levelled off.
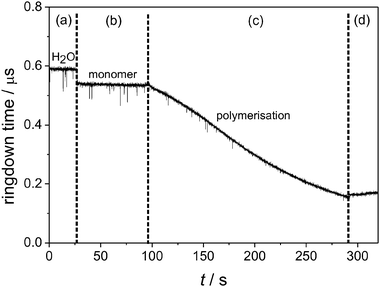 | ||
| Fig. 6 Experimental raw data for polymerisation of aniline using a 0.2 M monomer solution. The labelled sections represent different stages of the experiment. (a) Water only in cell, (b) monomer solution, (c) sodium persulfate was added, starting the polymerisation, (d) the polymerisation process was stopped by replacing the solution with water. | ||
The growth of the PAni NPs was also monitored using TM-AFM to characterise the surface at various polymerisation times, as shown in Fig. 7(a)–(c). This showed that the nucleation and growth process involved a time-invariant fixed density of NPs. With this knowledge, and by converting the ring-down traces to optical absorbance transients, it was possible to obtain the polymerization kinetics in a straightforward manner. An important observation at short times (small particle sizes) was an apparent size-dependent polymerisation rate constant, as shown in Fig. 7(d), using an analysis that assumed hemispherical NP growth.
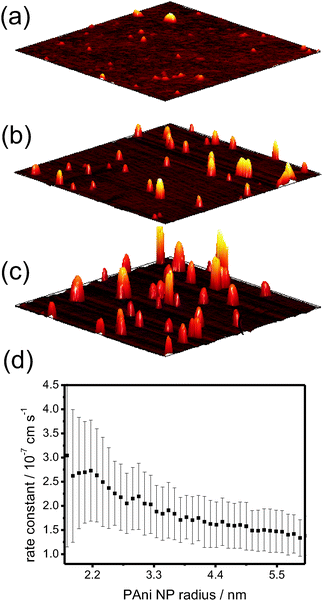 | ||
| Fig. 7 Ex situ TM-AFM images (1 μm × 1 μm scans) of PAni (monomer concentration: 0.2 M) measured after a polymerisation time of (a) 2 min, (b) 4 min and (c) 6 min. (d) The average polymerization rate constant as a function of PAni NP radius (derived from the interfacial absorbance measured by EW-CRDS see ref. 46). | ||
Turning to films, EW-CRDS has been employed to monitor solvent (water or methanol) ingress into poly(dimethylsiloxane) (PDMS) attached to a prism surface.62 The films were several hundreds of micrometres thick, exceeding by far the penetration depth of the evanescent field. The film was exposed to solvent and the response from the evanescent field was monitored with time. It was found that the uptake of methanol was initially slower than water, but at longer times, the methanol diffused faster into the polymer film. The source of the EW-CRDS losses was found to be scattering effects in the film due to the uptake of the solvents. Complementary surface plasmon resonance studies indicated that methanol caused the polymer to swell, with the formation of pockets of bulk methanol in the region of the evanescent field. On the other hand, water appeared to form a thin film and did not cause as much scattering. In both cases, it was possible to calculate diffusion coefficients for the two solvents in the film.62
2.3 Monitoring electrochemical processes with EW-CRDS
Although a surface sensitive technique, EW-CRDS can detect fairly low concentrations of dyes and light absorbing molecules in bulk solution. This is evident in proof-of-principle experiments employing a thin-layer electrochemical cell.31 As highlighted in Sections 2.1 and 2.2, by introducing a Pt working electrode close to the silica prism surface, it is possible to change solution properties such as pH and redox species concentrations locally and monitor surface reactions spectroscopically. One can also simply measure solution concentrations at the silica prism surface during an electrochemical process, so that EW-CRDS combined with a thin layer electrochemical cell becomes a spectroelectrochemical technique. For example, in initial experiments,31ferricyanide, [Fe(CN)6]3−, was electrochemically generated from ferrocyanide, [Fe(CN)6]4−, at the working electrode. The oxidised species possessed a much higher absorbance at the chosen wavelength (417 nm) and the concentration of the electrogenerated species could therefore easily be measured within the evanescent field during cyclic voltammetry (CV) measurements as shown in Fig. 8(a). In this particular example, it was demonstrated that spectroscopic data could be obtained simultaneously with electrochemical data. As an example, Fig. 8(b) shows the [Fe(CN)6]3−concentration at the prism/electrolyte interface, as a function of time, together with the current signal for oxidation and reduction at the electrode during one CV cycle. The initial potential (0 V), reverse potential (0.5 V) and final potential (0 V), together with the anodic and cathodic peak potentials (Ep) are marked on the current trace. At the onset of the oxidation peak of this CV, and after a certain lag time, due to diffusion between the electrode and silica/aqueous interface, the absorbance—and hence the [Fe(CN)6]3−concentration—increases and reaches a maximum value, which corresponds to the initial bulk concentration of [Fe(CN)6]4−. The absorbance decreases again, when the applied potential is reversed to reduce [Fe(CN)6]3− back to [Fe(CN)6]4−. These studies highlight the potential of EW-CRDS as a means of tracking concentration changes during electrochemical processes, which is valuable for the elucidation of reaction kinetics and mechanisms. An interface, or small bulk sample, can be perturbed electrochemically in situ with the results of that intervention measured in the optical response. Furthermore, the electrochemical measurements at the electrode and optical measurements at the prism provide complementary information with the former providing information on the mass transportto the electrode and the EW-CRDS including information on the diffusion of the measured species.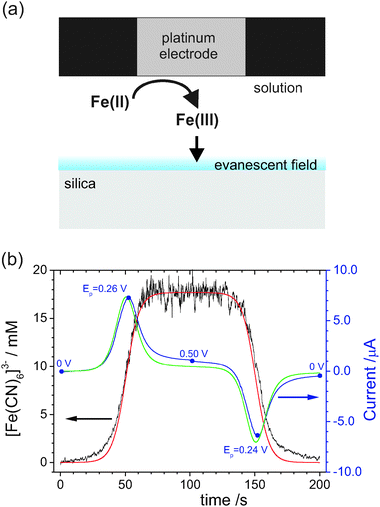 | ||
| Fig. 8 (a) Schematic of the thin layer cell configuration for EW-CRDS illustrating the generation of Fe(CN)63− from Fe(CN)64− (forward sweep process of the data in (b)). (b) Ferricyanide concentration recorded in the region of the evanescent field as a function of time during a CV (5 mV s−1) for an electrode–surface distance of 25 ± 1 μm. The corresponding red (concentration) and green (CV) lines are simulations based on finite element modelling of a reversible process (adapted from ref. 31). | ||
2.4 Biologically-relevant interfaces
There has been some effort to investigate the adsorption of biologically important molecules on surfaces. For example, the polarization-dependent adsorption of Hemoglobin on silica has been studied using a Dove prism.28 As the beam enters and exits at a right angle to the prism surfaces, it was possible to measure very slight changes in the molecular orientation. The rate constants for adsorption, desorption and irreversible adsorption of Hemoglobin were measured and analysed using a diffusion/reaction model. Martin et al. have demonstrated the potential of EW-CRDS as a medical tool in Hemoglobinuria diagnosis by studying Hemoglobin adsorption, from urine samples, to silica.63Haselberg et al. studied the adsorption of cytochrome c onto bare silica and functionalised silica.64 The prism surface was modified using a single layer of polybrene and a triple layer of polybrene, dextran sulfate and polybrene in order to study possible inhibitors for protein adsorption. It was found that these coatings effectively suppress the irreversible adsorption of cytochrome c. The adsorption of cytochrome c at interfaces has also been monitored by mounting a flow cell on top of an optical prism. It was shown that the adsorption of cytochrome c was irreversible on all investigated surfaces: bare silica; octadecyl-terminated silica; and NH2-terminated silica. The cytochrome c showed the highest affinity towards the bare silica surface followed by the –NH2 coating and the octadecyl-terminated surface.65 Our group recently used a thin layer electrochemical cell (similar to that described in Sections 2.2 and 2.3) to study the redox reaction between an adsorbed layer of cytochrome c immobilised on fused silica and the ethylenediaminetetraacetic acid iron(II) complex (FeEDTA2−).66 This latter work showed that it is possible to directly monitor electron transfer between surface immobilised proteins and molecules using EW-CRDS, and obtain quantitative information on the kinetics.
Wang et al. demonstrated the sensitivity of EW-CRDS to femtomole quantities of an antigen, interacting with a surface-immobilised antibody: the antibody was immobilised at an (amino-propyl) functionalized prism surface and the ring-down time was monitored during addition of the dye-labelled antigen.37
Very recently, we studied the kinetics of the adsorption of 5,10,15,20-tetrakis(4-N-methylpyridiniumyl)porphyrin (TMPyP) from pH 7.4 phosphate buffer solution (PBS) to a silica surface.34 The TMPyP was delivered by a jet nozzle in order to study relatively fast adsorption kinetics, which were analysed using complementary finite-element modelling. After the surface has been functionalised with TMPyP, it was shown that calf thymus DNA efficiently desorbed the TMPyP from the surface, most likely by intercalation of TMPyP between the DNA base pairs. The kinetics of the process were deduced. These initial exemplar studies provide a platform and impetus for the further application of EW-CRDS to study processes related to physical biology.
3. Broadband cavity enhanced absorption spectroscopy (BB-CEAS)
As described above, in Section 1.5, the use of tuneable lasers in cavity-based spectroscopic techniques, in principle, allows the acquisition of optical absorption spectra as a function of wavelength. However, inhomogeneous broadening of absorption bands in the condensed phase makes tuneable light sources unsuitable for monitoring rapid spectral changes in EW-CRDS; tuneable lasers are typically unable to scan rapidly across wide enough wavelength ranges. Hence, examples of studies employing pulsed tuneable light sources to acquire absorption spectra in EW-CRDS are comparatively scarce24–26,67,68 and the technique may be considered somewhat one-dimensional. By contrast, broadband (BB) variants of CEAS, a technique closely related to CRDS, allow simultaneous acquisition of spectral information over wide wavelength ranges (tens or hundreds of nanometres). Therefore, BB-CEAS may prove particularly useful in identifying spectral changes, such as shifts or broadening effects, associated with dynamical surface processes.The general principles of CEAS are discussed in detail elsewhere42 but briefly, BB-CEAS involves the continuous injection of broadband radiation into an optical cavity. This radiation may be provided by either a (spatially) coherent (e.g. laser) or incoherent (e.g. LED or lamp) source. Under conditions of constant injection, the light intensity within the cavity rapidly reaches a steady state, which is proportional to the ring-down time. Measurement of the wavelength-dispersed time-integrated steady-state light intensity leaking out of the cavity, often using a spectrograph and charge-coupled device (CCD) array, allows calculation of intracavity absorbance as a function of wavelength. For low absorption coefficients and high mirror reflectivities the absorbance may be calculated using
 | (7) |
Previous liquid-phase BB-CEAS studies have employed light emitting diode (LED) sources to study absorbance of analytes constrained within intracavity cuvettes, an HPLC cell and a liquid-filled cavity.30,69–71 Importantly, as demonstrated by Seetohul et al., BB-CEAS allows the spectral separation of multiple liquid-phase analytes with overlapping absorption profiles.70 We envisage that in future this powerful additional feature of BB-CEAS will find more applications to the condensed phase.
Recently, and particularly pertinent to this review, BB-CEAS has been introduced for measurements in the condensed phase using EWs.27,29,30Fig. 9 shows a schematic of the setup for an EW-BB-CEAS experiment employing a folded cavity arrangement and custom-coated mirrors with reflectivity > 0.9995 throughout the range 400–750 nm. Notably, we monitored the diffusion of electrogenerated Ir(IV), IrCl62−, in a thin-layer electrochemical cell, similar to the EW-CRDS measurements described above (Sections 2.2–2.4), using a supercontinuum radiation (SCR) source and a folded cavity arrangement.29,30Fig. 10 shows the temporal evolution of the spectrum (400–700 nm) at the silica/aqueous interface measured using EW-BB-CEAS during the potential step electrogeneration of Ir(IV) (via electro-oxidation of Ir(III), IrCl63−) in a 100 μm thick electrochemical cell. The working electrode was stepped from +0.4 V to +1.0 V at 0 s and, following a ca. 10 s delay associated with diffusion of Ir(IV) to the silica surface, the interfacial absorbance increases, approaching its maximum as Ir(III) oxidation nears completion. At 60 s the working electrode potential was stepped back to +0.4 V and, again following a short delay, the interfacial absorbance decreases as Ir(IV) is reduced. The data were recorded with 10 μs acquisition times at a repetition rate (limited by data readout from the CCD array) of 606 Hz. One major advantage of SCR is its superior combination, compared to other excitation sources, of high spectral irradiance coupled with inherent collimation/directionality. Together, these permit rapid spectral acquisitions with a high signal to noise ratio as illustrated by the temporal and spectral cuts through the contour plot shown in Fig. 10, from which an effective minimum detectable absorbance of 3.9 × 10⁻⁵ was determined. This initial work highlights the considerable potential of EW-BB-CEAS for spectrally resolved dynamic measurements at interfaces.
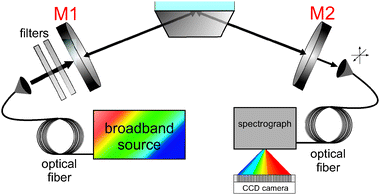 | ||
| Fig. 9 Schematic of the experimental setup for EW-BB-CEAS studies using a folded cavity arrangement. | ||
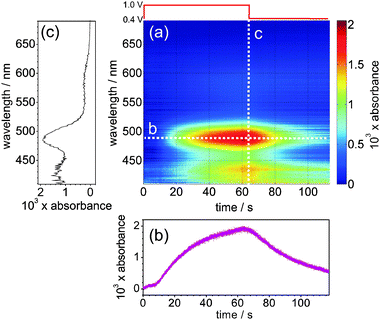 | ||
| Fig. 10 (a) Contour plot: interfacial absorbance spectrum as a function of time during the electrochemical generation of Ir(IV) from Ir(III): (b) a temporal cut through the contour plot at 487 nm and (c) a spectral cut through the contour plot at 65 s. | ||
4. Diversification of environments: beyond silica surfaces
There is no practical reason for EW-cavity based spectroscopic techniques to be limited to studies at silica interfaces. By way of illustration, Fig. 11 shows preliminary EW-CRDS and EW-CEAS experiments at a liquid/air interface.72 The experimental set up is shown schematically in Fig. 11(a). A 405 nm diode laser (linewidth ca. 1 nm) is aligned, in a folded cavity arrangement, within a Langmuir trough (Nima Technology) containing Milli-Q water (resistivity 18.2 MΩ cm at 25 °C). One cavity mirror is incorporated into the trough and the other manipulated externally for alignment. This configuration yields a background ring-down time, τo = 300–450 ns with L = 39 cm (i.e., ca. 110–170 roundtrips per ringdown).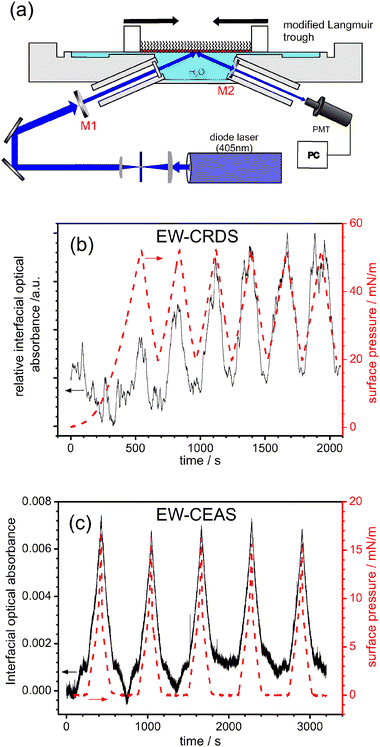 | ||
| Fig. 11 Cavity-based spectroscopy at the water|air interface: (a) schematic of the experimental setup; (b) surface pressure (red) and EW-CRDS-measured interfacial absorbance of a PCB-DMPE/DPPC Langmuir film, recorded during 6 barrier compression/expansion cycles. (c) Surface pressure (red) and EW-CEAS-measured interfacial absorbance of a zinc pthalocyanine derivative (see text for details) Langmuir film, recorded during 5 barrier compression/expansion cycles. | ||
This cavity arrangement is sensitive to the evanescent field established above the water interface and may thus be used to make in situ interfacial absorbance measurements of thin films supported at the water/air interface. By way of proof-of-principle, Langmuir films were deposited at the water/air interface, with the confinement area of the films controlled and varied using a pair of Teflon barriers, and the resulting changes in the molecular packing monitored via the interfacial absorbance. Surface pressure data (the difference in surface tension in the absence and presence of the Langmuir film) were recorded simultaneously using a Wilhelmy plate balance for comparison with the optical data.
Fig. 11(b) shows a typical example of combined EW-CRDS/surface pressure response during a series of repeated film compressions and expansions of a mixed Langmuir film comprising the labelled phospholipid, Pacific blue™ 1,2-ditetradecanoyl-sn-glycero-3-phosphoethanolamine, triethylammonium salt (PCB-DMPE from Molecular Probes), and 1,2-dipalmitoyl-sn-glycero-3-phosphocholine (DPPC, Sigma Aldrich). The periodic and reproducible change in interfacial absorbance with time, seen in Fig. 11(b), is due to a change in the number of adsorbed molecules within the EW region during film compression and expansion. This is reflected in the simultaneous surface pressure measurements (right hand scales of Fig. 11(b)), which track the absorbance data. The interfacial absorbance data do, however, contain additional features which may yield information on surface processes.
EW-CEAS may be used at the same interface: Fig. 11(c) shows the EW-CEAS interfacial optical absorbance at 405 nm of a Langmuir film of a phthalocyanine derivative (zinc 2,3,9,10,16,17,23,24-octakis(octyloxy)-29H,31H-phthalocyanine, ZnPC, from Sigma Aldrich), during repeated film compression–expansion cycles. The surface pressure and interfacial optical absorbance changes are closely matched.
These preliminary, illustrative studies demonstrate the potential of EW-cavity based spectroscopic techniques in probing liquid–air interfaces which are of wide interest for the formation and characterisation of ultra-thin (molecular) films. We foresee the major advantages of this application being in situations in which (i) the surface area is too small to merit reliable quantification of coverage via surface tension measurements; (ii) in polarization-sensitive applications where one might observe ordering and orientation of films as a function of surface pressure; and (iii) in kinetic studies at the liquid|air interface.
5. Conclusions and outlook
As highlighted in this review, EW-CRDS is becoming established as a simple, but sensitive, technique with which it is possible to monitor surface and interfacial phenomena. Although there are many different ways to implement this technique, the principles of the various instruments and optical cavities derive from common principles. The optical detection sensitivity and high spatial resolution of EW-CRDS compares favourably with related spectroscopic techniques such as ATR and UV-visible absorption spectroscopy. Furthermore, the temporal resolution achieved by EW-CRDS employing “broadband” light sources opens up the possibility of following fast interfacial processes. Although originally focused on pristine silica surfaces, a considerable body of recent work has shown that the surface chemistry studied can be diversified and expanded, for example, by using polymer-modified surfaces, immobilised nanostructures and films. We expect this trend to continue, with particular applications to the life sciences, such as the use of lipid bilayers, proteins and cells. The possibility of studying liquid/air interfaces, illustrated here for the first time, greatly expands the applicability of EW-CRDS. This review has also demonstrated that by choosing certain cavity geometries, it is possible to make polarization-dependent measurements to obtain information on molecular orientation and organisation.It is to be expected that the range of applications of EW-CRDS will continue to expand, particularly where it is used in combination with other analytical techniques, such as electrochemical methods, HPLC, microfluidic procedures and scanning probe microscopy methods. EW-CRDS can easily be implemented into all of these experimental setups. It is also likely that the technique will find application in combination with many other techniques.
Recent initial work has demonstrated that EW-BB-CEAS can provide valuable spectral information on dynamic interfacial processes. Using broadband radiation, surface reactions can be monitored in much more detail by following absorbance changes over the entire visible absorption spectrum. With further improvements in time resolution, EW-BB-CEAS is likely to prove a particularly powerful probe of interfacial phenomena.
Acknowledgements
Our own group work reported here was generously supported by the EPSRC under grant EP/C00907X. SRM is further grateful to the EPSRC for an Advanced Research Fellowship. We gratefully acknowledge H. V. Powell, M. Zhang, J. V. Macpherson, V. Stavros, M. Mazurenka, and M. Cheung in Warwick, L. van der Sneppen, G. Hancock, R. Peverall and G. A. D. Ritchie in Oxford and J. Hult, J.M. Langridge, R. L. Jones, T. Laurila and C. F. Kaminski in Cambridge for their collaborative contributions to our research in this area.References
- A. O'Keefe and D. A. G. Deacon, Rev. Sci. Instrum., 1988, 59, 2544–2551 CrossRef CAS.
- R. T. Jongma, M. G. H. Boogaarts, I. Holleman and G. Meijer, Rev. Sci. Instrum., 1995, 66, 2821–2828 CrossRef CAS.
- J. J. Scherer, J. B. Paul, A. Okeefe and R. J. Saykally, Chem. Rev., 1997, 97, 25–51 CrossRef CAS.
- M. D. Wheeler, S. M. Newman, A. J. Orr-Ewing and M. N. R. Ashfold, J. Chem. Soc., Faraday Trans., 1998, 94, 337–351 RSC.
- G. Berden, R. Peeters and G. Meijer, Int. Rev. Phys. Chem., 2000, 19, 565–607 CrossRef CAS.
- Cavity Ring-Down Spectroscopy: Techniques and Applications, ed. G. Berden and R. Engeln, Wiley-Blackwell, 2009 Search PubMed.
- C. Vallance, New J. Chem., 2005, 29, 867–874 RSC.
- R. Engeln, G. von Helden, A. J. A. van Roij and G. Meijer, J. Chem. Phys., 1999, 110, 2732–2733 CrossRef CAS.
- D. Kleine, J. Lauterbach, K. Kleinermanns and P. Hering, Appl. Phys. B: Lasers Opt., 2001, 72, 249–252 CAS.
- R. N. Muir and A. J. Alexander, Phys. Chem. Chem. Phys., 2003, 5, 1279–1283 RSC.
- I. M. P. Aarts, B. Hoex, A. H. M. Smets, R. Engeln, W. M. M. Kessels and M. C. M. van de Sanden, Appl. Phys. Lett., 2004, 84, 3079–3081 CrossRef CAS.
- S. Gilb, K. Hartl, A. Kartouzian, J. Peter, U. Heiz, H. G. Boyen and P. Ziemann, Eur. Phys. J. D, 2007, 45, 501–506 CrossRef CAS.
- A. J. Hallock, E. S. F. Berman and R. N. Zare, Anal. Chem., 2002, 74, 1741–1743 CrossRef CAS.
- A. J. Hallock, E. S. F. Berman and R. N. Zare, J. Am. Chem. Soc., 2003, 125, 1158–1159 CrossRef CAS.
- A. J. Alexander, Chem. Phys. Lett., 2004, 393, 138–142 CrossRef CAS.
- L. van der Sneppen, A. Wiskerke, F. Ariese, C. Gooijer and W. Ubachs, Anal. Chim. Acta, 2006, 558, 2–6 CrossRef CAS.
- S. C. Xu, G. H. Sha and J. C. Xie, Rev. Sci. Instrum., 2002, 73, 255–258 CrossRef CAS.
- K. L. Bechtel, R. N. Zare, A. A. Kachanov, S. S. Sanders and B. A. Paldus, Anal. Chem., 2005, 77, 1177–1182 CrossRef CAS.
- A. J. Alexander, Anal. Chem., 2006, 78, 5597–5600 CrossRef CAS.
- R. S. Brown, I. Kozin, Z. Tong, R. D. Oleschuk and H. P. Loock, J. Chem. Phys., 2002, 117, 10444–10447 CrossRef CAS.
- M. Milosevic, Appl. Spectrosc. Rev., 2004, 39, 365–384 CrossRef CAS.
- A. C. R. Pipino, J. W. Hudgens and R. E. Huie, Rev. Sci. Instrum., 1997, 68, 2978–2989 CrossRef CAS.
- A. C. R. Pipino, J. W. Hudgens and R. E. Huie, Chem. Phys. Lett., 1997, 280, 104–112 CrossRef CAS.
- A. C. R. Pipino, Phys. Rev. Lett., 1999, 83, 3093–3096 CrossRef CAS.
- A. C. R. Pipino, J. P. M. Hoefnagels and N. Watanabe, J. Chem. Phys., 2004, 120, 2879–2888 CrossRef CAS.
- I. M. P. Aarts, A. C. R. Pipino, J. P. M. Hoefnagels, W. M. M. Kessels and M. C. M. van de Sanden, Phys. Rev. Lett., 2005, 95, 166104 CrossRef CAS.
- A. A. Ruth and K. T. Lynch, Phys. Chem. Chem. Phys., 2008, 10, 7098–7108 RSC.
- M. A. Everest, V. M. Black, A. S. Haehlen, G. A. Haveman, C. J. Kliewer and H. A. Neill, J. Phys. Chem. B, 2006, 110, 19461–19468 CrossRef CAS.
- M. Schnippering, P. R. Unwin, J. Hult, T. Laurila, C. F. Kaminski, J. M. Langridge, R. L. Jones, M. Mazurenka and S. R. Mackenzie, Electrochem. Commun., 2008, 10, 1827–1830 CrossRef CAS.
- L. Van der Sneppen, G. Hancock, C. F. Kaminski, T. Laurila, R. Mackenzie Stuart, S. Neil, R. Peverall, G. A. D. Ritchie, M. Schnippering and P. R. Unwin, Analyst, 2010, 135, 133–139 RSC.
- M. Mazurenka, L. Wilkins, J. V. Macpherson, P. R. Unwin and S. R. Mackenzie, Anal. Chem., 2006, 78, 6833–6839 CrossRef CAS.
- M. Schnippering, H. V. Powell, M. Q. Zhang, J. V. Macpherson, P. R. Unwin, M. Mazurenka and S. R. Mackenzie, J. Phys. Chem. C, 2008, 112, 15274–15280 CrossRef CAS.
- H. V. Powell, M. Schnippering, M. Mazurenka, J. V. Macpherson, S. R. Mackenzie and P. R. Unwin, Langmuir, 2009, 25, 248–255 CrossRef CAS.
- M. Zhang, H. V. Powell, S. R. Mackenzie and P. R. Unwin, Langmuir, 2010, 26, 4004–4012 CrossRef CAS.
- A. M. Shaw, T. E. Hannon, F. P. Li and R. N. Zare, J. Phys. Chem. B, 2003, 107, 7070–7075 CrossRef CAS.
- M. S. Chen, H. F. Fan and K. C. Lin, Anal. Chem., 2010, 82, 868–877 CrossRef CAS.
- X. Wang, M. Hinz, M. Vogelsang, T. Welsch, D. Kaufmann and H. Jones, Chem. Phys. Lett., 2008, 467, 9–13 CrossRef CAS.
- R. K. Li, H. P. Loock and R. D. Oleschuk, Anal. Chem., 2006, 78, 5685–5692 CrossRef CAS.
- T. von Lerber and M. W. Sigrist, Appl. Opt., 2002, 41, 3567–3575 CrossRef.
- P. B. Tarsa, A. D. Wist, P. Rabinowitz and K. K. Lehmann, Appl. Phys. Lett., 2004, 85, 4523–4525 CrossRef CAS.
- H. Waechter, J. Litman, A. H. Cheung, J. A. Barnes and H. P. Loock, Sensors, 2010, 10, 1716–1742 CrossRef CAS.
- M. Mazurenka, A. J. Orr-Ewing, R. Peverall and G. A. D. Ritchie, Annu. Rep. Prog. Chem., Sect. C, 2005, 101, 100–142 RSC.
- D. Romanini, A. A. Kachanov and F. Stoeckel, Chem. Phys. Lett., 1997, 270, 538–545 CrossRef CAS.
- A. J. Hallock, E. S. F. Berman and R. N. Zare, Appl. Spectrosc., 2003, 57, 571–573 CrossRef CAS.
- M. Mazurenka, S. M. Hamilton, P. R. Unwin and S. R. Mackenzie, J. Phys. Chem. C, 2008, 112, 6462–6468 CrossRef CAS.
- M. Schnippering, H. V. Powell, S. R. Mackenzie and P. R. Unwin, J. Phys. Chem. C, 2009, 113, 20221–20227 CrossRef CAS.
- F. P. Li and R. N. Zare, J. Phys. Chem. B, 2005, 109, 3330–3333 CrossRef CAS.
- H. F. Fan, F. P. Li, R. N. Zare and K. C. Lin, Anal. Chem., 2007, 79, 3654–3661 CrossRef CAS.
- J. P. O'Reilly, C. P. Butts, I. A. I'Anson and A. M. Shaw, J. Am. Chem. Soc., 2005, 127, 1632–1633 CrossRef CAS.
- A. Karaiskou, V. Papadakis, B. Loppinet and T. P. Rakitzis, J. Chem. Phys., 2009, 131, 121101 CrossRef.
- H. F. Fan, C. Y. Hung and K. C. Lin, Anal. Chem., 2006, 78, 3583–3590 CrossRef CAS.
- G. Decher, Science, 1997, 277, 1232–1237 CrossRef CAS.
- G. Decher, J. D. Hong and J. Schmitt, Thin Solid Films, 1992, 210, 831–835 CrossRef.
- H. Hoffmannova, D. Fermin and P. Krtil, J. Electroanal. Chem., 2004, 562, 261–265 CrossRef CAS.
- B. L. Frey, C. E. Jordan, S. Kornguth and R. M. Corn, Anal. Chem., 1995, 67, 4452–4457 CrossRef CAS.
- J. H. Fendler, Chem. Mater., 1996, 8, 1616–1624 CrossRef CAS.
- J. Schmitt, G. Decher, W. J. Dressick, S. L. Brandow, R. E. Geer, R. Shashidhar and J. M. Calvert, Adv. Mater., 1997, 9, 61–65 CrossRef CAS.
- J. D. Fisk, M. Rooth and A. M. Shaw, J. Phys. Chem. C, 2007, 111, 2588–2594 CrossRef CAS.
- M. Rooth and A. M. Shaw, J. Phys. Chem. C, 2007, 111, 15363–15369 CrossRef CAS.
- Z. Adamczyk, J. Colloid Interface Sci., 2000, 229, 477–489 CrossRef CAS.
- A. J. Haes, S. L. Zou, G. C. Schatz and R. P. Van Duyne, J. Phys. Chem. B, 2004, 108, 109–116 CrossRef CAS.
- T. E. Hannon, S. W. Chah and R. N. Zare, J. Phys. Chem. B, 2005, 109, 7435–7442 CrossRef CAS.
- W. B. Martin, S. Mirov, D. Martyshkin, R. Venugopalan and A. M. Shaw, J. Biomed. Opt., 2005, 10, 024025 CrossRef.
- R. Haselberg, L. van der Sneppen, F. Ariese, W. Ubachs, C. Gooijer, G. J. de Jong and G. W. Somsen, Anal. Chem., 2009, 81, 10172–10178 CrossRef CAS.
- L. van der Sneppen, C. Gooijer, W. Ubachs and F. Ariese, Sens. Actuators, B, 2009, 139, 505–510 CrossRef.
- H. V. Powell, M. Schnippering, M. Cheung, J. V. Macpherson, S. R. Mackenzie, V. Stavros and P. R. Unwin, ChemPhysChem, 2010, 11, 2985–2991 CrossRef CAS.
- A. C. R. Pipino, Appl. Opt., 2000, 39, 1449–1453 CrossRef CAS.
- I. M. P. Aarts, A. C. R. Pipino, M. de Sanden and W. M. M. Kessels, Appl. Phys. Lett., 2007, 90, 161918 CrossRef.
- S. E. Fiedler, A. Hese and A. A. Ruth, Rev. Sci. Instrum., 2005, 76, 023107 CrossRef.
- L. N. Seetohul, Z. Ali and M. Islam, Anal. Chem., 2009, 81, 4106–4112 CrossRef CAS.
- L. N. Seetohul, Z. Ali and M. Islam, Analyst, 2009, 134, 1887–1895 RSC.
- S. R. T. Neil, DPhil thesis Development of Novel Cavity-Based Spectroscopic Techniques for use in Probing Condensed Phase and Interfacial Systems, Oxford, in preparation Search PubMed.
| This journal is © The Royal Society of Chemistry 2011 |
