Detailed product analysis during the low temperature oxidation of n-butane†
Olivier
Herbinet
a,
Frédérique
Battin-Leclerc
*a,
Sarah
Bax
a,
Hervé Le
Gall
a,
Pierre-Alexandre
Glaude
a,
René
Fournet
a,
Zhongyue
Zhou
b,
Liulin
Deng
b,
Huijun
Guo
b,
Mingfeng
Xie
b and
Fei
Qi
b
aLaboratoire Réactions et Génie des Procédés, CNRS, Nancy Université, ENSIC, 1, rue Grandville, BP 20451, 54001 Nancy Cedex, France. E-mail: Frederique.Battin-Leclerc@ensic.inpl-nancy.fr; Fax: 33 3 83 37 81 20; Tel: 33 3 83 17 51 25
bNational Synchrotron Radiation Laboratory, University of Science and Technology of China, Hefei, Anhui 230029, P. R. China
First published on 28th October 2010
Abstract
The products obtained from the low-temperature oxidation of n-butane in a jet-stirred reactor (JSR) have been analysed using two methods: gas chromatography analysis of the outlet gas and reflectron time-of-flight mass spectrometry. The mass spectrometer was combined with tunable synchrotron vacuum ultraviolet photoionization and coupled with a JSRvia a molecular-beam sampling system. Experiments were performed under quasi-atmospheric pressure, for temperatures between 550 and 800 K, at a mean residence time of 6 s and with a stoichiometric n-butane/oxygen/argon mixture (composition = 4/26/70 in mol%). 36 reaction products have been quantified, including in addition to the usual oxidation products, acetic acid, hydrogen peroxide, C1, C2 and C4 alkylhydroperoxides and C4 ketohydroperoxides. Evidence of the possible formation of products (dihydrofuranes, furanones) derived from cyclic ethers has also been found. The performance of a detailed kinetic model of the literature has been assessed with the simulation of the formation of this extended range of species. These simulations have also allowed the analysis of possible pathways for the formation of some obtained products.
Introduction
Tunable synchrotron vacuum ultraviolet (SVUV) photoionization mass spectrometry combined with molecular-beam sampling has been proven to be a successful method to probe combustion under laboratory conditions.1,2 A recent paper3 has shown that this detection method can also be used to detect intermediates in a quartz jet-stirred reactor (JSR) and to give new clues about gas-phase reactions. This new type of apparatus has been used to study the low-temperature oxidation of n-butane and to detect the formation of hydroperoxides, which are postulated as chain branching agents in all the kinetic models for the low temperature oxidation of alkanes.SVUV photoionization mass spectrometry is a very powerful method for the identification of molecules and radicals.1,2 Knowing the molecular weight and ionization thresholds allows the identification of the dominant intermediates through comparison of the experimental ionization thresholds with those obtained from literature, e.g. from NIST online database4 and from many previous calculations. For the candidate intermediates with unknown ionization energies (IEs), high-level ab initio theoretical methods can be used for IE estimation. However isomers having similar IEs can be difficult to distinguish and quantification relies on photoionization cross sections which are known only for a few species. Identification using gas chromatography (GC) relies on retention times and on mass spectra obtained with a 70 eV electronic impact ionization. This energy allows an important fragmentation of the analysed species, which makes the distinction of isomers easier. Flame ionization detection (FID) can be used for quantification (with uncertainties of about 10%), even for species which are not available for calibration.5 However, reactions occurring during sampling, injection and separation in the column of the gas chromatograph prevent this last method to be used for the analysis of unstable molecules and radicals. The purpose of the present study is to use both SVUV photoionization mass spectrometry and gas chromatography to investigate in detail the low temperature reaction products of the oxidation of n-butane, under the same conditions as those under which hydroperoxides have previously been identified.3
n-Butane is the smallest alkane which presents a gas-phase chemistry similar to that of the larger alkanes present in gasoline and diesel fuels. Apart from work performed in static reactors in the 1970s,6 rapid compression machines7–10 and a shock tube,10 the low-temperature (below 800 K) oxidation of n-butane has not been extensively investigated. The focus of the short paper by Battin-Leclerc et al.3 was only to give evidence of the formation of hydroperoxide species under conditions close to those observed prior to auto-ignition.
The present paper aims at presenting a very detailed analysis of the products obtained during the low-temperature oxidation of n-butane.
Experimental
Experiments have been performed using two similar spherical quartz jet-stirred reactors operating at constant temperature and pressure. This type of reactor is well adapted for kinetic studies, because the gas phase inside the reactor is well stirred and concentration is homogenous11 with a limited effect of possible wall reactions.12 The stirring is achieved by four turbulent jets located at the center of the sphere. As shown in Fig. S1 of the ESI,† both JSRs consist of a quartz sphere (diameter ≈ 56 mm, volume ≈ 90 cm3, made in France), which is attached to a quartz annular preheating zone in which the temperature of the gases is increased up to the reactor temperature. The gas mixture residence time inside the annular preheater is very short compared to its residence time inside the reactor (about a few percent). Both the spherical reactor and the annular preheating zone are heated by the means of Thermocoax resistances rolled up around the wall. The reaction temperature was measured with a thermocouple located inside the intra-annular space of the preheating zone; its extremity is on the level of the injection jets.One of the JSRs was used at the National Synchrotron Radiation Laboratory (NSRL) in Hefei (China) and coupled via a molecular beam with a NSRL's reflectron time-of-flight mass spectrometer. The second one was used at the Laboratoire Réactions et Génie des Procédés in Nancy (France) where the outlet gas was analysed by gas chromatography.
JSR and SVUV photoionization mass spectrometry (Hefei)
A schematic diagram of the experimental instrument is shown in Fig. 1. The instrument consists of the jet-stirred reactor, a differentially pumped chamber (I) with a molecular-beam sampling system, and a photoionization chamber (II) with a homemade reflectron time-of-flight (RTOF) mass spectrometer (MS) for ion detection.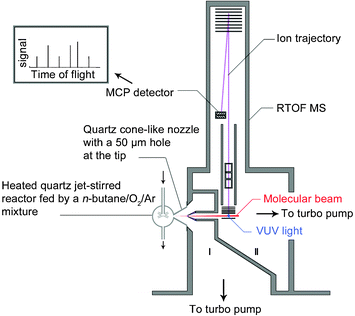 | ||
| Fig. 1 Schematic diagram of the instrument including the heated quartz jet-stirred reactor, the differential pumped chamber (I) with a molecular-beam sampling system, and the photoionization chamber (II) with the reflectron time-of-flight mass spectrometer. | ||
A pulsed voltage of 346 V was used to propel ions into the flight tube, and finally to a multichannel plate (MCP) detector. The total length of the ion flight is 1.8 m. The ion signals were amplified by a pre-amplifier (VT120C, EG&G ORTEC, USA). The mass resolution (m/Δm) was measured to be ∼2000. A digital delay generator (DG535, Stanford Research System, USA) was used to trigger the pulse power supply and to feed as the start of a multiscaler with a repetition ratio of 18![[thin space (1/6-em)]](https://www.rsc.org/images/entities/char_2009.gif) 000 Hz. The multiscaler (FAST Comtec P7888, Germany) was used to record signals of the mass spectrum with 2 ns bin width. A small bias voltage (1.0 V) was added to improve the signal intensity, reduce the background ions, and enhance mass resolution.15
000 Hz. The multiscaler (FAST Comtec P7888, Germany) was used to record signals of the mass spectrum with 2 ns bin width. A small bias voltage (1.0 V) was added to improve the signal intensity, reduce the background ions, and enhance mass resolution.15
The mole fractions were derived from ion signals using the method proposed by Cool et al.16 and described in the ESI.†
The gases used in Hefei were provided by Dalian Guangming Special Gas Products (purity of +99%). Gas flows were controlled by MKS mass flow controllers.
JSR and gas chromatography (Nancy)
The same type of reactor has also been recently used to study the oxidation of large alkanes17 and esters.18 The reaction products were analyzed online using three gas chromatographs using a heated inert transfer line (T = 423 K). The first gas chromatograph was fitted with a carbosphere packed column and two detectors: a thermal conductivity detector (TCD) for oxygen and carbon oxides and a flame ionization detector (FID) for C1–C2hydrocarbons. Helium was used as carrier gas. The use of helium was beneficial for the quantification of oxygen (very high sensitivity), but not for hydrogen which was not quantified. The second gas chromatograph was fitted with a HP Plot Q column and a FID to analyse other species. Helium was again used as carrier gas. Identification and calibration of gaseous species were performed by injecting standard gaseous mixtures provided by Air Liquide and Messer. The identification of species was also performed with a third on-line gas chromatograph also fitted with a HP plot Q column, but coupled with a mass spectrometer. The mass spectra of all identified reaction products were included in the spectra database “NIST 08”. The quantification of the species which were not available for calibration has been performed by using the effective carbon method. This method is based on the response of the detector (FID) as a function of the molecule structure.5 While water, hydrogen peroxides and C1 oxygenated species (formaldehyde, methanol, formic acid) were identified as products, it was not possible to quantify them. The limit of detection for the FID was about 0.1 ppm regardless of the hydrocarbon species. For the TCD, the limit of detection depended on the thermal conductivities of the carrier gas and of the solutes. Estimated uncertainties of the species mole fractions were about ±5% with the online analysis of oxygen and C1–C2hydrocarbons and about ±10% for the analysis of other species.The gases used in Nancy were provided by Messer (purity of 99.95%). Gas flows were controlled by Bronkhorst mass flow controllers.
Results
The two configurations described above were used to study the oxidation of n-butane between 550 and 800 K, under quasi-atmospheric pressure (0.105 MPa), at a mean residence time of 6 s and for a stoichiometric n-butane/oxygen/argon mixture (mole composition = 4/26/70 in%). The oxygen/inert gas ratio was set slightly below the ratio in air to obtain the largest amounts of products without the occurrence of strong thermal phenomena.Consumption of reactants and formation of carbon oxides and water
Fig. 2 and 3 display the evolution with temperature of the experimental mole fractions of n-butane, oxygen and carbon oxides, obtained in both configurations. In Hefei, water was also detected.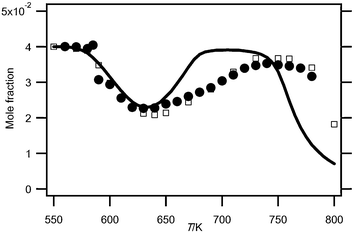 | ||
| Fig. 2 Evolution with temperature (T) of the experimental (black circles for the data obtained by RTOF-MS, white squares for those obtained by GC) and simulated (full line) mole fractions of n-butane. | ||
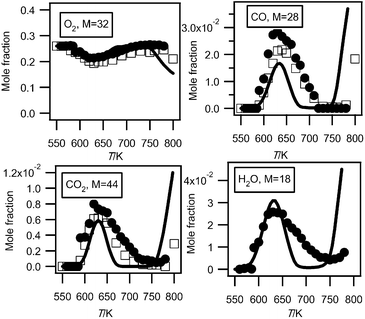 | ||
| Fig. 3 Evolution with temperature of the experimental (black circles for the data obtained by RTOF-MS, white squares for those obtained by GC) and simulated (full line) mole fractions of oxygen, carbon oxides and water (M in g mol−1). | ||
The SVUV photoionization mass spectrometry data of these five species were obtained with a photon energy of 16.20 eV.
Fig. 2 and 3 show that there is very good agreement between both types of experimental data for the consumption of both reactants over the whole temperature range.
There could be some more significant temperature gradients inside the reactor used in Hefei compared to that of Nancy. Due to the presence of the cone it is more difficult to heat the sphere using Thermocoax resistances. For future studies using this apparatus, a better design of the heating system in presence of the cone will be investigated.
The volume of the reactors used in Nancy and in Hefei is slightly different due to the presence of the cone. That implies that the residence time is slightly shorter in the Hefei vessel. Experiments at 590 K show a marked evolution of the reactivity versus residence time with a start of the reaction at about 4 s. However experiments at 640 K, in the negative temperature coefficient zone, show only a small influence of this parameter when residence time varies from 2 to 8 s. In spite of differences in the temperature gradient and residence time, there is a good agreement between both configurations.
Fig. 3 presents mole fractions of carbon oxides and water calibrated using the argon mole fraction at 630 K (the temperature at which the formation of carbon oxides is at its maximum). The photoionization cross section of argon was taken from Samson and Stolte.19 At mass 28, the signal from CO+ ions has been deconvoluted from that of C2H4+ ions. At mass 44, the signal from CO2+ ions has been deconvoluted from that of CH3CHO+ ions. The photoionization cross sections of carbon monoxide, carbon dioxide, and water were taken from Samson and Gardner,20 Shaw et al.21 and Haddad and Samson,22 respectively. The H2O signals have been corrected for background contributions by subtraction of the signal at mass 18 measured below 590 K. The shapes of the carbon oxides profiles measured both in Nancy and in Hefei are in very good agreement. However there is a 28% deviation for the maximum mole fraction of carbon monoxide and a 16% deviation for that of carbon dioxide. The larger deviation for carbon monoxide could be due to a larger uncertainty in the photoionization cross section at this energy.20 Note that while it is an important indicator of reactivity, few analyses of H2O have been presented in the case of the low-temperature oxidation of hydrocarbons.
Formation of C1–C3 organic compounds
Table 1 summarizes the data corresponding to the observed C1–C3 organic compounds in this study: their experimental ionisation energies (IEexp.) compared to values of the literature (IElit.) and their mole fractions at 630 K obtained in both configurations. As shown in Fig. 2, 630 K is the temperature for which the maximum reactivity is obtained.| Species | Mass/g mol−1 | IEexp./eV | IElit.4/eV | Mole fraction at 630 K (Hefei) | Mole fraction at 630 K (Nancy) |
|---|---|---|---|---|---|
| Methane | 16 | — | 12.61 | — | 5.61 × 10⁻⁵ |
| Acetylene | 26 | — | 11.41 | — | 1.01 × 10⁻⁶ |
| Ethylene | 28 | 10.57 | 10.51 | Used as reference at 11 eV | 8.87 × 10⁻⁴ |
| Ethane | 30 | — | 11.52 | — | 3.61 × 10⁻⁶ |
| Formaldehyde | 30 | 10.9 | 10.88 | 5.88 × 10⁻³ | — |
| Methanol | 32 | 10.9 | 10.84 | 3.07 × 10⁻³ | — |
| Propene | 42 | 9.75 | 9.73 | 1.26 × 10⁻⁴ | 1.09 × 10⁻⁴ |
| Acetaldehyde | 44 | 10.25 | 10.23 | 6.83 × 10⁻³ | 3.97 × 10⁻³ |
| Ethylene oxide | 44 | — | — | — | 1.26 × 10⁻⁴ |
| Ethanol | 46 | 10.55 | 10.48 | 1.56 × 10⁻⁴ | 2.26 × 10⁻⁴ |
| Acrolein | 56 | — | 10.11 | — | 1.81 × 10⁻⁴ |
| Acetone | 58 | 9.8 | 9.70 | 3.67 × 10⁻⁴ | 8.78 × 10⁻⁴ |
| Propanal | 58 | 9.8 | 9.96 | — | 2.47 × 10⁻⁴ |
| Acetic acid | 60 | 10.7 | 10.69 | 1.39 × 10⁻³ | 1.19 × 10⁻³ |
Except for acetic acid and acrolein, all the C1–C3 organic compounds observed in this study are those which are commonly analysed for alkanes at low temperature (e.g., Dagaut et al.23 in the case of n-heptane). The figures showing the profiles of the mole fractions of these products are presented in the ESI (see Fig. S3 to S5).†
Ethylene and propene were measured in both configurations. Methane, acetylene and ethane have only been measured in Nancy. Ethylene and propene have been analyzed at photon energies of 11.00 and 10.00 eV, respectively. Since no species analyzed at 11.00 eV can be used for calibration (the signal due to n-butane (m/z = 58) is poor at this energy), the mole fraction of ethylene at 630 K measured by gas chromatography has been used to calibrate all the compounds analyzed at the energy of 11.00 eV. Mole fractions of propene have been calibrated using the maximum mole fraction of the sum of the two butene isomers which are among the major reaction products measured in Nancy at 630 K (see Fig. 8). Photoionization cross sections of propene and 1-butene were taken from Cool et al.24 and Wang et al.,25 respectively. The shapes of the profiles obtained in both configurations are in very good agreement for ethylene. Some discrepancies are obtained for the profiles of propene from 670 to 750 K, but the quantitative agreement is good on the average. The contribution of ketene (IE = 9.62 eV4) at mass 42 has been observed (see Fig. S6 of the ESI†) for temperatures up to about 630 K. Below this temperature, propene and ketene can be differentiated. At higher temperatures, the contribution of propene becomes much larger than that of ketene.
Acetaldehyde, acetone, ethanol and acetic acid were obtained in both configurations, while formaldehyde and methanol have only been observed by RTOF-MS. The observation of C1 oxygenated products is always difficult with gas chromatography with FID. Ethylene oxide, acrolein (see Fig. 4) and propanal have only been observed by GC.
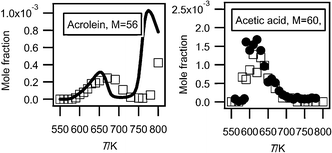 | ||
| Fig. 4 Evolution with temperature of the experimental (black circles for the data obtained by RTOF-MS, white squares for those obtained by GC) and simulated (full line) mole fractions of acrolein and acetic acid (M in g mol−1). | ||
Formic acid has been detected in both configurations. A large peak of formic acid is shown by gas chromatography with mass spectrometry detection, but since no response is obtained by FID, it could not be quantified.
To confirm the identification of formic acid, acetaldehyde, acetone, ethanol, and acetic acid, an experimental sweeping of photon energies from 8.50 to 11.50 eV has been made. As shown in Table 1, the obtained experimental IEs were well in agreement with those reported by NIST.4 No increment in IE has been observed at mass 44 corresponding to ethylene oxide. The experimental IE of the peak at mass 58 is closer to that of acetone than that of propanal (see Table 1). Allylalcohol (IE = 9.7 eV) could also be a possibility for this mass, but the formation of this compound is less probable.
C1–C2aldehydes and alcohols have been analyzed at a photon energy of 11.00 eV. Their photoionization cross-sections at this energy are available in the literature (Osswald et al.26 for formaldehyde, Cool et al.23 for acetaldehyde, Cool et al.27 for alcohols). For products which have been analysed in both configurations, the shapes of both obtained profiles are in very good agreement. At 630 K, the quantitative deviation between the mole fractions measured in Hefei and Nancy for these oxygenated products is about 50%. Note that ethylene oxide contributes with acetaldehyde to the signal at mass 44, but as shown by the GC measurements, its mole fraction is about only 5% of that of the aldehyde.
Acetone has been analyzed at a photon energy of 10.00 eV and its photoionization cross-section at this energy is available.27 The mole fractions of this compound have been calibrated using the maximum mole fraction of butene isomers measured in Nancy at 630 K (Fig. 8). While the shapes of the profiles obtained in both configurations are in rather good agreement, there is a factor of about 2.5 between the two sets of mole fractions. This is the species for which the deviation between the two sets of data is the largest.
Fig. 4 presents the mole fraction of acetic acid. It has been analyzed at a photon energy of 11.00 eV and its photoionization cross section has been estimated as equal to that of acetaldehyde. Such estimation involves a large uncertainty factor, close to a factor of 2. There is very good agreement between the profiles obtained in both configurations. Acetic acid was not identified in other investigations of the low-temperature oxidation of alkanes (e.g. Dagaut et al.23).
Formation of hydrogen peroxide
Fig. 5 shows the evolution with temperature of the experimental mole fractions of hydrogen peroxide, which has only been measured in Hefei. As shown in Table 1, the obtained experimental IE (10.65 eV) is in good agreement with that reported (10.58 eV).4Hydrogen peroxide has been analyzed at a photon energy of 11.00 eV and its photoionization cross section has been estimated to be 8.58 Mb (1 Mb = 10−18 cm2) using the correlation proposed by Koizumi.28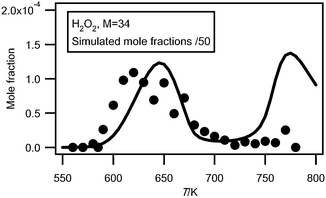 | ||
| Fig. 5 Comparison between the evolution with temperature of the experimental (black circles) and simulated (full line) mole fractions of H2O2 (M in g mol−1). | ||
The error on the experimental mole fractions due to the estimated photoionization cross section can be up to a factor of 2. While this compound is an important intermediate in the mechanism of oxidation of hydrocarbons, there is a great lack of data concerning the analysis of this species in combustion systems.
Formation of C4hydrocarbon products
Fig. 6 presents a typical experimental mass spectrum obtained at a photon energy of 10.00 eV. There is a minimal amount of ion fragmentation. The peaks appearing at odd masses have been attributed to ion fragments. It has not been possible to prove the presence of radical species, even for HO2 radicals. However the mole fractions of the HO2 radicals were expected to be above the detection limit (about 1 ppm) of the mass spectrometer.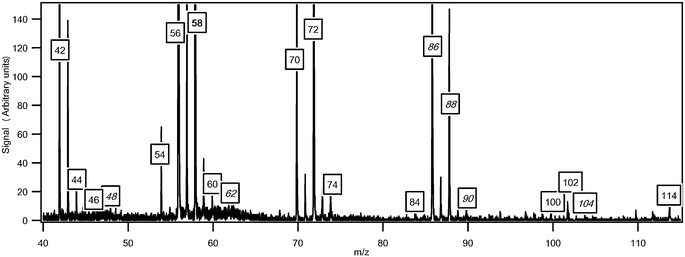 | ||
| Fig. 6 Typical mass spectrum obtained for the oxidation of n-butane (in g mol−1). The temperature in the reactor was 630 K and the photon energy was 10.0 eV. The masses in italics have been discussed in previous papers.3,33 Unlabeled peaks at odd masses correspond to fragments. | ||
Fig. 6 also shows that one of the highest peaks, apart from that at mass 58, is at mass 56 which corresponds to a major type of reaction product: the butenes. A smaller peak is also obtained at mass 54 likely corresponding to a diunsaturated C4hydrocarbon.
Fig. 7 presents the results of an experimental sweeping of photon energies from 8.50 to 11.50 eV. Fig. 7(a) shows the comparison of the obtained experimental PIE curve for mass 54 and the PIE spectrum of pure 1,3-butadiene.27 The remarkable near-equivalence of the two curves confirms the existence of 1,3-butadiene. For mass 56, two successive IEs were obtained: the first one at 9.12 eV which corresponds to 2-butene (IE = 9.11 eV4) and the second and larger one at 9.62 eV which corresponds to 1-butene (IE = 9.55 eV4). To confirm these conclusions, the obtained experimental PIE curve for mass 56 is compared to the PIE spectra of pure 1-butene and cis-2-butene25 (the PIE spectrum of acrolein is not available in the reference). A weighted sum of the 1-butene and cis-2 butene is in excellent agreement with the obtained experimental PIE curve below 10 eV. The difference observed above 10.1 eV could be caused by the contribution from acrolein.
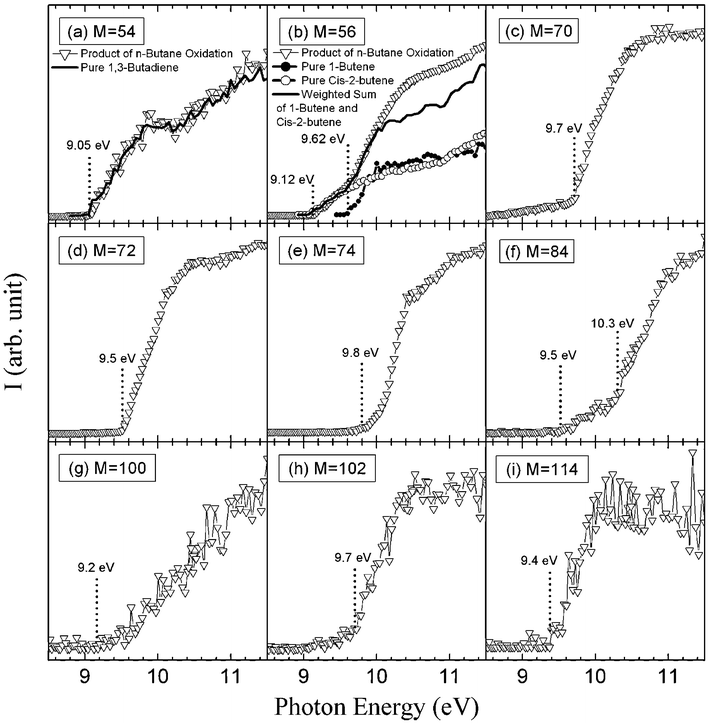 | ||
| Fig. 7 Photoionization efficiency spectraversusphoton energy (E) of mass 54, 56, 70, 72, 74, 84, 88, 100, 102 and 114 (g mol−1) sampled from the reactor. The temperature in the reactor was 630 K. (a) Comparison of the observed PIE curve for mass 54 and PIE spectrum of 1,3-butadiene. (b) Comparison of the observed PIE curve for mass 56 and PIE spectra of 1-butene and cis-2-butene. | ||
Fig. 8 compares the evolution with temperature of the experimental mole fractions of the sum of butenes and of 1,3-butadiene obtained in both configurations. The results obtained in Nancy allow the distinction between 1-butene, which is the most abundant isomer (a factor of about 2), and 2-butene. According to the results obtained in Nancy, the formation of acrolein would represent about 10% of that of the sum of butenes. Butenes are the most abundant species observed at 10.00 eV with a well known photoionization cross section. Fig. 8 presents the mole fraction of the sum of butenes calibrated using the value measured in Nancy at 630 K. This value has been used to calibrate all the other compounds measured at 10.00 eV (apart from hydroperoxide species), and especially 1,3-butadiene (the photoinization cross section was taken from Cool et al.27). The shapes of the profiles obtained in both configurations for the sum of butenes and 1,3-butadiene are in good agreement. The two sources of data agree quantitatively for the mole fraction of 1,3-butadiene. Butenes and 1,3-butadiene were also observed by Chakir et al.29 in their study of the oxidation of n-butane in a jet-stirred reactor at higher temperatures.
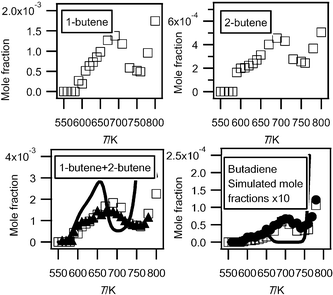 | ||
| Fig. 8 Evolution with temperature of the experimental (black circles for the data obtained by RTOF-MS (black triangles for butenes, the mole fraction of which has been normalized by its maximum mole fraction obtained by GC), white squares for those obtained by GC) and simulated (full line) mole fractions of C4 unsaturated hydrocarbons (M in g mol−1). | ||
Formation of C4 mono-oxygenated products
Another important group of masses in Fig. 6 is at masses 70, 72 and 74. Fig. 7 shows that the obtained experimental IE was 9.50 eV for mass 72, which can correspond to butanone (IE = 9.52 eV4), tetrahydrofuran (IE = 9.40 eV4) and 2-methyl-oxetane (IE = 9.57 eV (theoretical calculations)). The IEs of other possible compounds are higher: 9.82 eV for butanal,4 10.15 eV for 2-ethyl-oxirane4 and 9.98 eV for 2,3-dimethyl-oxirane.4 When IE values were not available in the literature,4 zero-point energy corrected adiabatic ionization energies have been calculated from the composite CBS-QB3 method30 using Gaussian03.31 The mean absolute error of CBS-QB3 for the G2 test is less than 0.05 eV. For compounds which can involve hydrogen bonds, the lowest energy conformers were searched systematically.Gas chromatography analysis has allowed the separation of seven C4H8O isomers: butanone, butanal, tetrahydrofuran, 2-methyl-oxetane, 2-ethyl-oxirane, 2,3-dimethyl-oxirane (cis and trans isomers have been separated) and butenol. Note that we have been able to detect cyclic ethers with rings of three different sizes, while Dagaut et al.23 only detected furans in the case of the low-temperature oxidation of n-heptane. This is important for the validation of kinetic data for the formation of these species. The evolution with temperature of the experimental mole fractions of these compounds is presented in Fig. 9.
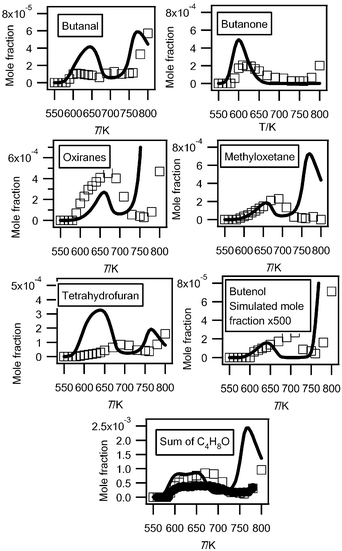 | ||
| Fig. 9 Comparison between the experimental (black circles for the data obtained by RTOF-MS, white squares for those obtained by GC) and the simulated (full line) mole fractions of each possible C4H8O (M = 72 g mol−1) products and of their sum. For oxiranes, the sum of the mole fractions of dimethyloxiranes and of ethyloxiranes has been plotted. | ||
Fig. 9 also compares the evolution with temperature of the experimental sum of the mole fractions of the C4H8O products obtained in both configurations. Since the major C4H8O products obtained have IEs close to that of tetrahydrofuran, we have calibrated the mole fraction of the sum of these compounds using the maximum mole fraction of butenes measured in Nancy at 630 K and the photoionization cross section of tetrahydrofuran. The shapes of the profiles obtained in both configurations are in good agreement. The deviation at the maximum mole fraction is smaller than a factor of two.
Fig. 7 shows that the main obtained experimental IE was 9.70 eV for mass 70, which corresponds to butenone (IE = 9.70 eV (theoretical calculation)) or to butenal (IE from 9.65 to 9.75 eV4). Fig. 10 presents the experimental mole fractions obtained for butenone and butenal in Nancy, as well as S70/FKT (obtained at an energy of 10 eV) according to the results obtained in Hefei. The profile of the signal at mass 70 is in very good agreement with that of the mole fraction of butenone obtained in Nancy.
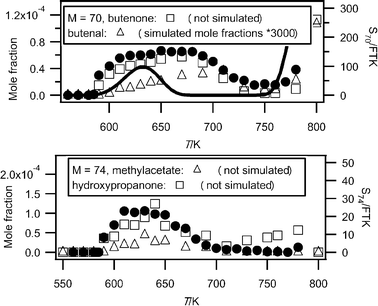 | ||
| Fig. 10 Comparison between the experimental signals (black circles, in arbitrary units) obtained by RTOF-MS, the experimental mole fractions (white squares) measured by GC) and the simulated (full line) mole fractions for products of mass 70 and 74 (M in g mol−1). | ||
Fig. 7 shows that the obtained experimental IE was 9.80 eV for mass 74, which corresponds to 2-butanol (IE = 9.88 eV4), 1-butanol (IE = 9.99 eV4) or hydroxypropanone (IE = 10 eV4). In Nancy, the formation of butanols was not observed, but hydroxypropanone and methyl acetate (IE = 10.25 eV4) have been quantified, and traces of propanoic acid (IE = 10.44 eV4) have been detected. Fig. 10 presents the experimental mole fractions obtained for methyl acetate and hydroxypropanone in Nancy, as well as S74/FKT (obtained at an energy of 10.00 eV) according to the results obtained in Hefei. Below 700 K, the profile of the signal at mass 74 has the same shape as that of the mole fraction of hydroxypropanone obtained by GC. According to the results of Nancy, the formation of hydroxypropanone would be much larger than that of methyl acetate.
Fig. 7 shows that another product at mass 70, but with a smaller contribution, seems to have an experimental IE below 8.50 eV. Note that no ketone, aldehyde or alcohol of the same size as the reactant was detected by Dagaut et al.23 in the corresponding case of the low-temperature oxidation of n-heptane.
Theoretical calculations show the IE of 2,3-dihydrofuran to be equal to 8.38 eV. A calculation performed at the CBS-QB3 level of theory does not permit the isolation of a minimum on the potential energy surface. But there is a transition state with an imaginary frequency associated with a torsion of the cycle. By adding diffuse functions in the original basis set (cbsb7) used in the geometry optimization and frequency calculations of the CBSQB3 method, we obtained a minimum with a difference of 0.2 eV between the two molecular structures. This unsaturated ether could derive from tetrahydrofuran by H-abstraction followed by a reaction with oxygen molecule, as shown in Fig. 11. This result is of particular interest since, to our knowledge, products derived from secondary reactions of cyclic ethers have never been observed.
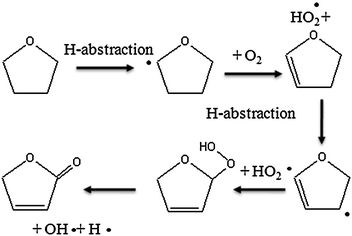 | ||
| Fig. 11 Possible pathways of consumption of cyclic ethers. | ||
Tentative quantification of hydroperoxides
The mass spectrum in Fig. 6 includes small peaks corresponding to alkylhydroperoxides: 48 (methylhydroperoxide, CH3OOH), 62 (ethylhydroperoxide, C2H5OOH), 90 (butylhydroperoxides, C4H9OOH), and 104 (ketohydroperoxides (C4H8O3)). Note the absence of a peak at mass = 76, which corresponds to propylhydroperoxide, C3H7OOH. The formation of hydroperoxides is a very important pathway postulated in all kinetic models for the low temperature oxidation of alkanes: the evidence supporting the identification of these species has been discussed in detail in a previous paper3 and will not be repeated. While these compounds have a significant kinetic role, before the work by Battin-Leclerc et al.3 there has been only limited evidence of their formation in combustion systems.32 Note that peaks corresponding to hydroperoxides are very small in Fig. 6. In order to maximize the formation of other interesting products, this mass spectrum was obtained at 630 K, a temperature too high for hydroperoxides to be observed in large amounts. The presence of these species in the gas samples has been searched by gas chromatography without success, whatever the analytical conditions used.Since it has been shown that the IEs of C4H9OOH and C4H8O3 (between 9.3 and 9.4 eV3) were very close to that of tetrahydrofuran, we can assume that these three species also have similar photoionization cross-sections. Fig. 12 presents mole fractions of these species analyzed at an energy of 10.00 eV and calibrated using the maximum mole fraction of butenes measured in Nancy at 590 K. Note that while ketohydroperoxides are usually considered as the main chain branching agents in the mechanisms of the low-temperature oxidation of hydrocarbons, the maximum mole fraction of butylhydroperoxides is about four times larger than that of ketohydroperoxides.
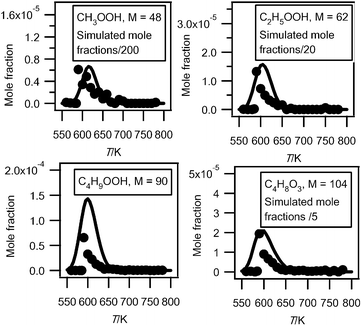 | ||
| Fig. 12 Comparison between the experimental (black circles) and the simulated (full line) mole fractions of hydroperoxides (M in g mol−1). | ||
Fig. 12 also presents the mole fractions of methylhydroperoxide and ethylhydroperoxide analyzed at an energy of 10.00 eV and calibrated using the maximum mole fraction of butenes measured in Nancy at 590 K. Their photoionization cross-sections have been estimated using the correlation proposed by Koizumi.28
Formation of C4 di-oxygenated products other than butylhydroperoxides
As shown in Fig. 6, two important products are at mass 86 and 88. As discussed previously,33 these masses correspond to products which could be derived from C4 ketohydroperoxides: C4 molecules including either two carbonyl groups or one carbonyl and one alcohol (hydroxybutanone) functions. These products have been analyzed at a photon energy of 10.00 eV and their photoionization cross section has been taken as equal to that of tetrahydrofuran, as they have close IE.Fig. 13 presents the evolution with temperature of the experimental mole fraction of these products obtained in both configurations at mass 88 and only in Hefei for that at mass 86. The formation of two possible species (2,3-butadione and dihydrofuranone) corresponding to mass 86 have been observed in Nancy, but without the possibility of quantification. The IE of 2,3-butadione (between 9.23 and 9.3 eV4) is compatible with that of one mass 86 species measured in Hefei (9.25 and 9.55 eV33). Dihydrofuranone (γ-butyrolactone, EI > 10 eV4) has not been seen in Hefei likely due to a too low concentration. As shown in Fig. 11, the formation of dihydrofuranone could be derived from the addition to oxygen of the radicals obtained by H-abstractions from tetrahydrofuran.
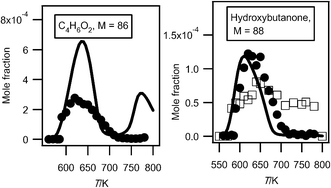 | ||
| Fig. 13 Comparison between the experimental (black circles for the data obtained by RTOF-MS and white squares for those obtained by GC) and the simulated (full line) mole fractions of C4H6O2 and C4H8O2 products including 2 oxygen atoms (other than butylhydroperoxides) (M in g mol−1). | ||
The formation reactions of molecules including two carbonyl groups or molecules with one carbonyl and one alcohol, both of which can be derived from ketohydroperoxides, are shown in Fig. 14. Ketohydroperoxides react by decomposition of the O–OH bond to give alkoxy radicals. Subsequently breaking a C–H bond can lead either to the formation of a second carbonyl group, or by disproportionation with HO2 radicals (or to a minor extent by H-abstraction with the reactant) to yield an alcohol function.
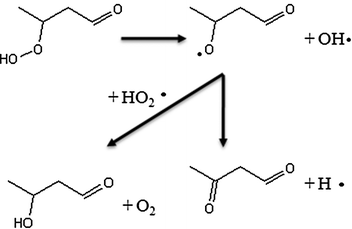 | ||
| Fig. 14 Examples of pathways of formation of C4 molecules including either two carbonyl groups or one carbonyl and one alcohol starting from a C4 ketohydroperoxide molecule. | ||
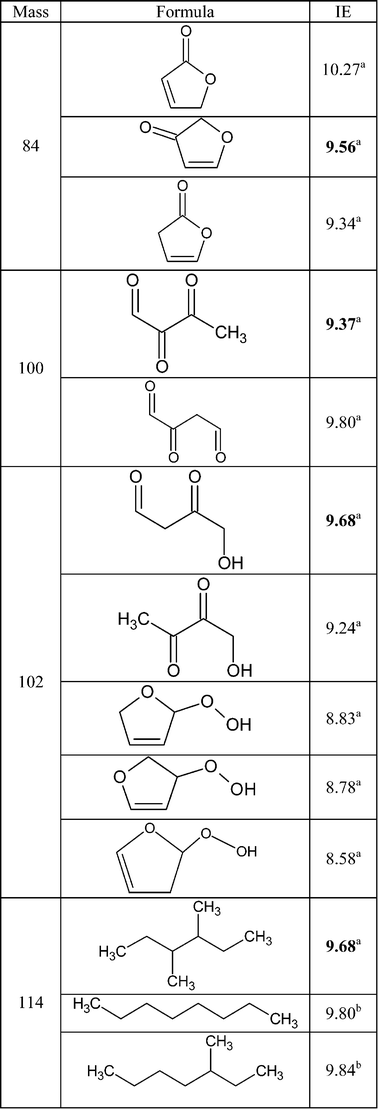
Fig. 6 also shows a smaller peak at mass 84. Fig. 7 shows that there are probably two products contributing to the experimental IE at this mass: a first one at 9.50 eV and a second one at 10.30 eV. As shown in Table 2, this could correspond to furanones with the carbonyl group conjugated to the double bond. As shown in Fig. 11, these products could be derived from dihydrofurans by H-abstraction followed by a combination with HO2 radicals and the decomposition of the obtained hydroperoxides. Furanones with the carbonyl group conjugated to the double bond would be obtained because resonance stabilized radicals are the ones that mainly react by combinations. Other radicals are more likely to add to oxygen molecules. Fig. 15 presents the experimental evolution with temperature of the signal at mass 84.
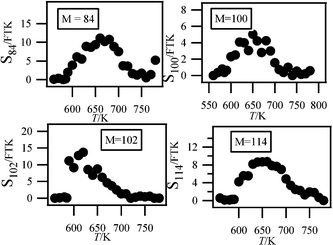 | ||
| Fig. 15 Experimental signals of the minor species detected in Heifei. | ||
Other minor species
Two peaks are also present in Fig. 6 at mass 100 and 102, which could correspond to C4 compounds including three oxygen atoms. Fig. 7 shows that the experimental ionization energy is 9.20 eV for mass 100, which could correspond to 2,3-dione-butanal, and 9.70 eV for mass 102, which could correspond to 2,3-dione-butanol. These products could certainly be derived from the secondary reactions of ketohydroperoxides. Note that another product at mass 102, but with a smaller contribution, seems to have an experimental IE below 9 eV. This could correspond to dihydrofuranhydroperoxides obtained from dihydrofuran by H-abstraction followed by a combination with HO2 radicals.A last small peak is obtained at mass 114, with an experimental IE of 9.40 eV. The most expected product at this mass would be 3,4-dimethylhexane which could easily be obtained by the combination of two 2-butyl radicals. However, the calculated IE is 9.68 eV.
Fig. 15 displays the experimental evolution with temperature of the signal of these three very minor products. They have been observed at an energy of 10.00 eV, but their photoionization cross sections are not available.
Traces of acetonylacetate were detected in Nancy. However, while a very weak signal could be obtained at Hefei for mass 116, the corresponding IE (9.50 eV) is different from that calculated for acetonylacetate (10.08 eV).
Discussion
The previous sections describe the quantification of 36 reaction products of the oxidation of n-butane: water, hydrogen peroxide and 34 carbon containing compounds. The selectivities (in C atom) of these carbon containing species are presented in Fig. 16 at three temperatures. We have chosen to present these results at 590 K, the start of the reactivity, 630 K, the temperature of reactivity maximum, and 750 K, the end of the negative coefficient zone. The mole fractions were those measured in Nancy and Hefei. Those measured in Hefei were only shown when no quantification was possible in Nancy. The conversion of n-butane (Conv) is 13% at 590 K, 47% at 630 K and 8% at 750 K. The carbon atom balance is calculated to be about 92% at 630 K, the temperature at which the conversion and the deviation are maximum. The total selectivity (in atoms of carbon) of quantified products is 96 and 83% at 590 and 630 K, respectively.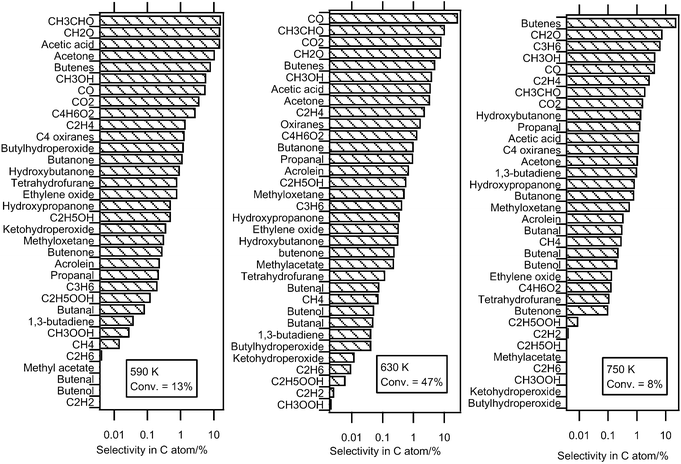 | ||
| Fig. 16 Experimental selectivity of all the carbon containing compounds quantified in this study. | ||
There is no systematic deviation between the maximum mole fraction of the products obtained both in Nancy and in Hefei (compounds with known photoionization cross-sections). There is good agreement for hydrocarbons, such as propene and 1,3-butadiene. The mole fractions obtained in Hefei are larger for the carbon oxides and acetaldehyde, and those measured in Nancy are larger for ethanol, acetone and C4H8O species.
Fig. 16 shows that, at 590 K, the four products formed with the largest selectivity (above 10%) are formaldehyde, acetaldehyde, acetic acid and acetone. The selectivity of butenes and carbon oxides is notably lower. At 630 K, carbon monoxide has the largest selectivity (28%). At 750 K, at the end of the NTC zone, the butenes have the largest selectivity (23%). The selectivity of acetic acid (16%) is particularly large for the lowest temperature, 590 K. While their presence at the outlet of internal combustion engines has been attested,34 the formation of short-chain monocarboxylic acids, formic (HCOOH) or acetic (CH3COOH) acids, has very rarely been reported in laboratory combustion systems (e.g. Curran et al.35) Their formation is usually not considered in a detailed kinetic model of alkanes (e.g. the models by Biet et al.16 or by Curran et al.36). However Battin-Leclerc et al.37 have proposed some possible formation pathways for these species under combustion conditions.
The formation of a wide range of alcohols has been found. Methanol has the largest selectivity regardless of temperature (e.g., 4% at 630 K). The formation of ethanol and hydroxybutanone are much less important (selectivity of 0.6 and 1%, respectively, at 630 K) and the formation of hydroxypropanol and butenol is still lower (selectivities of 0.35 and 0.05%, respectively, at 630 K). Note that while their formation would have been expected, no clear evidence of the formation of butanols has been found. Among the mono-oxygenated species having the same number of carbon atoms as the reactant, oxiranes and butanone are the species with the largest selectivity (about 1%) regardless of temperature. At 590 K, the selectivity of tetrahydrofuran is larger than that of methyloxetane, as opposed to 630 and 750 K, where it is smaller. At 590 K, the formation of butanal is ten times lower than that of butanone. Note that the small size of the n-butane molecule hinders the formation of cyclic ethers with a ring including five atoms. These last species are usually the major oxygenated compounds keeping the same number of carbon atoms as the reactant which are formed during the oxidation of larger alkanes, e.g. the studies of Hakka et al.18 and of Dagaut et al.23 While their formation is very low at the higher temperatures, at 590 K, the observed selectivities of butylhydroperoxides and C4 ketohydroperoxides, 1.2 and 0.4%, respectively, are of the same order of magnitude as that of the main C4 mono-oxygenated species. Although it was not possible to quantify these compounds in Nancy, a large selectivity of C4 compounds including two carbonyl groups has been observed in the results obtained in Hefei (3% at 590 K). The formation of these compounds could be derived from the reactions of C4 ketohydroperoxides. In the same way as butenes, the selectivity of unsaturated hydrocarbons, which are more representative of high temperature chemistry products increases considerably with temperature. At 750 K, the selectivity of ethylene, propene and 1,3-butadiene is 3, 7 and 1%, respectively.
In addition to the products for which it was possible to give a quantitative measurement, an evidence of the formation of some interesting minor compounds has also been found. Particularly notable is the possible formation of species which can be derived from reactions of cyclic ethers: furanone, dihydrofuranone, dihydrofuran and dihydrofuranhydroperoxides. Traces of esters (e.g., methylacetate or acetonylacetate) and of C4 species including three carbonyl groups have also been identified.
In order to analyze how a model in the literature can reproduce the formation of the wide range of reaction products quantified in the present work, simulations have been made using the low temperature oxidation mechanism of n-butane.33 This model has been generated by the version of EXGAS-ALKANES described by Biet el al.16 This model satisfactorily reproduced the conversion of n-butane under the same conditions as the present study. Simulations were performed using CHEMKIN software.38
Fig. 2 and 3 show that simulations reproduce well the experimental consumption of reactants and the formation of carbon oxides and water with a marked negative temperature coefficient (NTC) zone. However the simulated NTC behaviour is more marked than in experiments. The predicted end of the NTC zone occurs at too low a temperature, leading to underprediction of the reactivity between 650 and 750 K and to overprediction at higher temperatures. Improvements of this model will be needed to reduce this deviation. As shown in Fig. S3 of the ESI,† while simulations reproduce well the formation of methane and propene, that of ethylene is overestimated by a factor of almost three. The computed mole fractions of acetylene and ethane, which are very minor reaction products formed at a few ppm level are less satisfactory than those of other hydrocarbons: they are overestimated, respectively, by factors of fifty and six. As shown in Fig. S4 of the ESI,† simulations reproduce well the formation of C1–C2aldehydes, but underestimate the production of C1–C2alcohols by a factor of >3. This could be improved by considering in the model the reactions of methylperoxy and ethylperoxy radicals with butylperoxy radicals. The formation of ethylene oxide is overestimated by a factor of about 3. Simulations reproduce well the formation of propanal (see Fig. S5 of the ESI)† and acrolein (see Fig. 4), but not at all the formation of acetone (see Fig. S5 of the ESI).† The main pathway of acetone formation is certainly missing. In the present model, the only reaction of acetone formation is the combination between acetyl and methyl radicals. In addition, while the present experiments show that it is an important reaction product (maximum mole fraction about 1.5 × 10⁻³), the formation of acetic acid was not taken into account in the model. As shown in Fig. 5, simulations reproduce satisfactorily the shape of the mole fraction profile of hydrogen peroxide, but overestimate by a factor of about fifty the maximum mole fraction observed for this compound. Fig. 8 shows that the simulation of the sum of the two butenes overestimates the formation of these species below 670 K and above 750 K, and underestimates it in-between. Due to the lumping of reaction products performed during the automatic generation of the mechanism,39 the present model cannot distinguish between 1-butene and 2-butene. The computed formation of 1,3-butadiene is also strongly underestimated. Fig. 9 compares the experimental and simulated profiles with temperature of the mole fractions of the seven C4H8O compounds. The agreement between experiments and simulations is generally correct, except in the cases of tetrahydrofuran and butanal, the formation of which is overestimated below 670 K, and butenol, the formation of which is underestimated by a factor of about five-hundred. Simulations reproduce well the sum of the mole fractions of the compounds with a C4H8O formula measured in Nancy. Fig. 10 shows that the simulation of unsaturated C4 oxygenated compounds is very poor: the formation of butenone is not considered by the present model and the simulated formation of butenals is about 3000 times lower than the experimental one. Fig. 12 shows that the shapes of the experimental and simulated profiles of the formation of hydroperoxides are in very good agreement. However the predicted maximum mole fractions are overestimated by factors of 200, 20, 2 and 5 for methylhydroperoxide, ethylhydroperoxide, butylhydroperoxides and ketohydroperoxides, respectively. As shown in Fig. 13, the computed profile of hydroxybutanone is in good agreement with the experimental one, while calculations overestimate the formation of the C4 molecules including two carbonyl groups by a factor of about 2.5. Note that specific reactions had been added in the mechanism of Battin-Leclerc et al.33 in order to reproduce the formation of these species. While secondary reactions of cyclic ethers have been written, the formation of cyclic compounds derived from them was not taken into account. The formation of 3,4-dimethylhexane and of C4 species including three oxygen atoms other than ketohydroperoxides was not considered either.
This comparison between simulations and experimental results shows that the model performs rather satisfactorily to reproduce the global reactivity and the usual oxidation products such as water, carbon oxides, alkenes, aldehydes and cyclic ethers. Its predictions deteriorate in the case of alcohols, ketones and dienes, and are particurlarly poor for acetylene (a deviation by a factor of 50), butenol (a deviation by a factor of 500) and butenal (a deviation by a factor of 3000). Note that the formation of some products experimentally quantified, such as acetic acid, methyl acetate, butanone and hydroxypropanone was not considered by the model. Concerning hydroperoxides, while the model performs rather well for C4 compounds, the predictions are particularly poor for hydrogen peroxide (a deviation by a factor of 50), methylhydroperoxide (a deviation of a factor of 200) and ethylhydroperoxide (a deviation of a factor of 20). These important deviations are still more surprising knowing that the reactions forming small hydroperoxides play an important kinetic role and are therefore relatively well known. Taking this into account, the problem in the sampling or analysis of these compounds cannot be ruled out. This would also be consistent with the fact that HO2 radicals have not been detected despite the fact that large enough amounts of these radicals are expected to be formed and have concentrations above the detection limit of the mass spectrometer. That could be explained by losses of radicals and small hydroperoxide molecules during the sampling in the molecular beam.
Conclusion
This paper presents a detailed speciation and identification of the products formed during the low-temperature oxidation of n-butane in a jet-stirred reactor. Two methods of analysis have been used, gas chromatrography after sampling in the outlet gas and VUV photoionization mass spectrometry after molecular beam sampling. These two methods have been proven to give results in good agreement and to be complementary: gas chromatography is efficient in separating isomers and VUV photoionization mass spectrometry after molecular beam sampling allows the analysis of species such as hydroperoxides, which are too unstable to be detected by gas chromatography.36 reaction products of the oxidation of n-butane have been quantified, including hydrogen peroxide and 27 oxygenated organic compounds, such as ketones, cyclic ethers, alcohols, acetic acid, alkylhydroperoxides and ketohydroperoxides.
The performance of an automatically generated detailed kinetic model33 has been tested for reproducing the formation of the wide range of reaction products quantified in the present work. The model performs satisfactorily to reproduce the global reactivity and the usual oxidation products, such as water, carbon oxides, alkenes, aldehydes and cyclic ethers. However, its predictions deteriorate in the case of alcohols, ketones and dienes and the formation of some products experimentally observed in this study, such as acetic acid, is not taken into account.
It would be of great interest to continue studying the low-temperature oxidation of organic compounds using the same methodology. A next step could be a study of the oxidation of n-heptane, a linear alkane more representative of those present in automotive fuels and with a size of the molecule yielding a more usual distribution of oxygenated products.
Acknowledgements
This work was supported by the European Commission (“Clean ICE” ERC Advanced Research Grant), Région Lorraine, Chinese Academy of Sciences, Natural Science Foundation of China (Grant no. 50925623), National Basic Research Program of China (973) (Grant no. 2007CB815204) and Ministry of Science and Technology of China (Grant no. 2007DFA61310).Note and references
- Y. Li and F. Qi, Acc. Chem. Res., 2010, 43, 68–78 CrossRef CAS.
- C. A. Taatjes, N. Hansen, D. L. Osborn, K. Kohse-Höinghaus, T. A. Cool and P. R. Westmoreland, Phys. Chem. Chem. Phys., 2008, 10, 20–34 RSC.
- F. Battin-Leclerc, O. Herbinet, P. A. Glaude, R. Fournet, Z. Zhou, L. Deng, H. Guo, M. Xie and F. Qi, Angew. Chem., Int. Ed., 2010, 49, 3169–3172 CrossRef CAS.
- NIST Chemistry Webbook NIST Standard Reference Database 69 NIST, Gaithersburg, MD, 2005, http://webbook.nist.gov/chemistry/.
- J. Tranchant, J. F. Gardais, P. Gorin, J. Serpinet and G. Untz, Manuel Pratique de Chromatographie en Phase Gazeuse, Editions Masson, Paris, France, 1982 Search PubMed.
- R. T. Pollard, Hydrocarbons, in Comprehensive chemical kinetics: gas-phase combustion, ed. C. H. Bamford and C. F. H. Tipper, Elsevier, Amsterdam, 1977 Search PubMed.
- R. Minetti, M. Ribaucour, M. Carlier, C. Fittschen and L. R. Sochet, Combust. Flame, 1994, 96, 201–211 CrossRef CAS.
- J. F. Griffiths, P. A. Halford-Maw and D. J. Rose, Combust. Flame, 1993, 95, 291–306 CrossRef CAS.
- S. Gersen, A. V. Mokhov, J. H. Darmeveil and H. B. Levinsky, Combust. Flame, 2010, 157, 240–245 CrossRef CAS.
- D. Healy, N. S. Donato, E. L. Petersen, C. M. Zinner, G. Bourque and H. J. Curran, Combust. Flame, 2010, 157, 1526–1539 CrossRef CAS.
- D. Matras and J. Villermaux, Chem. Eng. Sci., 1973, 28, 129–137 CrossRef CAS.
- R. Porter, P. A. Glaude, F. Buda and F. Battin-Leclerc, Energy Fuels, 2008, 22, 3736–3743 CrossRef CAS.
- F. Qi, R. Yang, B. Yang, C. Huang, L. Wei, J. Wang, L. Sheng and Y. Zhang, Rev. Sci. Instrum., 2006, 77, 084101 CrossRef.
- Y. Li, L. Zhang, Z. Tian, T. Yuan, B. Yang, J. Yang and F. Qi, Energy Fuels, 2009, 23, 1743–1485 CrossRef CAS.
- C. Huang, B. Yang, R. Yang, J. Wang, L. Wei, X. Shan, Sheng, Y. Zhang and F. Qi, Rev. Sci. Instrum., 2005, 76, 126108 CrossRef.
- T. A. Cool, K. Nakajima, C. A. Taatjes, A. McIlroy, P. R. Westmoreland, M. E. Law and A. Morel, Proc. Combust. Inst., 2005, 30, 1681–1688 CrossRef.
- J. Biet, M. H. Hakka, V. Warth, P. A. Glaude and F. Battin-Leclerc, Energy Fuels, 2008, 22, 2258–2269 CrossRef CAS.
- M. H. Hakka, P. A. Glaude, O. Herbinet and F. Battin-Leclerc, Combust. Flame, 2009, 156, 2129–2144 CrossRef CAS.
- J. A. R. Samson and W. C. Stolte, J. Electron Spectrosc. Relat. Phenom., 2002, 123, 265–276 CrossRef CAS.
- J. A. R. Samson and J. L. Gardner, J. Electron Spectrosc. Relat. Phenom., 1976, 8, 35–44 CrossRef CAS.
- S. A. Shaw, D. M. P. Holland, M. A. Hayes, M. A. MacDonald, A. Hopkirk and S. M. McSweeney, Chem. Phys., 1995, 198, 381–396 CrossRef.
- G. N. Haddad and J. A. R. Samson, J. Chem. Phys., 1986, 84, 6623–6626 CrossRef CAS.
- P. Dagaut, M. Reuillon and M. Cathonnet, Combust. Flame, 1995, 101, 132–140 CrossRef CAS.
- T. A. Cool, K. Nakajima, T. A. Mostefaoui, F. Qi, A. Mcllroy, P. R. Westmoreland, M. E. Law, L. Poisson, D. S. Peterka and M. Ahmed, J. Chem. Phys., 2003, 119, 8356–8365 CrossRef CAS.
- J. Wang, B. Yang, T. A. Cool, N. Hansen and T. Kasper, Int. J. Mass Spectrom., 2008, 269, 210–220 Search PubMed.
- P. Osswald, U. Struckmeier, T. Kasper, K. Kohse-Höinghaus, J. Wang, T. A. Cool and P. R. Westmoreland, J. Phys. Chem. A, 2007, 111, 4093–4101 CrossRef CAS.
- T. A. Cool, J. Wang, K. Nakajima, C. A. Taatjes and A. Mcllroy, Int. J. Mass Spectrom., 2005, 247, 18–27 Search PubMed.
- H. Koizumi, J. Chem. Phys., 1991, 95, 5846–5851 CrossRef CAS.
- A. Chakir, M. Cathonnet, J. C. Boettner and F. Gaillard, Combust. Sci. Technol., 1989, 65, 207–230 CrossRef CAS.
- J. A. Montgomery, M. J. Frisch, J. W. Ochterski and G. A. Petersson, J. Chem. Phys., 1999, 110, 2822–2827 CrossRef CAS.
- M. J. Frisch, et al., Gaussian03, revision B05, Gaussian, Inc., Wallingford, CT, 2004 Search PubMed.
- N. Blin-Simiand, F. Jorand, K. Sahetchian, M. Brun, L. Kerhoas, C. Malosse and J. Einhorn, Combust. Flame, 2001, 126, 1524–1532 CrossRef CAS.
- F. Battin-Leclerc, O. Herbinet, P. A. Glaude, R. Fournet, Z. Zhou, L. Deng, H. Guo, M. Xie and F. Qi, Proc. Combust. Inst., 2010 DOI:10.1016/j.proci.2010.05.001 , in press.
- E. Zervas, X. Montagne and J. Lahaye, Environ. Sci. Technol., 2001, 35, 2746–2751 CrossRef CAS.
- H. J. Curran, S. L. Fisher and F. L. Dryer, Int. J. Chem. Kinet., 2000, 32, 741–759 CrossRef CAS.
- H. J. Curran, P. Gaffuri, W. J. Pitz and C. K. Westbrook, Combust. Flame, 1998, 114, 149–177 CrossRef CAS.
- F. Battin-Leclerc, A. A. Konnov, J. L. Jaffrezo and M. Legrand, Combust. Sci. Technol., 2008, 180, 343–370 CrossRef CAS.
- R. J. Kee, F. M. Rupley and J. A. Miller, Sandia Laboratories Report, S 89-8009B, 1993.
- V. Warth, N. Stef, P. A. Glaude, F. Battin-Leclerc, G. Scacchi and G. M. Côme, Combust. Flame, 1998, 114, 81–102 CrossRef CAS.
Footnote |
| † Electronic supplementary information (ESI) available: Photographies of the reactors used in Hefei and in Nancy; method used for calculating mole fractions from mass spectrometer ion signals; evolution with temperature of concentrations of the C1–C3 organic compounds; contribution of ketene to mass 42. See DOI: 10.1039/c0cp00539h |
| This journal is © the Owner Societies 2011 |

