Photofragmentation in selected tautomers of protonated adenine
Nu Ri
Cheong
a,
Sang Hwan
Nam
a,
Hye Sun
Park
a,
Seol
Ryu
a,
Jae Kyu
Song
a,
Seung Min
Park
*a,
Marie
Pérot
b,
Bruno
Lucas
b,
Michel
Barat
b,
Jacqueline A.
Fayeton
*b and
Christophe
Jouvet
b
aDepartment of Chemistry, Kyung Hee University, Seoul 130-701, Korea
bInstitut des Sciences Moléculaires d'Orsay, CNRS, Université Paris Sud 11, F-91405 ORSAY Cedex, France. E-mail: smpark@khu.ac.kr; Jacqueline.fayeton@u-psud.fr
First published on 27th October 2010
Abstract
The photofragmentation by UV excitation of selectively prepared 1++ and 3++ tautomers of protonated adenine is studied after excitation at a 266 and 263 nm wavelengths with two different experimental set-ups located in Seoul and Orsay. While the production of 1++ tautomers with an electrospray ion source is now well accepted, calculations were used to ascribe the preparation of 3++ tautomers from cold adenine dimers. The fragmentation patterns are rather similar for both tautomers, suggesting similar mechanisms as a statistical fragmentation in the ground electronic state after internal conversion.
1. Introduction
The structural modifications of adenine and its ions produced by fragmentation have been investigated experimentally and theoretically.1–11 Although mass spectrometry has been employed to characterize the structural modifications of DNA bases, the interpretation of mass spectra was often found to be difficult, because earlier work usually employed collision-induced dissociation (CID) techniques, such as that of Nelson and McCloskey.7 As a matter of fact, it is not easy to distinguish the primary fragments from the secondary ones in multiple collision conditions. Thus, the secondary fragments often obscure the fragmentations of interest, such as the primary photodamage of adenine. Therefore, photofragmentation studies in which the total energy of fragmentation can be well-defined provide a better understanding of the fundamental mechanism of fragmentations. Recently, the photofragmentation of protonated adenine (AH+) was investigated,6,8 which reported photofragment intensity distributions different from that of CID techniques.2,7 The excited state dynamics were investigated by femtosecond pump–probe transient mass spectrometry by monitoring ion fragment production.8 This work showed that the lifetime of the ππ* state is shorter than 161 fs. The observed fragmentation pattern depends on the internal energy of the ions, i.e. the number of absorbed IR probe photons. Adding the probe photon energy favored secondary fragmentation. The femtosecond experiment thus suggests that the three m/z 94, 77 and 65 fragments are secondary fragments while the m/z 119 and 109 fragments are due to primary fragmentation, as in the CID experiments.The channels responsible for the photofragmentation are probably due to statistical fragmentation on the ground state surface after internal conversion. However, direct fragmentation from repulsive excited states might also occur.12,13 As an example, H loss via the repulsive πσ* state has been observed in neutral adenine excited at λexc < 233 nm.14 This dissociation channel is also present in protonated systems, as observed in tryptophan.15,16 The fragmentation time measurement is a good means to discriminate between these two mechanisms, statistical fragmentation and direct fragmentation, since they occur on very different timescales. Direct fragmentation on a repulsive potential energy surface is much faster (femtosecond) than a fragmentation process occurring on the ground state surface through a statistical mechanism (microsecond).
In this paper, we study the photofragmentation of AH+ using UV excitation. Several photofragments of AH+ were observed upon photoexcitation, which were investigated by mass distribution, laser power dependence, action spectra and theoretical calculations.
2. Experiments
A brief overview of the two experimental setups is given here. The details of the Seoul experiment are described elsewhere,17–19 and only the modifications to it are given in the present paper. The adenine clusters were generated by adenine vapor at 573 K seeded in a He carrier gas. The neutral clusters were ionized by the fourth harmonic output (266 nm) of a Nd:YAG laser. In a Wiley-McLaren-type of time-of-flight tandem mass spectrometer, the ions of interest were selected by a mass gate in the first stage. The selected ions were excited by the fourth harmonic output (266 nm, 4.66 eV) of a Nd:YAG laser and the tunable output of a dye laser pumped by another Nd:YAG laser. A pulsed electric field was applied to separate daughter ions. The photofragments were detected as a function of the time-of-flight in the second stage. A difference mass spectrum was obtained by subtraction of the two mass distributions, which were acquired with and without the photoexcitation pulse, keeping the other conditions unchanged.The Orsay experiment is described in previous papers.16,20 Briefly, protonated adenine was carried in the gas phase with an electrospray ion (ESI) source. These ions were then bunched at a 1 kHz repetition rate, accelerated at a 5 keV energy, mass selected and photoexcited by the fourth harmonic (263 nm, 4.71 eV) of a 1 kHz Nd:YLF laser. The laser beam was sent either in a linear trap,20,21 allowing the study of fragmentation dynamics in the 5 μs–10 ms range, or downstream in a polarized box, to study fragmentations faster than a few microseconds.22 The fragment ions were mass analyzed with a 45° electrostatic analyzer and detected by a position sensitive detector (PSD) while the neutral fragments reached a second PSD. The ion and neutral fragments were detected in coincidence. The position and time resolved fragmentation events give detailed information on the fragmentation dynamics. In particular, one can determine the number of steps of the fragmentation process, the fragmentation time of each step and the kinetic energy release (KER) for each channel.
3. Results and discussion
A typical adenine cluster ion mass distribution of the Seoul experiment is presented in Fig. 1a. Protonated adenine (AH+) is found along with adenine ion (A+), as shown in the inset of Fig. 1a. The intensity of AH+ is larger than that of A+, which implies that hydrogen transfer or proton transfer takes place either in excited neutral states or in ionic states, as recently studied.23 It can be seen that peaks of smaller mass appear in the mass distribution. The m/z 119 fragment is the most abundant, while the m/z 109 fragment is also significantly populated. Other minor peaks are also found. Photofragmentation of size-selected AH+ was investigated at 266 nm. The difference mass spectrum in Fig. 1b shows several photofragments of AH+ at 266 nm for high excitation intensity (80 mJ cm−2). Among them, the m/z 119 fragments corresponding to the loss of NH3 and the m/z 109 fragments due to the loss of HCN or HNC showed large intensities.3,7 On the other hand, the mass spectrum obtained at a low excitation intensity (4 mJ cm−2) showed only few photofragments, such as m/z 119, 109, 94 and 18 (Fig. 1c), suggesting that some photofragments (mass peaks at m/z 28, 55, 67, and 82) are produced by multiphoton processes. Thus, the ion intensities were monitored as a function of the 266 nm photon flux, which confirms that the observed fragments at low excitation intensity come from a one-photon process.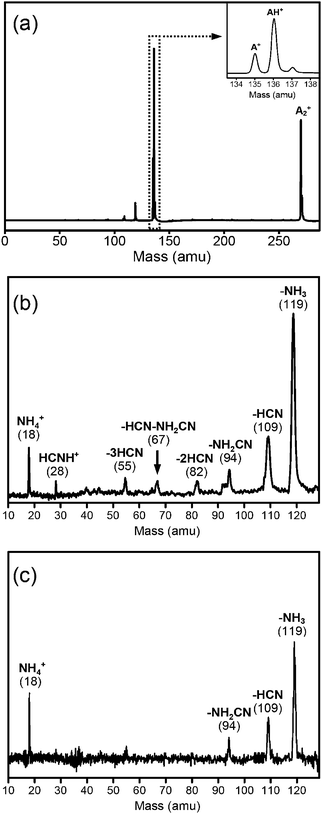 | ||
| Fig. 1 (a) The mass distribution of adenine clusters obtained by multiphoton ionization at a wavelength of 266 nm. The inset shows the mass distribution of adenine ions (A+) and protonated adenine (AH+). The difference of the mass spectra of protonated adenine excited by a 266 nm laser with the laser on and off (b) at a high excitation intensity (80 mJ cm−2) and (c) at a low excitation intensity (4 mJ cm−2). | ||
Action spectra for the photodissociation of AH+ were obtained by monitoring the ion intensities of fragments such as m/z 119 (Fig. 2a) and m/z 109 (Fig. 2b) as a function of the laser excitation energy. The shape of the action spectrum is similar to that produced by an ESI mass spectrometer,6 except for a red-shifting of the present spectrum and a slightly slower increase of the onset. The broad peak at 4.23 eV is red-shifted by 0.3 eV with respect to the reported band maximum at 4.53 eV, which was assigned to the 0–0 transition of all perpendicular stretching modes to the ring puckering mode.6
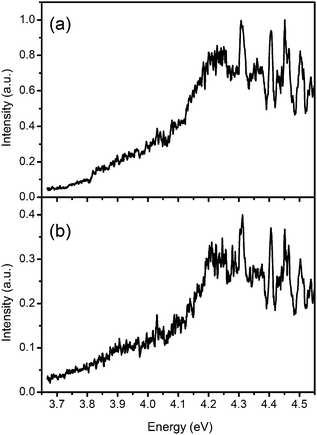 | ||
| Fig. 2 Action spectra for the photodissociation of AH+, which were obtained by monitoring the ion intensities of (a) m/z 119 and (b) m/z 109 fragments as a function of the excitation energy. The spectral shape in both action spectra shows a smooth onset and broad structures. The intensity of m/z 119 is ∼2.5 times larger than that of m/z 109. | ||
The fragment mass spectra of AH+ obtained in Orsay are shown in Fig. 3. These results correspond to the number of fragment ions of a given mass hitting the ion PSD normalized to the total number of neutrals. These data, obtained with the laser fired in the interaction box, give the branching ratio between the various fragmentation channels that dissociate inside a 5 μs time window. Four different ion fragments clearly show up, corresponding to m/z 119, 109, 94 and 18. It was checked for the 4 channels that the intensity depends linearly on the photon flux, showing that photofragmentation is due to one-photon excitation. “VV” correlations24 demonstrated that all the channels result from a one-step fragmentation mechanism. Thus, the m/z 94 fragment is not a secondary fragment, as suggested by the femtosecond experiment.8 The H loss channel can be tracked by storing the photoexcited ions in a trap. H loss would then result in the formation of a (m/z − 1) fragment ion that has an oscillation period smaller than that of the parent ion. For AH+ and A+, the two periods differ by 60 ns. Clearly, the time spectrum recorded after 5 oscillations (75.5 μs) does not show any evidence of H loss (Fig. 4).
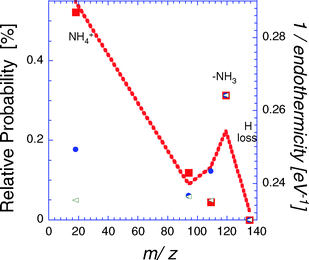 | ||
Fig. 3 Relative fragmentation probabilities of AH+: ■ Orsay results (fragmentation time window of 5 μs), ● Seoul experiments, ◁ CID experiments taken from ref. 7, ![[dash dash, graph caption]](https://www.rsc.org/images/entities/char_e091.gif) statistical model. Data are normalized to the intensity of m/z 119. statistical model. Data are normalized to the intensity of m/z 119. | ||
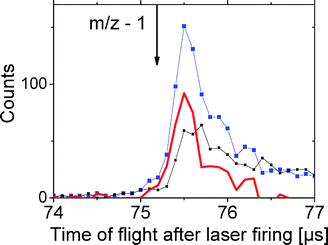 | ||
| Fig. 4 Time-of-flight spectrum of neutral fragments measured on the “neutral” PSD and recorded after 5 ion oscillations in the trap corresponding to a time delay of 75.5 μs after laser firing: ■ big squares laser on, ■ small squares laser off, thick line difference of the spectra for laser on and laser off, respectively. The arrow indicates the time-of-flight corresponding to the expected location of the (m/z − 1) fragment. | ||
The decay times for each fragmentation channel were determined by measuring the time-of-flight of the neutral fragments emitted in an electric field established inside the polarized box and detected in coincidence with a selected ion fragment. Such measurements give the same lifetime for all channels. An 8 μs lifetime was obtained by fitting the decay rate of the photoexcited AH+ that fragments inside the trap (Fig. 5). In fact, the ions produced by this ESI are known to be rather hot, say, having a temperature of about 900 K,24 corresponding to a rather large internal energy distribution. This situation leads to a complex dependence of the decay rate with time; it is definitely not a simple exponential decay rate.21 More important is that the decay time is the same for all fragments (m/z 119, 109, 94 and 18). Moreover, a kinetic energy release of less than 100 meV was found for all fragmentation channels. This small value is consistent with that given by a statistical energy distribution on a potential energy surface without a significant barrier in the exit channel. These results agree very well with what is expected for a purely statistical fragmentation that occurs after internal conversion (IC) on the ground state. These findings are also consistent with a femtosecond experiment on protonated adenine,8 which showed that the excited state lifetime was very short (<161 fs) due to a fast internal conversion.
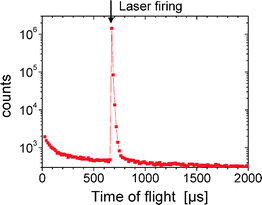 | ||
| Fig. 5 The time-of-flight of neutral fragments with the laser fired inside the ion trap. The laser was fired at a time of 674 μs following the beginning of the ion trapping. The fit of the decay slope gives an 8 μs fragmentation time for excited AH+. | ||
The Seoul and Orsay experiments were performed with different ion sources. It seems established that the ESI technique used in Orsay involves the most stable (1++) tautomer,10 in which the proton is attached to the nitrogen atom of position 1 (Fig. 6).
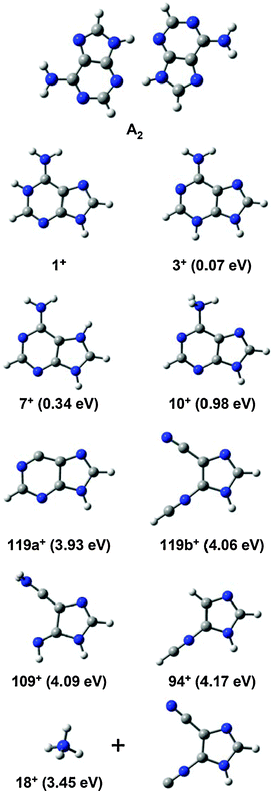 | ||
| Fig. 6 Stable geometries of neutral adenine dimer (A2), tautomers of protonated adenine (1++, 3++, 7++ and 10++) and fragments of protonated adenine (119++, 109++, 94++ and 18++). The relative energies of each structure, referring to that of the most stable tautomer of protonated adenine (1++), are given in parentheses. | ||
In order to try to understand the tautomer composition and the photofragmentation of AH+, theoretical calculations were carried out using density functional theory, which used the Gaussian03 suite of programs at the B3LYP/6-31+G(d,p) level.25 The stable structure of A2 (neutral dimer) shows a planar symmetry between the monomer moieties that is more stable than other asymmetric dimers by at least 0.15 eV.26,27 This suggests that most of the neutral dimers are symmetrically planar in the molecular beam. As a consequence, most ion dimers (A2+) produced by direct photoionization are in almost identical symmetric geometries.23,27 Therefore, the main tautomer in these experimental conditions might be 3++, because AH+ is mainly formed by the dissociative ionization of adenine clusters such as A218–27; geometry change during the dissociative ionization to AH+ is not expected. In addition, the height of the barrier between the 3++ and 1++ tautomers has been calculated to be as high as 2.78 eV,10 indicating that tautomerization is not probable in the gas phase.
This is in agreement with calculations3,6 that have shown that the vertical transition energy from the S0 state to the S1 state is smaller in 3++ than in 1++, explaining the observed red-shift. The shape and energy of the action spectrum of m/z 109 (Fig. 2b) are nearly identical to those of m/z 119. Thus, it is suggested that m/z 109 photofragmentation takes place via the same electronic states as observed for m/z 119, since the shape of the action spectra indicate the vibronic absorption of 3++.
One can then compare (Fig. 3) the branching ratio for the various fragmentation channels of both the 1++ and 3++ tautomers obtained in the Orsay and Seoul experiments, respectively. These results can be compared with the branching ratio for CID.7Fig. 3 also shows a statistically-based estimate of the fragmentation probabilities as a law that is inversely proportional to the endothermicity of each fragmentation channel. This simple estimate reproduces well the relative importance of the m/z 119 channel, as found in all the experiments. The statistical distribution also favors the dominance of m/z 109 over 94, as actually observed by several experiments, except in the Orsay results; no simple explanation of this can be given. The dominant m/z 18 fragmentation channel is underestimated in the Seoul experiment because of the small size of the fragment ion detector, which prevents collection of the whole emission cone of light NH4+ fragments.
H loss is not observed in our experiment, in contrast to what has been observed in the neutral molecule excited at 5 eV.28 This is, however, in agreement with theoretical calculations of excited state potential energy surfaces of AH+,6 which predict that the internal conversion is triggered by an out-of-plane deformation. Therefore, one should not expect significant differences in the Orsay experiments, since after internal conversion, dissociation might occur statistically in the vibrationally hot S0 state. For example, the relative dominance of the m/z 119 channel over the m/z 109 channel in both experiments (Fig. 3) is clearly related to the larger endothermicity of the m/z 109 channel (4.02 eV) with respect to that of the m/z 119 channel (3.86 eV). Concerning the ground state dynamics that occur after internal conversion, extensive transition state research has been done by Turecek.10,29 From this, a potential energy scanning RRKM reaction rate prediction has been obtained for energies lower than that of the present experiment. However, extrapolation of these calculated values to our energy is not incompatible owing to the internal energy both experiments not being very well controlled.
4. Summary
The photofragmentation in selectively prepared 1++ or 3++ tautomers of AH+ has been investigated by two different experimental methods, where the 3++ tautomer was formed by the dissociative ionization of A2 and the 1++ tautomer was produced by an ESI source. The red-shift in the action spectra supports the preparation of 3++ as a distinctive tautomer. The most stable (1++) tautomer, investigated in the other studies, gave similar fragments. The similar shape and energy observed in the action spectra of m/z 119 and 109 indicate that the same electronic state, most probably the ground state, is involved in the m/z 119 and 109 photofragmentations. The fragmentation time was found to be similar for all fragments. This was also expected from a statistical fragmentation, in which the energy was higher than all the isomerisation barriers.10 It therefore seems that this protonated ion’s dynamics can be understood as a ground electronic state fragmentation that occurs in a statistical manner after ultrafast internal conversion.Acknowledgements
This work was supported by the National Research Foundation of Korea (no. 2009-0079060). The Orsay experiments were carried out at the Center de Cinetique Rapide ELYSE. The CNRS and the Université Paris Sud 11 are also thanked for their financial support.References
- M. C. G. Barrio, D. I. C. Scope and J. B. Holtwick et al., Proc. Natl. Acad. Sci. U. S. A., 1981, 78, 3986 CrossRef.
- X. H. Chen, E. A. Syrstad and M. T. Nguyen et al., J. Phys. Chem. A, 2005, 109, 8121 CrossRef CAS.
- X. H. Chen, E. A. Syrstad and M. T. Nguyen et al., J. Phys. Chem. A, 2004, 108, 9283 CrossRef CAS.
- R. Improta, G. Scalmani and V. Barone, Int. J. Mass Spectrom., 2000, 201, 321 Search PubMed.
- H. W. Jochims, M. Schwell and H. Baumgartel et al., Chem. Phys., 2005, 314, 263 CrossRef CAS.
- C. Marian, D. Nolting and R. Weinkauf, Phys. Chem. Chem. Phys., 2005, 7, 3306 RSC.
- C. C. Nelson and J. A. McCloskey, J. Am. Chem. Soc., 1992, 114, 3661 CrossRef CAS.
- D. Nolting, R. Weinkauf and I. V. Hertel et al., ChemPhysChem, 2007, 8, 751 CrossRef CAS.
- S. K. Sethi, S. P. Gubta and E. E. Jenkins et al., J. Am. Chem. Soc., 1982, 104, 3349 CrossRef CAS.
- F. Turecek and X. H. Chen, J. Am. Soc. Mass Spectrom., 2005, 16, 1713 CrossRef CAS.
- K. Varmuza, W. Werther and F. R. Krueger et al., Int. J. Mass Spectrom., 1999, 189, 79 Search PubMed.
- S. Perun, A. L. Sobolewski and W. Domcke, J. Am. Chem. Soc., 2005, 127, 6257 CrossRef CAS.
- S. Perun, A. L. Sobolewski and W. Domcke, Chem. Phys., 2005, 313, 107 CrossRef CAS.
- M. G. D. Nix, A. L. Devine and B. Cronin et al., J. Chem. Phys., 2007, 126, 124312 CrossRef.
- H. Kang, C. Jouvet and C. Dedonder-Lardeux et al., Phys. Chem. Chem. Phys., 2005, 7, 394 RSC.
- V. Lepere, B. Lucas and M. Barat et al., J. Chem. Phys., 2007, 127, 134313 CrossRef CAS.
- S. H. Nam, H. S. Park and M. A. Lee et al., J. Chem. Phys., 2007, 126, 9.
- S. H. Nam, H. S. Park and S. Ryu et al., Chem. Phys. Lett., 2008, 450, 236 CrossRef CAS.
- S. H. Nam, H. S. Park and J. K. Song et al., J. Phys. Chem. A, 2007, 111, 3480 CrossRef CAS.
- B. Lucas, M. Barat and J. A. Fayeton et al., J. Chem. Phys., 2008, 128, 164302 CrossRef CAS.
- K. Hansen, J. U. Andersen and P. Hvelplund et al., Phys. Rev. Lett., 2001, 87, 4 CrossRef.
- B. Lucas, M. Barat and J. A. Fayeton et al., Chem. Phys., 2008, 347, 324 CrossRef CAS.
- I. Hunig, C. Plutzer and K. A. Seefeld et al., ChemPhysChem, 2004, 5, 1427 CrossRef.
- U. Kadhane, M. Perot and B. Lucas et al., Chem. Phys. Lett., 2009, 480, 57 CrossRef CAS.
- M. J. Frisch et al., Gaussian03, Gaussian, Inc., Pittsburgh, PA, 2003 Search PubMed.
- M. Kabelac and P. Hobza, J. Phys. Chem. B, 2001, 105, 5804 CrossRef.
- H. S. Park, S. H. Nam and J. K. Song et al., J. Phys. Chem. A, 2008, 112, 9023 CrossRef CAS.
- M. Zierhut, W. Roth and I. Fischer, Phys. Chem. Chem. Phys., 2004, 6, 5178 RSC.
- J. C. Choe, J. Phys. Chem. A, 2006, 110, 7655 CrossRef CAS.
| This journal is © the Owner Societies 2011 |