Molecular simulation of swelling and interlayer structure for organoclay in supercritical CO2†
Yanruo
Yu
and
Xiaoning
Yang
*
State Key Laboratory of Materials-Oriented Chemical Engineering, College of Chemistry and Chemical Engineering, Nanjing University of Technology, Nanjing 210009, China. E-mail: Yangxia@njut.edu.cn
First published on 26th October 2010
Abstract
In this work, Monte Carlo simulations have been carried out to investigate the swelling stability and interlayer structures of alkylammonium-modified montmorillonite both in vacuum and in supercritical CO2 (scCO2) fluid. In the vacuum (dry) condition, the stable spacing for this kind of organoclay was determined based on the energy minimum. In the stable spacing, the corresponding interlayer structure of dry organoclay is the monolayer arrangement with the intercalated surfactant chains lying parallel to the silicate surface. In scCO2 fluid medium, the normal pressures within the organoclay gallery and the swelling free energy have been obtained from Gibbs ensemble Monte Carlo simulation. The mechanically and thermodynamically stable spacings of the organoclay have been determined. As compared with the case in vacuum, the simulation shows that the swelling of the organoclay is thermodynamically favorable in the environment of scCO2 fluid. The interlayer structure and conformation have been used to analyze the mechanism of swelling. The headgroups of surfactant cations are distributed close to the clay surfaces. The presence of CO2 molecules within the clay gallery can cause a specific steric arrangement of the long-chain alkylammonium cations.
1. Introduction
Polymer/clay nanocomposites possess important applications due to their enhanced mechanical, thermal, and barrier properties.1–3 However, the exfoliation and dispersion of clay sheets in polymer media often appear difficult. Considerable efforts have been made to exfoliate and disperse nanoclays in polymers.4–8 The critical point is the surface modification of natural clays by intercalating alkylammonium cations into the gallery spacing, which can cause the clay surface to become organo-philic and enlarge the basal spacing of clays. This alkylammonium modified clay is usually referred to as organoclay. The organoclays are compatible with polymers and they can be successfully dispersed in an appropriate polymer.Recently, supercritical CO2 (scCO2) has appeared to be a processing medium for intercalating and exfoliating layered natural clays.9–11 In this method, the layered nanoclays were immersed in the scCO2 fluid for a certain period followed by rapid depressurization. This pressure difference between the layers during the depressurization may push them apart, resulting in an effective exfoliation.12 In addition, high diffusivity and low viscosity of scCO2 can enhance the relevant intercalation process.
The swelling of clays in solvents can be described in terms of a series of expanded spacings, which are mechanically and thermodynamically stable states. Although certain experimental studies have been made in the intercalation or dispersion of organoclays in scCO2 fluid, the investigation of swelling behavior for the organoclays in scCO2 fluid is still very limited. In the soak step of clay materials in scCO2, the structure and morphology of the intercalated alkylammonium cations within the clay pores remain unclear. There is lack of a molecular level understanding of interactions of interlayer species. In general, the swelling behavior of layered organoclays in the supercritical fluid determines the final delamination of clay structure, which will control the dispersion of clay nanofiller in polymer media. Recently, Thompson et al.13,14 investigated the influence of scCO2 on the morphology and swelling of montmorillonite modified with quaternary ammonium surfactants containing C16–C18 alkyl chains. However, due to the insufficiency of experimental techniques, the structure and mechanism of intercalated surfactant arrangement within the clay can only be explained as a conceptual view.
As a supplementary analysis of experiment, molecular simulation techniques can provide unique information on the swelling of clay minerals and the interlayer structures.15–17 In particular, the structure and configuration pictures for the interlayer species can be directly visualized. At present, molecular simulation has been applied to study the stability and structure of hydrated clays18–20 and organoclays.21–23 However, to the best of our knowledge, no molecular simulation studies have been carried out for the swelling and structure of organoclay in scCO2 fluid.
In the present study, molecular simulation was applied to study the octadecyltrimethyl ammonium (ODTA) modified montmorillonite (OM for short in the following section) scCO2 fluid. We used the canonical NVT (constant number of particles, temperature and volume) ensemble and the Gibbs ensemble Monte Carlo (GEMC) simulations. The normal pressure component within the clay pore and the swelling free energies for the organoclay in scCO2 were calculated in order to determine the stable spacings of clay in the supercritical fluid. For comparison, the pristine organoclay without the scCO2 contact have also been simulated. The thermodynamic analysis and microscopic structure characterization will help to understand the organoclay stability in scCO2.
2. Models and simulation details
The total energy (Etotal) of the simulated system is the sum of the intra- and intermolecular interactions,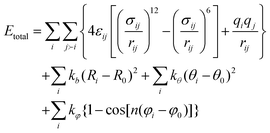 | (1) |
In this simulation, we used the Wyoming type montmorillonite as the clay model, which carries isomorphic substitutions in both its octahedral and tetrahedral layers. The montmorillonite used here only carries the Loewenstein's random substitution24–26 of aluminium ions by magnesium ions in the octahedral sheets.27 The unit cell formula is M0.375Si8[Al3.625Mg0.375]O20(OH)4, where “M” represents a monovalent cation and “0.375” is the layer charge per unit cell.28 The atomic coordinates (Table S1 of the supplementary information†) of one unit cell are based on the work of Skipper and Katti et al.29,30 The clay model has one sheet measuring 42.24 Å × 18.28 Å × 6.56 Å, equivalent to 16 unit-cells (8a × 2b × 1c). The simulation cell contains one layer patch with 42.24 Å × 18.28 Å located at the bottom of the simulation cell. The third dimension of the simulation cell is built based on various basal spacings.
The clay model was considered to be rigid throughout the simulation process.31 The general CLAYFF force field developed by Cygan et al.32 was used to represent the clay. For the organoclay, six ODTA surfactant cations were introduced to completely compensate the resulting net charge in the interlayer structure, producing the cation exchange capacity (CEC) of 51 meq/100 g clay. This creation of ODTA-modified clay model was based on the assumption that all interlayer cations in the montmorillonite were replaced by ODTA cations. Fig. 1 shows the molecular structure of ODTA. The ODTA surfactant model is based on the DREIDING force field,33 which has been used in the simulation of the nanocomposites containing exfoliated clay layers treated with various alkylammonium salts.34 The atomic charges of quaternary alkylammonium were determined based on the previous treatment,28 in which the charge equilibrium calculation shows that the positive charge is not localized on the nitrogen atom but around the nitrogen atom and its adjacent carbons. Therefore, one unit positive charge is assigned to the headgroup, including one nitrogen atom and its adjacent carbon atoms.28 The assignment of the atomic charge of ODTA chain is in line with the method in ref. 35. The detailed potential parameters were supplied in the supplementary information.†Carbon dioxide was described by the EPM2 model.36 In the initial construction of the organoclay configuration, the ODTA cations were uniformly placed into the montmorillonite interlayer with their long chains oriented in a direction approximately parallel to the plane of the clay layers. This method is similar to the procedure described elsewhere.28
 | ||
| Fig. 1 The structure of the octadecyltrimethyl ammonium (ODTA). The head nitrogen is drawn in blue and the carbon atom in grey. The carbon numbers of the alkyl chain are marked from 1 to 18. | ||
A series of canonical ensemble Monte Carlo (MC) simulations at normal temperature, 298.15 K, were performed for the ODTA/clay hybrid with different basal spacings. We applied the three-dimensional periodic boundary conditions. In this NVT simulation, the surfactant cations within the interlayer are free to move. A center-of-mass translation move was performed for the selected type of molecule. The configuration-biased MC method37,38 was also used for the molecule regrowth move. In each case, an equilibrium simulation of 200![[thin space (1/6-em)]](https://www.rsc.org/images/entities/char_2009.gif) 000 cycles was performed before a production run of 200
000 cycles was performed before a production run of 200![[thin space (1/6-em)]](https://www.rsc.org/images/entities/char_2009.gif) 000 cycles.
000 cycles.
A GEMC (NPT, constant number of particles, pressure and temperature) simulation37–40 was employed in determining the stable basal spacings as well as the interlayer structures of the organoclay in the surrounding of scCO2 at the fixed temperature (323.15 K) and pressure (8.4 MPa). This condition choice is in accordance with the experimental condition.14 In the GEMC method,37,38 two simulation cells represent two coexisting equilibrium phases, respectively, with no physical interface. Unlike traditional grand canonical MC simulation, the chemical potential is not required in the GEMC technique. In our GEMC simulation, one simulation cell (cell 1) represents the clay pore phase including the interlayer sodium cations, and the other cell (cell 2) represents the coexisting supercritical CO2 bulk phase. In the simulation procedure, the pressure of the exterior bulk phase was controlled to be the defined value. The total number of molecules was fixed, but the CO2 molecules could be transferred from one cell to another cell. The volume of simulation cell 2 is allowed to fluctuate in order to maintain the desired pressure of the bulk phase. In cell 2, the number of solvent particles in each simulation is initially set to be 1000. The GEMC simulations were conducted with different assumed interlayer spacings ranging from 7.5 to 19 Å.
Five types of trial MC moves were performed in the GEMC simulations: translation, rotation, configuration-biased molecule regrowth, transfer between the two cells, and volume change in the bulk phase cell. These moves ensure the two phases are in chemical equilibrium. For the first two types of moves, the molecule number in each phase is fixed and a randomly chosen molecule is moved. The acceptance probability is determined by the common Metropolis criterion.39,40 The configuration-biased MC method37,38 was used for the molecule regrowth move. The acceptance probability for the trial volume change in the bulk phase (cell 2) has been given in ref. 39. Meanwhile, the rotational-biased MC method was used for the CO2 molecule insertion/deletion during the transfer move between the two cells. A cut-off (Rcut = 15 Å) with long-range correction was used in the van der Waals (vdW) calculation. The long-range electrostatic interaction used the Ewald summation technique, in which the Ewald parameters were determined to reach a precision of 1.0 × 10⁻⁴. The typical simulation run was performed for 200![[thin space (1/6-em)]](https://www.rsc.org/images/entities/char_2009.gif) 000 cycles. The first 100
000 cycles. The first 100![[thin space (1/6-em)]](https://www.rsc.org/images/entities/char_2009.gif) 000 cycles were used for the equilibrium stage and the rest of the cycles were utilized to determine the equilibrium properties.
000 cycles were used for the equilibrium stage and the rest of the cycles were utilized to determine the equilibrium properties.
3. Results and discussion
3.1 Basal spacing and interlayer structure in vacuum
At first, we carried out the canonical simulations for the clay modified by ODTA in vacuum. Different basal spacings were assumed from 11.56 Å to 18.56 Å with an interval of 1 Å. Fig. 2 shows the plot of the potential energy against the spacings of the organoclay. The basal spacing around 13.56 Å is the most stable based on the energy minimum. In the NVT simulation for the organoclay, various initial configurations have been adopted and similar results were obtained. Fig. 3(a) presents the equilibrium snapshot of OM at the stable spacing. It is observed that the intercalated surfactant molecules lie flat along the lateral direction with a formation of monolayer. An orientational distribution (not shown) of the intercalated surfactant molecules have also indicated that the alkyl chains are mainly parallel to the silicate surface. This parallel arrangement may produce an enhanced interaction between the alkyl chains,41 which is energetically beneficial for the organoclay system.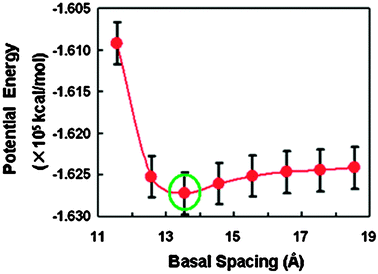 | ||
| Fig. 2 Total potential energy as a function of basal spacing for the organoclay during the canonical ensemble simulation. The green circle indicates the minimum energy corresponding to the equilibrium basal spacing of 13.56 Å. | ||
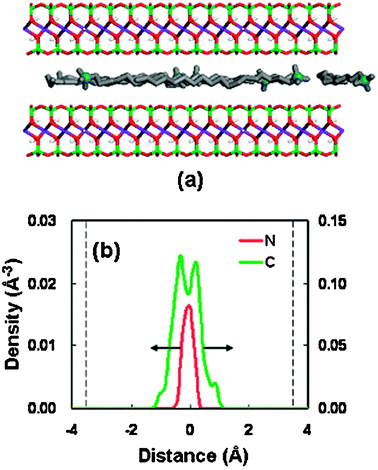 | ||
| Fig. 3 (a) Snapshot of the equilibrium structure at a basal spacing of 13.56 Å for OM. The montmorillonite silicon atoms are drawn in green, oxygen in red, aluminium in purple, magnesium in yellow, and hydrogen in white. The ODTA + nitrogen atoms are in blue and alkyl chains in grey. (b) Density distributions of the surfactant at a basal spacing of 13.56 Å (nitrogen in red, alkyl chain in green); the dashed line represents the silicate surface. | ||
Fig. 3(b) shows the corresponding density profiles of headgroups (nitrogen atoms) and alkyl chains (carbon atoms) in ODTA. A single density peak suggests that all nitrogen atoms are distributed within one monolayer located in the middle of the gallery. The density profiles of alkyl chains also demonstrate a weak monolayer behavior with two less-separated peaks. The overall surfactant density profile is identical with the observation in the snapshot (Fig. 3(a)). Furthermore, from Fig. 3, the nearest separation between the carbon atom and the surfaces is below 2 Å, representing a close contact between the surfactant end and the silicate surface. The monolayer conformation of ODTA within the spacing of 13.56 Å in our simulation has been similarly reported in the experiments42,43 where a lateral monolayer arrangement of ODTA is formed in the clay interlayer at the basal spacing of ∼14 Å with comparable surfactant concentrations. Moreover, in the previous simulation31 on the montmorillonite exchanged completely by hexadecyltrimethylammonium cations, the intercalated surfactants also adopt a lateral monolayer in the stable spacing of 14 Å, which is also consistent with our result. These comparisons suggest that our simulation result is valid.
Fig. 4 presents the results in the basal spacing of 18.56 Å, in which the potential energy of the OM is a little higher than that in the stable spacing (13.56 Å). In the large spacing, some alkyl chains are kept away from the interlayer midplane, leading to a lateral-bilayer. It is found that the headgroups of surfactant are near to the silicate surface, due to the strong electrostatic interaction between the negative clay surface and the positive headgroups.31 This configuration performance is similar to the previous simulation result for the transition state of hexadecyltrimethyl ammonium cations confined in the montmorillonite clay.31
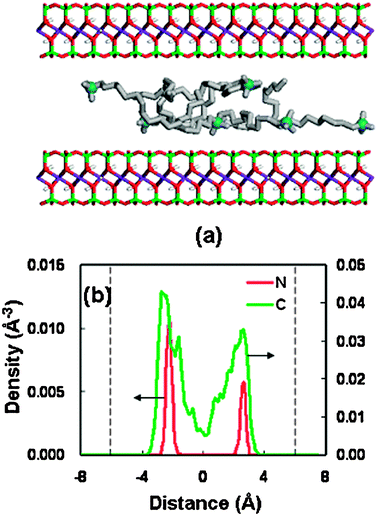 | ||
| Fig. 4 (a) Snapshot of the structure at a basal spacing of 18.56 Å for OM. The color code is the same as Fig. 3(a). (b) Density distributions of the surfactant at a basal spacing of 18.56 Å (nitrogen in red, alkyl chain in green); the dashed line represents the silicate surface. | ||
3.2 Swelling and structure of organoclay in scCO2
We performed the adsorption GEMC simulation of carbon dioxide in the organoclay with a series of basal spacings under an external surrounding pressure of 8.4 MPa and a temperature of 323.15 K. In each of the GEMC simulations, once at adsorption equilibrium, the state of simulation cell 2 (bulk phase) should be at the supercritical fluid state with the desired temperature and pressure. This has been confirmed by the simulated pressure of cell 2, which fluctuated around 8.4 MPa (see the insert of Fig. 5(a)). The average simulated density of CO2 in cell 2 is 0.21 g mL−1, which is close to the corresponding experimental CO2 density. Moreover, the radial distribution function (RDF) of CO2 fluid in cell 2 has also been simulated, and is consistent with the literature result44 (see Fig. S1 of the supplementary information†).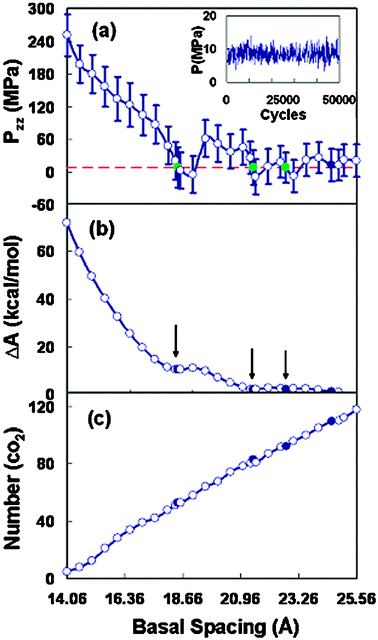 | ||
Fig. 5 (a) Normal component of the pressure tensor as a function of the basal spacing for Wyoming montmorillonites. The horizontal line corresponds to the bulk pressure (8.4 MPa). The insert figure shows the pressure evaluation of simulation cell 2 under the equilibrium simulation of 50![[thin space (1/6-em)]](https://www.rsc.org/images/entities/char_2009.gif) 000 cycles. (b) Swelling free energy as a function of the basal spacing. (c) Average adsorption number of CO2 in the organoclay as a function of the basal spacing. 000 cycles. (b) Swelling free energy as a function of the basal spacing. (c) Average adsorption number of CO2 in the organoclay as a function of the basal spacing. | ||
Cell 1 can be considered as the clay phase that is in equilibrium with the surrounding supercritical fluid (cell 2). The pressure component (Pzz) normal to the clay sheet in simulation cell 1 (adsorbed phase) was calculated. The swelling free energy (ΔA) at any spacing (Z) was calculated by integration of the normal component of pressure Pzz by the following equation,45–47
 | (2) |
The result for the normal component, Pzz, as a function of clay layer spacing is presented in Fig. 5(a), and the corresponding swelling free energy is displayed in Fig. 5(b). The horizontal dashed line (Fig. 5(a)) represents the external bulk pressure (8.4 MPa). In the smaller spacings, where the repulsive interaction between the interlayer species becomes significant, there exists a larger positive pressure. The pressure Pzz is oscillating around the bulk pressure line, indicating the presence of multiple mechanically stable spacings for the organoclay in scCO2.47 This oscillation is related to the formation of various fluid layers within the interlayer space. When the normal pressure in the clay pore is lower than the external environmental pressure, there is a tendency for the clay gallery to shrink, whereas a higher Pzz pressure than the external one will induce clay layer swelling.25 The stable spacings in scCO2 are usually larger than that in vacuum. The mechanically stable spacings for the organoclay appear to be at 18.46 Å, 21.46 Å, and 22.76 Å, respectively. Note that there is a fourth crossing-point with negative slope at 24.56 Å. However, it is not conclusive due to the statistical noise associated with Pzz for the larger layer separations.48
The thermodynamically stable spacings can be determined by the minima in the plot of the swelling free energy. In Fig. 5(b), the swelling free energy curve possesses two obvious plateaus, located at ∼18.46 Å and ∼21.46 Å, respectively. The plateau positions are actually situated in the local minimum points in the free energy curve, corresponding to the crossing points in the Pzz curve (Fig. 5(a)). From the trends of free energy, the expansion (swelling) of the clay spacings is thermodynamically favorable for the surfactant-modified montmorillonite. This result suggests that the larger basal spacing beyond the range of 21.46 Å is more stable for the organoclay submersed in the scCO2 fluid. In the smaller clay pore, the normal pressure is so large that the organoclay-CO2 system is essentially in an unstable state. From the free energy curve, the basal spacing of ∼18.46 Å can be believed to be a metastable state.
The adsorption content of carbon dioxide in the slit pore of organoclay, as a function of the basal spacing, is shown in Fig. 5(c). The adsorption amount of carbon dioxide increases monotonically with uniform continuity. This continuous filling of CO2 molecules with an increase in the spacing may suggest that there is no formation of defined CO2 layer or interlayer fluid phase transition. This observation is likely due to the amorphous conformation of intercalated surfactant molecules in the pore, making the ordered structure formation of interlayer CO2 molecules more difficult.
To gain the direct visual information on the interlayer structure for the organoclay-CO2 system under the stable spacings, the snapshots of the interlayer configuration and the corresponding density profiles were analyzed. Fig. 6 shows a typical result in the spacing of 18.46 Å. The snapshot (Fig. 6(a)) shows that the surfactant molecules and the CO2 molecules are randomly well mixed within the clay pore. All the atomic density profiles (Fig. 6(b) and (c)) exhibit the layering behavior. The distribution of headgroups (nitrogen) exhibits two separate sharp peaks, which are close to the clay surfaces. The solid surfaces lie around ±6 Å in the density distributions. This behavior can be ascribed to the stronger electrostatic interaction, which leads to the so-called end-tethered binding between the surfactant molecules and the silicate surfaces.49
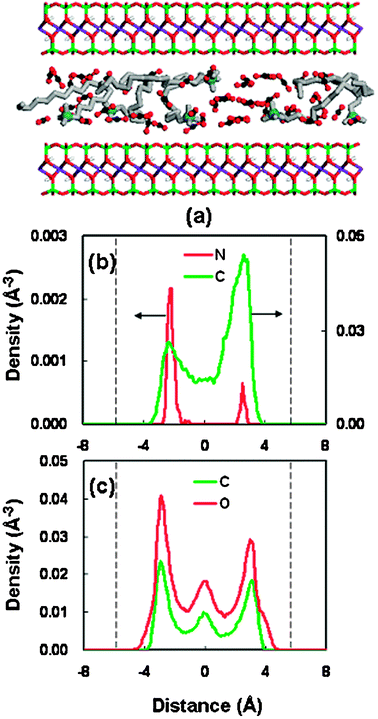 | ||
| Fig. 6 (a) Snapshot of the structure at a basal spacing of 18.46 Å for OM. OM color code as Fig. 3(a). CO2 molecules are shown as red spheres (oxygen atom) and black spheres (carbon atom). (b) Density distributions of the surfactant at a basal spacing of 18.46 Å (nitrogen in red, alkyl chain in green); the dashed line represent the silicate surface. (c) Density distributions of CO2 at a basal spacing of 18.46 Å (oxygen atom in red, carbon atom in green); the dashed line represents the silicate surface. | ||
The density profile of the alkyl chain (carbon atom) shows weak bilayer distribution. Actually, a careful inspection of the snapshot (Fig. 6(a)) indicates that the interlayer arrangement of the alkyl chains is a mixture of lateral bilayer and paraffin-type monolayer. However, the pronounced density peaks for the alkyl chain near the silicate surfaces may also mean that there exists a chain-binding, which is due to the vdW interaction between the surfactant chains and the surface.50 Moreover, we have carried out some supplementary calculations on the vdW interaction energies of surfactant-surface and surfactant-surfactant between the scCO2 and vacuum cases. With the intercalation of scCO2 molecules, the interaction energies between the clay surface and the surfactant molecules increase, whereas the interaction between surfactant molecules decreases. This result has been presented in Table S3 (supplementary information).† This energetic behavior can be ascribed to the solvation effect of scCO2 molecules. This solvation coordination around the surfactant chains reduces the mutual contact among the surfactant molecules. Simultaneously, the solvation effect may bring about an increased contact between the surfactant tail and the silicate surface, strengthening the so-called chain-binding interaction.
The density profile for the CO2 molecules exhibits a trilayer structure, with the oxygen and carbon atoms having the same peak and valley positions. This structure pattern means no specific orientation for the confined CO2 molecules. This result is different from the previous report that the CO2 molecules confined in the clay pore are oriented with a tilted angle.51 This random orientation performance of CO2 molecules in this system can be attributed to the presence of intercalated surfactant molecules.
For the other stable pores (21.46 Å and 22.76 Å), a similar structure behavior has been observed, as shown in Fig. 7 and 8. As the pore width increases, more complicated layer structures appear, with the long-chain alkylammonium cations adopting the packing arrangements of both a pseudotrilayer and paraffin-type bilayer.52,53 They are generally referred to as a hybrid of multilayer conformations. It is noted that the density profiles (Fig. 7 and 8) of surfactants (headgroup nitrogen and alkyl chain) illustrate a relatively symmetrical distribution, as compared to that in the pore of 18.46 Å (Fig. 6(b)). This symmetrical pattern in the larger spacings represents a more stable structure, which can be confirmed from the variation trend of the swelling free-energy plot (Fig. 5(b)). The solvent distributions in the three stable spacings (Fig. 6(c)–8(c)) suggest that the swelling of organoclay proceeds from the dry state (without solvent) through the formation of two, three, and four CO2 layers.
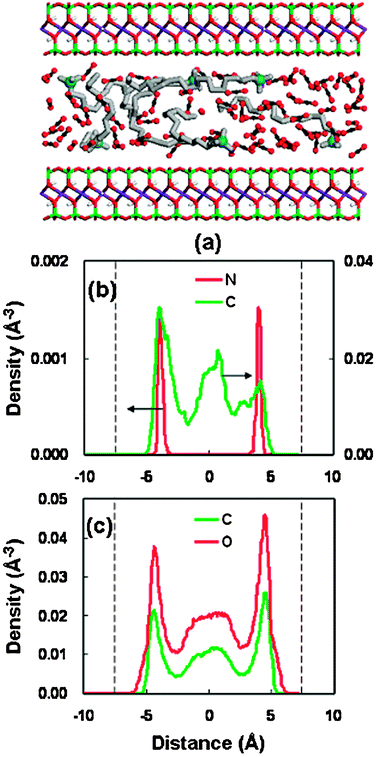 | ||
| Fig. 7 Same as Fig. 6 but for the basal spacing of 21.46 Å. | ||
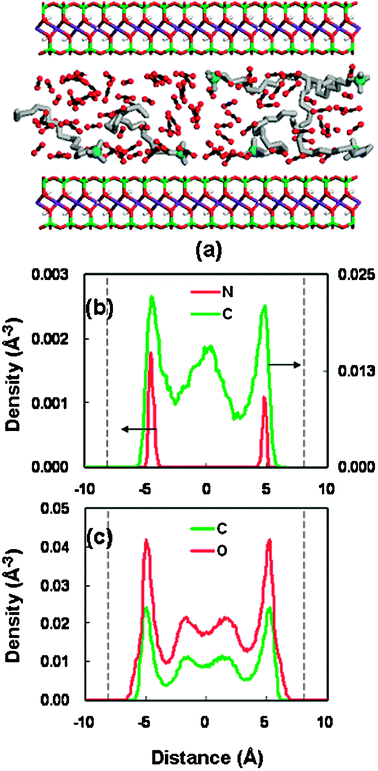 | ||
| Fig. 8 Same as Fig. 6 but for the basal spacing of 22.76 Å. | ||
Fig. 9 presents the interlayer structure in the unstable spacing of 16.56 Å. A disordered bilayer arrangement of alkyl chains is found within the gallery. A careful observation on the snapshot configuration (Fig. 9(a)) and the density distribution (Fig. 9(b)) shows that in the unstable spacing the headgroups are more separated/isolated from the silicate sheet, as compared with those in the stable spacings. This relatively larger separation might lead to the weak interaction between the positive headgroups and the negative silicate surface in this spacing.
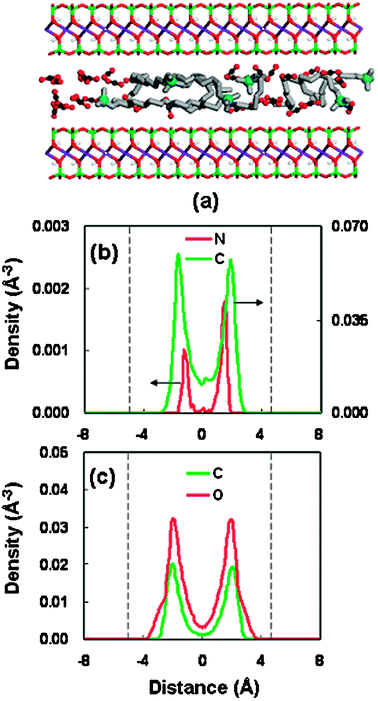 | ||
| Fig. 9 Same as Fig. 6 but for the basal spacing of 16.56 Å. | ||
In order to illustrate the solvation behavior in the interlayer space, we have also simulated the radial distribution function (RDF) for the scCO2 molecules around the surfactants in the clay pore. Fig. 10 shows the RDFs between the surfactant headgroup (nitrogen), the middle and end carbon atoms (C9, C18) along the surfactant backbone and the carbon atom in the CO2 molecules (denoted gNCcgC9Cc, gC18Cc, respectively). For all the RDFs, the existence of obvious first peaks is the evidence of well solvated structures between the surfactant and CO2 in the clay pore. The first peak position in the RDFs of gCiCc is at ∼4.1 Å, which is identical to that in the previously simulated RDFs between the end carbon atoms of the polyether surfactant and the CO2 molecules.54 We can observe that the major peak for the headgroup RDF is located at 5.4 Å. The shift in the first peak position between gNCc and gCiCc reflects a relatively far-away contact between the CO2 molecules and the headgroups. This behavior is attributed to the larger steric repulsion from the bulky headgroups. The larger height in the first peak of gNCc is due to the headgroup location near the surfaces in the clay pore, where more CO2 molecules can be accumulated.
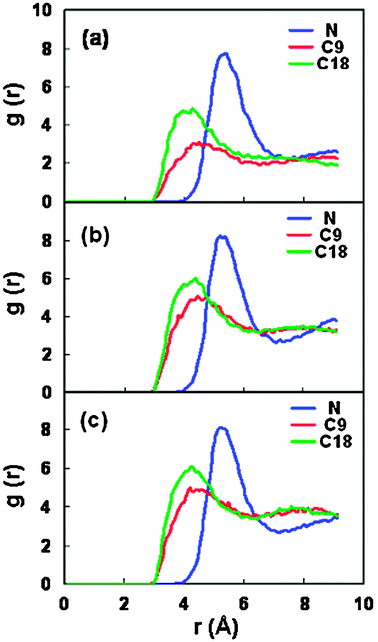 | ||
| Fig. 10 The radial distribution functions between the carbon atoms of adsorbed CO2 molecules and the head nitrogen, middle C9 and tail C18 atoms in the surfactant for three stable spacings. (a) 18.46 Å, (b) 21.46 Å, (c) 22.76 Å. | ||
The structure or conformation of surfactants within clay pores is very critical to the maximum extent of basal expansion in the presence of supercritical fluids.14 Our simulation result indicates that the expansion of organoclay in scCO2 is thermodynamically favorable. This behavior is associated with the specific steric arrangement of surfactants within the clay gallery, with a combination of the end-tethered binding and the side-chain binding for the intercalated long-chain alkylammonium cations. The solvation interaction between the surfactant and CO2 molecules enhances the extended conformation of intercalated surfactants within the clay pore.
We have performed some supplementary GEMC simulations on the swelling stability of Na-montmorillonite clay in scCO2, in order to check how the results are affected if the gallery of montmorillonite does not contain the surfactant cations. Fig. S1† (in the supplementary information) gives the corresponding result. It was observed that there also exist several stable mechanical spacings for this kind of Na-montmorillonite immersed in scCO2. The overall swelling behavior of natural clay is qualitatively consistent with the observation of organoclay. The first stable spacing is larger than that of the organoclay in vacuum condition, but smaller than that of the organoclay in scCO2. As compared with the organoclay, the natural clay (without surfactant) has a lower degree of swelling, thus, this enhanced swelling extent for the organoclay could be ascribed to the effect of the intercalated surfactants.
At present, a direct comparison of the swelling and interlayer structure of organoclays in the environment of supercritical fluids between simulation and experiment is relatively difficult due to the very limited experimental reports. Serhatkulu et al.1 experimentally observed that the gallery spacing of natural clay is doubled by using the scCO2 processing medium. This result is qualitatively consistent with our simulation observation. In the report by Thompson et al.,14 the organoclay modified by mono-alkyl quaternary ammonium shows no structure expansion in the scCO2 environment. The cause of this difference is not clear. However, in their works,13,14 when the dialkyl and trialkyl quaternary ammoniums were used as the surfactants, an increase in the basal spacing was still observed in scCO2. Recently, Naveau et al.9 used scCO2 as an efficient medium to prepare organoclays and they found that montmorillonite can be significantly expanded by this method. These complicated phenomena suggest that an extensive systematic study is indeed necessary in order to understand the swelling mechanism.
4. Conclusions
Molecular simulations have been performed to study the swelling stability of the montmorillonite clay modified by C18 alkylammonium cations both in vacuum and in supercritical carbon dioxide fluid. In the vacuum condition, the stable spacing of the organoclay is found to be around 13.56 Å based on the energy minimum of the canonical MC simulation. The corresponding interlayer structure is the monolayer arrangement with the intercalated surfactant chains lying parallel to the silicate surface. This simulation observation has been confirmed in the experimental result. In the supercritical carbon dioxide fluid, a series of GEMC simulations have been used to determine the mechanically and thermodynamically stable spacings. The presence of scCO2 leads to the gallery swelling of the organoclay. The interlayer conformation and structure in the stable spacings show that the headgroups in the surfactant cations prefer to locate near the silicate surface due to the strong electrostatic attraction. The expansion of organoclay in scCO2 is associated with the specific steric arrangement of the long-chain alkylammonium cations, with a combination of the end-tethered binding and the side-chain binding with the silicate surface. The solvation interaction between the intercalated surfactants and the CO2 molecules within the confined clay pore may enhance the steric or extended conformation of intercalated surfactants. This swelling of organoclays in the supercritical fluid medium is very important in nanocomposite preparations and applications. Further studies are under way to investigate the effect of different cation exchange capacities on the stability of organoclays in supercritical fluids.Acknowledgements
This work was supported by the Natural Science Foundation of China under Grant 20776066, 20976079, and the Natural Science Foundation from Jiangsu Province (BK2009359).References
- G. K. Serhatkulu, C. Dilek and E. Gulari, J. Supercrit. Fluids, 2006, 39, 264–270 CrossRef CAS.
- P. Podsiadlo, A. K. Kaushik, E. M. Arruda, A. M. Waas, B. S. Shim, J. Xu, H. Nandivada, B. G. Pumplin, J. Lahann, A. Ramamoorthy and N. A. Kotov, Science, 2007, 318, 80–83 CrossRef CAS.
- Q. H. Zeng, A. B. Yu and G. Q. Lu, Prog. Polym. Sci., 2008, 33, 191–269 CrossRef CAS.
- J. W. Gilman, C. L. Jackson, A. B. Morgan, J. R. Harris, E. Manias, E. P. Giannelis, M. Wuthenow, D. Hilton and S. H. Phillips, Chem. Mater., 2000, 12, 1866–1873 CrossRef CAS.
- J. Zhu, A. B. Morgan, F. J. Lamelas and C. A. Wilkie, Chem. Mater., 2001, 13, 3774–3780 CrossRef CAS.
- M. Alexandre and P. Dubois, Mater. Sci. Eng., R, 2000, 28, 1–63 CrossRef.
- S. S. Ray and S. Okamoto, Prog. Polym. Sci., 2003, 28, 1539–641 CrossRef CAS.
- A. Usuki, N. Hasegawa and M. Kato, Adv. Polym. Sci., 2005, 179, 135–195 CAS.
- E. Naveau, C. Calberg, C. Detrembleur, S. Bourbigot, C. Jerome and M. Alexandre, Polymer, 2009, 50, 1438–1446 CrossRef CAS.
- A. Zerda, T. C. Caskey and A. J. Lesser, Macromolecules, 2003, 36, 1603–1608 CrossRef CAS.
- Q. Zhao and E. T. Samulski, Macromolecules, 2005, 38, 7967–7971 CrossRef CAS.
- M. Manitiu, R. J. Bellair, S. Horsch, E. Gulari and R. M. Kannan, Macromolecules, 2008, 41, 8038–8046 CrossRef CAS.
- M. R. Thompson, J. Liu, H. Krump, L. K. Kostanski, F. D. Fasulo and W. R. Rodgers, J. Colloid Interface Sci., 2008, 324, 177–184 CrossRef CAS.
- M. R. Thompson, M. P. Balogh, R. L. Speer, Jr., P. D. Fasulo and W. R. Rodgers, J. Chem. Phys., 2009, 130, 044705 CrossRef CAS.
- H. D. Whitley and D. E. Smith, J. Chem. Phys., 2004, 120, 5387–5395 CrossRef CAS.
- S. Karaborni, B. Smit, W. Heidug, J. Urai and E. van Oort, Science, 1996, 271, 1102–1104 CrossRef CAS.
- M. Chavez-Paez, K. Van Workum, L. dePablo and J. J. dePablo, J. Chem. Phys., 2001, 114, 1405–1413 CrossRef.
- X. D. Liu and X. C. Lu, Angew. Chem., Int. Ed., 2006, 45, 6300–6303 CrossRef CAS.
- L. de Pablo, M. L. Chavez and J. J. de Pablo, Langmuir, 2005, 21, 10874–10884 CrossRef CAS.
- M. L. Chavez, L. de Pablo and J. J. de Pablo, Langmuir, 2004, 20, 10764–10770 CrossRef.
- G. Rutkai and T. Kristof, Chem. Phys. Lett., 2008, 462, 269–274 CrossRef CAS.
- H. Heinz, R. A. Vaia, R. Krishnamoorti and B. L. Farmer, Chem. Mater., 2007, 19, 59–68 CrossRef CAS.
- D. R. Paul, Q. H. Zeng, A. B. Yu and G. Q. Lu, J. Colloid Interface Sci., 2005, 292, 462–468 CrossRef CAS.
- X. D. Liu, X. C. Lu, R. C. Wang, H. Q. Zhou and S. J. Xu, Clays Clay Miner., 2007, 55, 554–564 CrossRef CAS.
- T. J. Tambach, E. J. M. Hensen and B. Smit, J. Phys. Chem. B, 2004, 108, 7586–7596 CrossRef CAS.
- S. P. Newman, T. Di Cristina, P. V. Coveney and W. Jones, Langmuir, 2002, 18, 2933–2939 CrossRef CAS.
- R. T. Cygan, S. Guggenheim and A. F. Koster van Groos, J. Phys. Chem. B, 2004, 108(39), 15141–15149 CrossRef CAS.
- Q. H. Zeng, A. B. Yu, G. Q. Lu and R. K. Standish, Chem. Mater., 2003, 15, 4732–4738 CrossRef CAS.
- N. T. Skipper, F. R. C. Chang and G. Sposito, Clays Clay Miner., 1995, 43, 285–293 CrossRef CAS.
- D. R. Katti, S. R. Schmidt, P. Ghosh and K. S. Katti, Can. Geotech. J., 2007, 44, 425–435 CrossRef CAS.
- H. P. He, J. Galy and J. F. Gerard, J. Phys. Chem. B, 2005, 109, 13301–13306 CrossRef CAS.
- R. T. Cygan, J. J. Liang and A. G. Kalinichev, J. Phys. Chem. B, 2004, 108, 1255–1266 CrossRef CAS.
- S. L. Mayo, B. D. Olafson and W. A. Goddard, J. Phys. Chem., 1990, 94, 8897–8909 CrossRef CAS.
- G. Tanaka and L. A. Goettler, Polymer, 2002, 43, 541–553 CrossRef CAS.
- B. J. Teppen, K. Rasmussen, P. M. Bertsch, D. M. Miller and L. Schfer, J. Phys. Chem. B, 1997, 101, 1579–1587 CrossRef CAS.
- J. G. Harris and K. H. Yung, J. Phys. Chem., 1995, 99, 12021–12024 CrossRef CAS.
- L. L. Liu, X. N. Yang and Z. J. Xu, J. Chem. Phys., 2008, 128, 184712 CrossRef.
- B. Smit, S. Karaborni and J. I. Siepmann, J. Chem. Phys., 1995, 102, 2126–2140 CrossRef CAS.
- S. C. Mcgrother and K. E. Gubbins, Mol. Phys., 1999, 97, 955–965 CrossRef CAS.
- R. J. Sadus, Molecular Simulation of Fluids Theory, Algorithms and Object-Orientation, Elsevier, Amsterdam, 1999 Search PubMed.
- G. Tasi and F. Mizukami, J. Math. Chem., 1999, 25, 55–64 CrossRef CAS.
- Y. F. Xi, R. L. Frost and H. P. He, J. Colloid Interface Sci., 2007, 305, 150–158 CrossRef CAS.
- Y. F. Xi, R. L. Frost, H. P. He, T. Kloprogge and T. Bostrom, Langmuir, 2005, 21, 8675–8680 CrossRef CAS.
- J. E. Adams and A. Siavosh-Haghighi, J. Phys. Chem. B, 2002, 106, 7973–7980 CrossRef CAS.
- M. Chavez-paez, L. dePablo and J. J. dePablo, J. Chem. Phys., 2001, 114, 10948–10953 CrossRef CAS.
- M. Schoen, D. J. Diestler and J. H. Cushman, J. Chem. Phys., 1987, 87, 5464–5476 CrossRef CAS.
- R. M. Shroll and D. E. Smith, J. Chem. Phys., 1999, 111, 9025–9033 CrossRef CAS.
- M. Chavez-Paez, K. V. Workum, L. dePablo and J. J. dePablo, J. Chem. Phys., 2001, 114, 1405–1413 CrossRef.
- H. P. He, J. Duchet, J. Galy and J. F. Gerard, J. Colloid Interface Sci., 2006, 295, 202–208 CrossRef CAS.
- S. H. Xu and S. A. Boyd, Langmuir, 1995, 11, 2508–2514 CrossRef CAS.
- X. N. Yang and C. J. Zhang, Chem. Phys. Lett., 2005, 407, 427–432 CrossRef CAS.
- J. L. Bonczek, W. G. Harris and P. Nkedi-Kizza, Clays Clay Miner., 2002, 50, 11–17 CrossRef CAS.
- H. P. He, R. L. Frost, T. Bostrom, P. Yuan, L. Duong, D. Yang, Y. F. Xi and J. T. Kloprogge, Appl. Clay Sci., 2006, 31, 262–271 CrossRef CAS.
- S. Senapati and M. L. Berkowitz, J. Phys. Chem. B, 2003, 107, 12906–12916 CrossRef CAS.
Footnote |
| † Electronic supplementary information (ESI) available: Model parameters and data. See DOI: 10.1039/c0cp00505c |
| This journal is © the Owner Societies 2011 |
