Combined XRD and infrared studies of pyridinium species in (PyH)3[PW12O40] single crystals†
Céline
Pichon
a,
Pierre
Mialane
a,
Jérôme
Marrot
a,
Claude
Binet
b,
Alexandre
Vimont
*b,
Arnaud
Travert
b and
Jean-Claude
Lavalley
b
aInstitut Lavoisier, UMR 8180, Université de Versailles Saint-Quentin, 45 Avenue des Etats-Unis, 78035 Versailles Cedex, France
bLaboratoire Catalyse et Spectrochimie, ENSICAEN—Université de Caen—CNRS, 6 Bd. du Maréchal Juin, 14050 Caen Cedex, France. E-mail: alexandre.vimont@ensicaen.fr
First published on 28th October 2010
Abstract
The pyridinium salts of 12-tungstophosphoric acid (PyH)3[PW12O40]·2CH3CN (1) and (PyH)3[PW12O40] (2) have been prepared and studied by single crystal and powder X-ray diffraction (XRD) in order to characterize the crystallographic sites occupied by the pyridinium species. The three PyH+ species are located on two unequivalent sites. Two species are linearly H-bonded to the oxygen atoms of the Keggins unit (α species), whereas the third one (β) forms a bent H-bond. In order to determine the infrared bands characterizing each type of pyridinium species in the 1650–1300 cm−1 range, infrared spectra have been recorded from room temperature to 100 K. They reveal that only α pyridinium species give rise to the unusual splitting of the PyH+ν8b and ν19b modes, whereas β pyridinium species lead to a classical pyridinium spectrum.
1. Introduction
Pyridine adsorption on catalyst surfaces is commonly used for the infrared characterization of the Lewis or Brönsted surface acidities.1–5 In particular, Brönsted acidity is very well characterized by the formation of an adsorbed pyridinium ion, the ν19b vibration mode being then upward shifted from ∼1445 cm−1 to ∼1540 cm−1.Two decades ago, unusual ν8b and ν19b band doublings were observed in the photoacoustic spectrum of pyridinium species produced by pyridine absorption in the crystalline 12-tungstophosphoric acid H3[PW12O40].6 The band doublings were proposed to be due to crystal site effects, but this remains to be proved since the ν19b and ν8b pyridinium modes are generally not affected by the nature of the counter anion.7 More recently, the band doublings were assigned to the formation of the bis-pyridinium (PyH+Py) ion.8–10 However, this interpretation was later discarded using combined infrared (IR) and thermogravimetric analysis (TGA).11
Recently, we have briefly reported the synthesis of the (PyH)3[PW12O40]·2CH3CN complex (1) which infrared spectrum presents a similar splitting of the ν8b and ν19b bands.11 The lack of crystallographic data on this compound, however, prevented any consideration to be made on the structure of the pyridinium species leading to such a splitting. These informations are essential for the understanding of the pyridinium cation vibration modes in such materials.
In the present study, we report the X-ray structural determination of 1 as well as the structure of the CH3CN-desolvated (PyH)3[PW12O40] compound 2. These data have been correlated with the IR spectra of these samples recorded at room and low temperatures, allowing us to show that the band doublings are not only due to crystal site effects.
2. Experimental details
All chemicals were of reagent grade and used as received. The complexes (PyH)3[PW12O40]·2CH3CN (1) and (PyH)3[PW12O40] (2) have been synthesized as previously described.11X-Ray diffraction
For 1 and 2, intensity data collections were carried out with a Bruker Nonius X8 APEX 2 diffractometer with a CCD detector using a Mo Kα monochromatized radiation (λ = 0.71073 Å) and recorded at room temperature. For 1, a single-crystal was mounted in a capillary tube. For 2, a single-crystal was mounted on a glass fiber and heated at 353 K for one night. For both compounds, the absorption corrections were based on multiple and symmetry-equivalent reflections in the data set using the SADABS program based on the method of Blessing.12 The structures were solved by direct methods and refined by full-matrix least-squares using the SHELX-TL package.13 For 1 and 2, the hydrogen atoms were located and refined using a constrained “riding” model. All the other atoms were refined anisotropically except for the phosphorus atom in complex 2. X-Ray powder diffraction data were collected on a Siemens D5000 equipped with a Cu Kα radiation for room temperature measurements and a Co Kα radiation for temperature-dependent ones.Infrared spectroscopy
The (PyH)3[PW12O40]·2CH3CN compound was mildly crushed and mixed with a KBr powder (1 mg of the salt diluted into 100 mg of KBr). A pellet was then obtained and placed into a quartz cell equipped with KBr windows, connected to a vacuum line and a furnace for the in situ treatment. To obtain the (PyH)3[PW12O40] compound, the pellet was heated at 353 K overnight. Spectra recorded at low temperature were obtained by cooling the sample holder with liquid nitrogen. Transmission IR spectra were recorded in the 500–4000 cm−1 range, with a 4 cm−1 resolution, on a Nicolet Nexus spectrometer equipped with an extended KBr beam splitting device and a mercury cadmium telluride (MCT) cryodetector.3. Results
The notations used herewith for the oxygen atoms in the Keggin polyanion [PW12O40]3− are illustrated in Scheme 1. W3O13 moieties are formed by edge-sharing WO6 octahedra. Shared oxygen atoms in this unit are denoted as O-edge (Oe). Four W3O13 moieties are tetrahedrally bonded to the central P atom and bonded to each other by sharing vertices. Common oxygen atoms in this arrangement are denoted as O-corner O(c) oxygens. The third type of external oxygen atom belongs to the unshared W![[double bond, length as m-dash]](https://www.rsc.org/images/entities/char_e001.gif) O group, and is denoted as O-terminal O(t). The whole [PW12O40]3− anion is roughly spherical with a diameter of 1 nm.
O group, and is denoted as O-terminal O(t). The whole [PW12O40]3− anion is roughly spherical with a diameter of 1 nm.
![Oxygen notations for the Keggin anion structure [PW12O40]3−.](/image/article/2011/CP/c0cp00446d/c0cp00446d-s1.gif) | ||
| Scheme 1 Oxygen notations for the Keggin anion structure [PW12O40]3−. | ||
3.1 Structural determination by XRD analysis
Crystallographic data relative to the structures of (PyH)3[PW12O40]·2CH3CN (1) and (PyH)3[PW12O40] (2) are given in Table 1. The two complexes are represented in Fig. 1a and b, respectively. Single-crystals of compound 2 have been obtained by heating single-crystals of 1 at 353 K for one night. As expected, this thermal treatment has induced a loss of crystallinity, providing crystals of poor quality. Nevertheless, it has been possible to refine the diffraction data to obtain an acceptable structural model for 2. It should be pointed out that the structural characterization of this desolvated species is crucial in order to focus on the infrared characterization of the pyridinium cations at the surface of a polyoxometalate unit. Indeed, compared to 1, the IR characterization of 2 is thus not perturbated by bands arising from co-crystallizing organic solvent molecules. Additionally, we can note that single-crystal X-ray characterization of polyoxometalate desolvated by exposure to air or heating has been only scarcely reported.14![Ball-and-stick and polyhedral representation of (a) (C5H6N)3[PW12O40]·2CH3CN (1) and (b) (C5H6N)3[PW12O40]·2CH3CN (2). Grey octahedra, WO6; black octahedra, PO4; black spheres, C; grey spheres, N; white spheres, H. The dashed lines represent the hydrogen bonds.](/image/article/2011/CP/c0cp00446d/c0cp00446d-f1.gif) | ||
| Fig. 1 Ball-and-stick and polyhedral representation of (a) (C5H6N)3[PW12O40]·2CH3CN (1) and (b) (C5H6N)3[PW12O40]·2CH3CN (2). Grey octahedra, WO6; black octahedra, PO4; black spheres, C; grey spheres, N; white spheres, H. The dashed lines represent the hydrogen bonds. | ||
| 1 | 2 | |
|---|---|---|
a
 .
b .
b
 . .
|
||
| Empirical formula | C19H24N5PW12O40 | C15H18N3PW12O40 |
| Formula weight/g | 3199.6 | 3117.5 |
| Temperature | 293 K | 296 K |
| Crystal system | Monoclinic | Monoclinic |
| Space group | C2/c (No. 15) | P2(1)/n (No. 14) |
| a/Å | 23.5058(4) | 12.216(3) |
| b/Å | 14.3158(4) | 14.035(3) |
| c/Å | 16.6984(5) | 12.988(3) |
| β/° | 119.933(2) | 98.045(13) |
| V/Å3 | 4869.5(2) | 2205.1(8) |
| Z | 4 | 2 |
| d calc/g cm−3 | 4.364 | 4.695 |
| Reflections collected/unique | 128![[thin space (1/6-em)]](https://www.rsc.org/images/entities/char_2009.gif) 879/7200 (Rint = 0.0795) 879/7200 (Rint = 0.0795) |
24722/3887 (Rint = 0.3949) |
| Goodness-of-fit | 1.165 | 0.947 |
| R (>2σ(I)) | R 1(Fo)a = 0.0377 | R 1(Fo)a = 0.1145 |
| wR2(F2o)b = 0.1027 | wR2(F2o)b = 0.2535 | |
| R (all data) | R 1(Fo)a = 0.0434 | R 1(Fo)a = 0.2909 |
| wR2(F2o)b= 0.1141 | wR2(F2o)b = 0.3095 |
Both compounds consist in the well-known [α-PW12O40]3− saturated Keggin-type polyanion with protonated pyridine as counter-ions (Fig. 1a). In 1, in addition to the three pyridinium cations, two acetonitrile molecules are present in the crystal lattice. The CH3CN fragments appear as molecular dimers of antiparallel dipoles, the intermolecular distance being 3.46 Å. For 1, bond lengths and angles of the tungsten octahedra constituting the [α-PW12O40]3− unit are typical of this type of anion.15 In the case of compound 2, the tetrahedral phosphato unit has been found disordered over two positions. This is due to the location of the phosphorus atom on an inversion center, incompatible with the Td symmetry of the Keggin unit, which induces the presence of eight oxygen atoms surrounding the phosphorus atom. These eight oxygen atoms, which are located at the vertices of a distorted cube, were then refined at half-occupancy factors. Such a disorder in a Keggin-type polyoxometalate has been first solved by Evans and Pope,16 and since has been encountered several times.17 While complexes 1 and 2 crystallize in the C2/c and in the P2(1)/n space groups, respectively, the three pyridinium cations can be divided into two groups in both cases. One consists in two crystallographically equivalent molecules (full occupancy), while the other one consists in a crystallographically independent counter-ion (half occupancy).
For compound 1, the nitrogen atoms of the pyridinium rings have been localized considering that the C–C bonds are longer than C–N bonds (dC–N = 1.332–1.340 Å; dC–C = 1.363–1.399 Å). Such localization of the nitrogen atoms is strongly supported by the presence of short distances due to hydrogen bondings between the H atoms connected to the N centers of the pyridinium and oxygen atoms of the [α-PW12O40]3−polyanions. The pyridinium cation in half-occupation site (β1) is involved in a bent H-bonding with two O-corner atoms (dNH⋯Oc = 2.464 Å), while the two other countercations (α1) are both connected to the Keggin anion fragment via a H-bond involving an O-edge atom (dNH⋯Oe = 2.074 Å) (Fig. 1a).The latter H-bond is nearly linear (N–H–Oe = 171°). The protons of the pyridinium cations cannot be located by XRD measurements. They are positioned for the C2v cation symmetry using the length values 0.86 and 0.93 Å for the N–H and C–H bonds, respectively. The short N–H distance here adopted is in accordance with the rather large N(H)⋯O distances (as denoted below) inferring only weak H-bonding perturbations of the N–H bond length.
A more detailed description of the local interaction of α1 and β1 pyridinium species with the Keggin anion is given Scheme 2. For α1 species the pyridinium ring and the O(t)–W–O(e)–W–O(t) Keggin moiety are nearly coplanar. For β1 species the pyridinium ring is atop a butterfly-like set of four O-atoms (two opposite O-corner atoms, noted O(c) and two opposite O-edge atoms, noted O(e)); the H⋯O(e) distance (2.559 Å) is only slightly higher than the H⋯O(c) one (2.464 Å). Examination of the ring bond lengths allows one to deduce the symmetry elements. The symmetry plane containing the N–H bond and normal to the pyridinium ring is clearly defined for β1 species. It is not the case of α1 species for which a symmetry plane not containing the N–H bond can be considered. It is tilted by about 30° from the N–H direction, as indicated by a dashed line in Scheme 2. According to such a symmetry, the ring atom labelled by an asterisk (Scheme 2) would be possibly the N atom. In such a case, the C–N bond lengths would be 1.333 and 1.369 Å instead of 1.333 and 1.359 Å, for the best fitted structure shown in Scheme 2. The existence of a second and less probable rotational conformation of the pyridinium ring suggests a frustrated rotation (depicted by the curved arrows in Scheme 2) around the pseudo C6 axis in a double well potential.
 | ||
| Scheme 2 Description of the structure of α1 and β1 species. | ||
For complex 2, it has not been possible to localize the nitrogen atoms considering C–N distances due to the poor quality of the crystals (vide supra). However, a localization of the nitrogen centers can be proposed by considering the shortest (Py)H⋯O(W) distances (d(N)H⋯O(W) = 1.959 and 2.301 Å), the counter-cations α2 and β2 being all connected to the [PW12O40]3− unit via one H-bond (Fig. 1b). The α2 H-bond, with an O-terminal atom, is the shorter one (1.959 Å) and is nearly linear (N–H–Ot = 173°). The β2 H-bond is bent as also observed for 1 (N–H–O = 150°) and involves an O-edge atom (Fig. 1b). It should be noted, however, that an O-corner atom cannot be excluded because of the orientational disorder of the Keggin units which does not lead to univocal Oe/Oc positions.
Thus, two types of H-bonds (α and β) can be distinguished: (i) linear bonds with moderately short H⋯O distances of about 2.0 Å for α1 and α2 species and (ii) bifurcated or bent bonds with larger H⋯O distances of about 2.4 Å for β1 and β2 species. The strongest H-bonds are expected to be the linear and shorter H-bonds (α). Even in this case, however, the N⋯O distance (∼2.9 Å) is large as compared to the short distances usually reported in the literature (lower than 2.66 Å).18 Hence, the H-bonding energy is expected weak for both types of bonds, α and β.
Powder X-ray diffraction studies of 1 and 2 have been performed. A comparison of the experimental powder X-ray diffraction data carried out at room temperature on 2 (Fig. 2a) and the X-ray powder diffractogram calculated from the single crystal X-ray diffraction data of 2 (Fig. 2c) confirms the validity of the structural model obtained from the single-crystal XRD data and the phase purity of the powder. It also shows that a mild crushing of the crystals does not alter the structure of compound 2. X-Ray thermodiffractometry experiments on the same compound were carried out under air from room temperature to 573 K (Fig. S1, ESI†). The thermodiffractogram recorded at 573 K is shown in Fig. 2b and shows that the structure of compound 2 is stable up to at least 573 K. For compound 1, the X-ray powder diffraction pattern of the freshly filtered, ground crystals obtained at 293 K (Fig. 2d) fits the calculated X-ray powder diffractogram obtained from the single crystal X-ray diffraction study of 1 (Fig. 2e). Nevertheless, the experimental powder X-ray diffraction pattern evolves over hours, with the appearance of peaks corresponding to compound 2 (Fig. S2, ESI†). This shows that a spontaneous desolvation of compound 1 occurs even at room temperature. When a drop of acetonitrile is added to the powder sample, the X-ray powder pattern changes and shows a decrease of the intensity of the peaks corresponding to the non-solvated species 2. This clearly shows the existence of an equilibrium between species 1 and 2 depending on acetonitrile partial pressure. Once the [PW12O40]3−/pyridinium compounds presented here have been fully structurally characterized, the infrared studies of these systems have been performed.
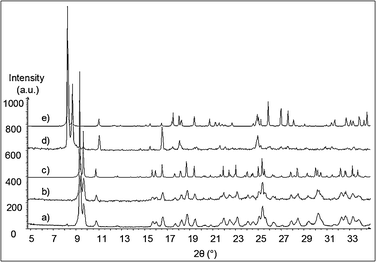 | ||
| Fig. 2 Powder X-ray diffraction pattern performed on 2: experimental diffractogram recorded (a) at room temperature, (b) at 573 K; (c) X-ray powder diffractogram calculated from the single crystal X-ray diffraction data of 2. Powder X-ray diffraction pattern performed on 1: (d) experimental diffractogram recorded at room temperature; (e) X-ray powder diffractogram calculated from the single crystal X-ray diffraction study of 1. | ||
3.2 Study of the pyridinium species using infrared spectroscopy
The spectrum of the Keggin [PW12O40]3− anion displays very intense bands in the 1100–750 cm−1 range, so that only pyridinium bands out of that spectral range can be observed. Thus attention was paid to ring stretching modes, δ(NH) and in-plane δ(CH) bending modes above 1100 cm−1 as well as to the ν(NH) band in the 2800–3200 cm−1 frequency range. The bands notation used below comes from the one usually used for pyridine.19 The assignments for some normal modes are not straightforward.7,20,21 The more recent Odinokov attributions7 are used in the following.Single crystals of 1 and 2 were incorporated in a KBr matrix by a mild crushing. The presence of CH3CN in compound 1 is clearly characterized in the spectrum by the ν(CN) band doublet at 2250–2275 cm−1 (not shown). The spectra are shown in the range of the pyridinium aromatic cycle (Fig. 3, right) and the ν(NH) stretching modes (Fig. 3, left) for compounds 1 (spectrum a) and 2 (spectrum b). Bands at 1443 and 1365 cm−1 due to the δ(CH3) modes of CH3CN in compound 1 are not seen for compound 2 (spectrum b) confirming that CH3CN completely disappears upon heating compound 1 at 353 K.
![IR spectra of the pyridinium salt single-crystals recorded at rt in KBr matrix. (a) (PyH)3[PW12O40]·2CH3CN (compound 1); (b) (PyH)3[PW12O40] (compound 2). Bands at 1443 and 1365 cm−1 due to the δ(CH3) modes of CH3CN in compound 1 are indicated by an asterisk (spectrum a).](/image/article/2011/CP/c0cp00446d/c0cp00446d-f3.gif) | ||
| Fig. 3 IR spectra of the pyridinium salt single-crystals recorded at rt in KBr matrix. (a) (PyH)3[PW12O40]·2CH3CN (compound 1); (b) (PyH)3[PW12O40] (compound 2). Bands at 1443 and 1365 cm−1 due to the δ(CH3) modes of CH3CN in compound 1 are indicated by an asterisk (spectrum a). | ||
The ν(NH) band gives rise to a wide band spreading from 3400 to 2800 cm−1 with very deep Evans holes due to Fermi resonances as generally observed.22,23 The center of gravity can be estimated to be about 3120 cm−1, a higher value compared to those observed at around 3060 cm−1 when the counter ions are either BF4−, SbCl6− or ClO4−.22 Hence, the strength of the hydrogen bonding is weak, in agreement with the XRD results indicating rather long N⋯O distances.
Because of the weakness of the pyridinium bands in the spectral range 1300–1100 cm−1 and of their controversial assignments,7,20,21 most of the following discussion will focus on the ring stretching modes: ν8a, ν8b, ν19b and ν19a. The most striking feature of the IR spectra is the clear splitting of the ν8b and ν19b modes (Fig. 3) which is unusual for pyridinium species. The ν8b components are located at 1613 and 1603 cm−1 for compounds 1 and 2, the ν19b components being situated either at 1542 and 1532 cm−1 for compound 1 or at 1542 and 1530 cm−1 for compound 2. Such a band doubling is also observed for the band denoted as “δ(NH)” in the spectrum a (1336 and 1328 cm−1), while it is unresolved in the spectrum b (1332 cm−1).
Upon cooling, the spectra become more complex due to a better resolution: (i) the increase of the spacing between the two components of the ν8b and ν19b doublets leads to the appearance of central components which are better defined by deconvolution (Fig. 4, spectrum c), and (ii) the bands appearing as shoulders to the main ν8a and ν19a bands at room temperature (1632 and 1482 cm−1) are also better resolved.
![Pyridinium bands of (PyH)3[PW12O40] (compound 2), at (a) rt, (b) about 150 K, (c) about 100 K. Band deconvolutions are performed for spectrum c. Deconvoluted bands due to β species are shadowed. Inset: focus on the effect of the temperature decrease on the splittings of the ν8b (left) and ν19b (right) bands.](/image/article/2011/CP/c0cp00446d/c0cp00446d-f4.gif) | ||
| Fig. 4 Pyridinium bands of (PyH)3[PW12O40] (compound 2), at (a) rt, (b) about 150 K, (c) about 100 K. Band deconvolutions are performed for spectrum c. Deconvoluted bands due to β species are shadowed. Inset: focus on the effect of the temperature decrease on the splittings of the ν8b (left) and ν19b (right) bands. | ||
The spacing of the ν8b and ν19b doublets increases from 12 to 18–19 cm−1 upon cooling (Fig. 4, inset) but the doublets remain centered on the same mean values (1609 and 1536 cm−1, respectively) thus indicating that they characterize the same species. A detailed deconvolution of the bands (Fig. 4, spectrum c) shows that the intensities of the central bands merging in the ν8b and ν19b doublets (1611 and 1539 cm−1 respectively) are about half of the total intensities of the corresponding doublets. Such intensity ratio allows one to assign the ν8a and ν8b doublets to α pyridinium species and the central bands to β ones (Table 2). Moreover, the ν8a and ν19a bands are resolved into two components. From the intensity criterion, the low wavenumber component of the ν8a and ν19a bands can be associated with the central band merging between the doublet components of the ν8b and ν19b bands (Table 2). It is worthwhile noticing that each component of the doublets cannot be assigned to distinct species occupying unequivalent crystallographic sites. If it was the case, the ν8b and ν19b wavenumbers for one site would decrease upon cooling, whereas they would increase for the other site, the mean wavenumbers being constant. Such a correlation between two distinct sites is hardly conceivable, all the more that XRD results show that the two sites involved in the α species formation are equivalent. Hence, the origin of doubling cannot be due to site effects (heterogeneity of the sites). Finally, wavenumbers reported in Table 2 show that β pyridinium species give rise to classical pyridinium bands whereas the α pyridinium species give rise to a splitting of the ν8b and ν19b bands. The ν8b and ν19b wavenumbers for β species (1611 and 1539 cm−1) are nearly the same as the mean values for the corresponding band doublets assigned to α species (1609 and 1536 cm−1). This shows that the site effect on the ν8b and ν19b modes is rather weak (2 or 3 cm−1).
The lifting of a vibrational degeneracy cannot be considered to explain the ν8b and ν19b band splittings for α species since vibrational levels are not degenerate in the C2v symmetry point group. Vibrational intermolecular couplings between pyridinium α species (Davidov splitting) could be invoked. However the existence of a double well potential deduced from the XRD results and discussed above strongly suggests another explanation: the frustrated rotation of the pyridinium ring could induce the splitting of some vibrational modes by a tunneling effect. For example such a two well potential function has been recently established for order/disorder phase transition in the d5-PyHIO4 salt at 300 K.24 To confirm such an explanation, further infrared studies are required.
4. Conclusions
The purpose of this study was to identify the pyridinium species at the origin of the band splittings occurring when pyridine is absorbed in the H3[PW12O40] compound. To this aim, a (PyH)3[PW12O40] salt was prepared (compound 2) using a crystalline (PyH)3[PW12O40]·2CH3CN powder (compound 1) by acetonitrile evaporation upon heating at 353 K. XRD structural determination of both compounds shows that three PyH+ species are located on two unequivalent sites: two equivalent α species are linearly H-bonded to either O(e) (compound 1) or O(t) (compound 2) whereas the third one (β) forms a bent H-bond with the Keggin unit. Recording infrared spectra at low temperature allows the attribution of the bands characterizing each type of pyridinium species situated in the 1650–1300 cm−1 range. It appears that only α pyridinium species give rise to the unusual splitting of the ν8b and ν19b modes, whereas β pyridinium species lead to a classical pyridinium spectrum. The origin of the band doubling characterizing the α pyridinium is currently under study. Finally, this study emphasizes the contribution of XRD studies of well defined single crystals to the elucidation of the structure of absorbed species formed on an important class of heterogeneous catalysts such as H3[PW12O40] materials.References
- H. Knözinger, in Elementary Reaction Steps in Heterogeneous Catalysis, ed. R. W. Joyner and R. A. van Santen, Kluwer, Dortrecht, 1993, p. 267 Search PubMed.
- J. A. Lercher, C. Gründling and G. Eder-Mirth, Catal. Today, 1996, 27, 353 CrossRef CAS.
- H. Knözinger, in Handbook of Heterogeneous Catalysis, ed. H. Knözinger, J. Weitkamp and G. Ertl, Wiley-VCH, 1997, p. 707 Search PubMed.
- G. Busca, Catal. Today, 1998, 41, 191 CrossRef CAS.
- E. Payen, J. Grimblot, J.-C. Lavalley, M. Daturi and F. Maugé, in Handbook of Vibrational Spectroscopy, ed. J. M. Chalmers and R. Griffiths, Wiley, 2001 Search PubMed.
- J. G. Highfield and J. B. Moffat, J. Catal., 1984, 88, 177 CrossRef CAS.
- V. P. Glazunov and S. E. Odinokov, Spectrochim. Acta, Part A, 1982, 38, 399 CrossRef.
- N. Essayem, A. Holmqvist, G. Sapaly, J. C. Védrine and Y. Ben Taarit, Stud. Surf. Sci. Catal., 2001, 135, 340.
- W. Yang, J. Billy, Y. Ben Taarit, J. C. Vedrine and N. Essayem, Catal. Today, 2002, 73, 153 CrossRef CAS.
- N. Essayem, C. Lorentz, A. Tuel and Y. Ben Taarit, Catal. Commun., 2005, 6, 539 CrossRef CAS.
- A. Vimont, A. Travert, C. Binet, C. Pichon, P. Mialane, F. Sécheresse and J.-C. Lavalley, J. Catal., 2006, 241, 221 CrossRef CAS.
- (a) G. M. Sheldrick, SADABS, program for scaling and correction of area detector data, University of Göttingen, Germany, 1997 Search PubMed; (b) R. Blessing, Acta Crystallogr., Sect. A: Found. Crystallogr., 1995, 51, 33 CrossRef.
- (a) G. M. Sheldrick, Acta Crystallogr., Sect. A: Found. Crystallogr., 1990, 46, 467 CrossRef; (b) G. M. Sheldrick, SHELX-TL version 5.03, Software Package for the Crystal Structure Determination, Siemens Analytical X-ray Instrument Division: Madison, WI, 1994 Search PubMed.
- P. Mialane, A. Dolbecq, J. Marrot, E. Riviere and F. Sécheresse, Angew. Chem., Int. Ed., 2003, 42, 3523 CrossRef CAS.
- See for example: P. C. R. Soares-Santos, L. Cunha-Silva, F. L. Sousa, L. Mafra, J. Rocha, A. M. V. Cavaleiro, T. Trindade, F. A. Almeida Paz, J. Klinowski and H. I. S. Nogueira, J. Mol. Struct., 2008, 888, 99 Search PubMed.
- H. T. Evans and M. T. Pope, Inorg. Chem., 1984, 23, 501 CrossRef CAS.
- See for examples (a) J. Fuchs, A. Thiele and R. Palm, Angew. Chem., Int. Ed. Engl., 1982, 21, 789 CrossRef; (b) A. Dolbecq, E. Cadot, D. Eisner and F. Sécheresse, Inorg. Chem., 1999, 38, 4217 CrossRef CAS; (c) C.-Y. Sun, S.-X. Liu, D.-D. Liang, K.-Z. Shao, Y.-H. Ren and Z.-M. Su, J. Am. Chem. Soc., 2009, 131, 1883 CrossRef CAS.
- G. Gilli and P. Gilli, J. Mol. Struct., 2000, 512, 1 CrossRef.
- L. Corsin, B. J. Fax and R. C. Lord, J. Chem. Phys., 1953, 21, 1170 CAS.
- D. Cook, Can. J. Chem., 1961, 39, 2009 CAS.
- R. Foglizzo and A. Novak, J. Chim. Phys. Phys.-Chim. Biol., 1969, 66, 1939.
- V. P. Glazunov and S. E. Odinokov, Spectrochim. Acta, Part A, 1982, 38, 409 CrossRef.
- C. Paze, S. Bordiga, C. Lamberti, M. Salvalaggio, A. Zecchina and G. Bellussi, J. Phys. Chem. B, 1997, 101, 4740 CrossRef CAS.
- J. Wasicki, A. Pajzderska and Z. J. Fojud, J. Phys. Chem. C, 2008, 112, 7503 CrossRef CAS.
Footnote |
| † Electronic supplementary information (ESI) available: Powder thermodiffractograms of 2 and powder X-ray diffraction patterns of 1 showing its spontaneous transformation in2. CCDC reference numbers 776230 and 776231. For ESI and crystallographic data in CIF or other electronic format see DOI: 10.1039/c0cp00446d |
| This journal is © the Owner Societies 2011 |