Local defects enhanced dehydrogenation kinetics of the NaBH4-added Li–Mg–N–H system
Chu
Liang
,
Yongfeng
Liu
*,
Ying
Jiang
,
Zhijun
Wei
,
Mingxia
Gao
,
Hongge
Pan
and
Qidong
Wang
State Key Laboratory of Silicon Materials & Department of Materials Science and Engineering, Zhejiang University, Hangzhou 310027, People's Republic of China. E-mail: mselyf@zju.edu.cn; Fax: +86 571 87952615; Tel: +86 571 87952615
First published on 28th October 2010
Abstract
A mechanistic understanding on the enhanced kinetics of hydrogen storage in the NaBH4-added Mg(NH2)2-2LiH system is provided by carrying out experimental investigations associated with first-principles calculations. It is found that the operating temperatures for hydrogen desorption of the Mg(NH2)2-2LiH system are reduced by introducing NaBH4, and the NaBH4 species seems almost unchanged during dehydrogenation/hydrogenation process. First-principles calculations reveal that the presence of NaBH4 in the Mg(NH2)2-2LiH system facilitates the formation of Mg vacancies in Mg(NH2)2. The appearance of Mg vacancies not only weakens the N–H bonds but also promotes the diffusion of atoms and/or ions, consequently resulting in the improvement of the reaction kinetics of hydrogen desorption/absorption of the NaBH4-added Mg(NH2)2-2LiH system. This finding provides us with a deep insight into the role played by NaBH4 in the Li–Mg–N–H system, as well as ideas for designing high-performance catalysts for metal–N–H-based hydrogen storage media.
1. Introduction
The interest in hydrogen as an important energy vector of the future arises from its unique features of abundance, flexible convertibility from many energy sources and high environmental compatibility.1 A safe, efficient and economical storage technology is regarded as the crucial prerequisite before hydrogen can be globally accepted as a fuel, particularly for mobile applications.2 Storing hydrogen in solid-state materials is often preferred over pressurized hydrogen and liquefied hydrogen because of its high gravimetric and volumetric densities and good safety.3 The main focus of research on hydrogen storage materials is to find light weight, low cost and high capacity hydrides with favorable hydrogen absorption/desorption thermodynamics and kinetics.4–20 In recent years, special attention has been given to those materials which are composed of hydrogen bonding to low-Z elements such as alanates,7–10 borohydrides,11,12amides13–16 and their combinations.17–20 One category of the most promising candidates seems to be combinations of amides and hydrides due to their relatively high hydrogen content, good hydrogen storage reversibility and mild operating conditions.13–16In 2002, Chen et al. demonstrated that lithium nitride, Li3N could reversibly absorb/desorb 11.5 wt% hydrogen and convert finally to a LiNH2-2LiH combination via the following two-step reaction.13
| Li3N + 2H2 ⇌ Li2NH + LiH + H2 ⇌ LiNH2 + 2LiH | (1) |
Recently, a three-dimensional diffusion-controlled kinetic mechanism was identified for the dehydrogenation process of the Li–Mg–N–H system.25 We therefore believe that enhancement in the atomic or ionic diffusivity could be very effective for the improvement of the hydrogen desorption/absorption kinetics. It is well known that crystal defects play an important role in chemical reactions since their presence greatly expedites diffusion and mass transport in materials.26 Since the compounds comprised of elemental Na (from compounds such as NaH and NaNH2) or the BH4−group (for example from LiBH4) have been shown to enhance the dehydrogenation kinetics of the Mg(NH2)2-2LiH system as described above,22,24 an improved hydrogen storage performance is expected by directly introducing NaBH4 into the system. In the present study, we have concentrated on investigating the effects of NaBH4 on the dehydrogenation/hydrogenation properties of the Mg(NH2)2-2LiH system and the corresponding mechanisms by carrying out experimental examinations associated with theoretical calculations.
2. Experimental and computational
The starting chemicals, lithium hydride (LiH, purity 98%) and sodium borohydride (NaBH4, purity 98.5%) were purchased from Alfa Aesar and Sigma Aldrich respectively, and were used as received without any further purification. Magnesium amide (Mg(NH2)2) was produced in-house by reacting Mg powder (99%, Sinopharm) with ammonia at 300 °C under 7 bar ammonia pressure. Samples of Mg(NH2)2-2LiH-xNaBH4 (x = 0, 0.05, 0.1, 0.2 and 0.5) mixtures were prepared by ball milling the corresponding chemicals under 78 bar of hydrogen pressure on a planetary ball mill (QM-3SP4, Nanjing) rotating at 500 rpm for 36 h. The ball-to-sample weight ratio is about 60![[thin space (1/6-em)]](https://www.rsc.org/images/entities/char_2009.gif) :
:![[thin space (1/6-em)]](https://www.rsc.org/images/entities/char_2009.gif) 1.
1.
Temperature dependence of hydrogen desorption behaviors of the samples was measured on a homemade temperature-programmed-desorption (TPD) system attached to an online gas chromatograph. A 50 mg sample was loaded into the tube reactor of the measurement system and then housed in a tubing furnace. Pure argon was used as the carrier gas. The temperature was raised gradually from room temperature to 270 °C at the heating rate of 2 °C min−1. The quantitative measurements of hydrogen release/uptake were performed on a homemade volumetric Sieverts-type apparatus. A 200 mg sample was used in each test. Both isothermal and non-isothermal approaches were adopted. In the non-isothermal experiment, the temperature of the samples was gradually raised to 275 °C at the rate of 2 °C min−1 for desorption and to 150 °C at the rate of 1 °C min−1 for absorption. For isothermal dehydrogenation/hydrogenation kinetics, the samples were quickly heated to a preset temperature and kept at this temperature for the whole period of measurement.
Crystal structures of samples were determined by using an X'Pert Pro diffractometer with CuKα radiation at 40 kV and 40 mA. Data were collected in the 2θ range of 10–90° with 0.05° step increments. A homemade container was used to keep the powder samples from air and moisture contamination. N–H and B–H vibrations in all samples were identified by a Bruker Vector 22 Fourier transform infrared spectrometer (FTIR, Germany). Each pellet sample was prepared by cold pressing a mixture of powdered samples and potassium bromide (KBr) at the weight ratio of about 1![[thin space (1/6-em)]](https://www.rsc.org/images/entities/char_2009.gif) :
:![[thin space (1/6-em)]](https://www.rsc.org/images/entities/char_2009.gif) 30. The transmission mode was adopted with 4 cm−1 scan resolution. 32 scans were made and accumulated. 11B and 23Na solid-state NMR spectra were recorded on a Bruker Avance II 300 MHz spectrometer operating at 96.3 MHz. Samples were packed in 7 mm MAS ZrO2 rotors with a Kel-F cap in the glove box. All spectra were obtained after 1024 scans with an acquisition time of 38 ms per scan and a repetition delay time of 1 s. Chemical shifts (δ) were referenced to a 1 M aqueous solution of BF3·OEt2 and sodium chloride.
30. The transmission mode was adopted with 4 cm−1 scan resolution. 32 scans were made and accumulated. 11B and 23Na solid-state NMR spectra were recorded on a Bruker Avance II 300 MHz spectrometer operating at 96.3 MHz. Samples were packed in 7 mm MAS ZrO2 rotors with a Kel-F cap in the glove box. All spectra were obtained after 1024 scans with an acquisition time of 38 ms per scan and a repetition delay time of 1 s. Chemical shifts (δ) were referenced to a 1 M aqueous solution of BF3·OEt2 and sodium chloride.
All calculations present in this work were performed with the CASTEP code27 based on density functional theory (DFT).28 The ion-electron interactions were described by using ultrasoft pseudopotentials,29 and the Perdew-Wang 1991 (PW91) generalized gradient approximation (GGA)30 was employed for the exchange–correlation functional. Electronic wave functions were expanded on the basis of plane waves with a well-converged cutoff energy of 340 eV. The Brillouin zone was sampled by a sum over special k-points generated with Monkhorst–Pack scheme,31 and set as 3 × 3 × 3 for Mg(NH2)2, 2 × 2 × 4 for NaBH4, 13 × 13 × 7 for Mg, 3 × 3 × 3 for B, and Gamma-point (1 × 1 × 1) for H2 and NH3 molecules. To simulate the defects in a cell, the primitive cell of Mg(NH2)2 consisting of 112 atoms and a 2 × 2 × 1 supercell of NaBH4 consisting of 96 atoms were adopted, and the calculations for the energies of the H2 molecule and the NH3 molecule were conducted on a cell of 10 × 10 × 10 Å. A finite basis set correction32 was applied in the evaluation of energy and stress, and the Pulay density-mixing scheme33 was adopted for self-consistent field (SCF) calculations. Optimization of atomic positions and lattice parameters was performed on alternate cycles using the BFGS method34 until the convergence criteria were met (maximum energy change per atom = 1.0 × 10⁻⁵ eV, maximum RMS force = 0.03 eV Å−1, maximum RMS stress = 0.05 GPa and maximum RMS displacement = 1.0 × 10⁻³ Å). For the perfect crystal, all atomic positions and lattice parameters were relaxed. During the calculations for the system energy of a supercell with a point defect, the supercell dimensions were kept at the optimized lattice parameters of the perfect crystal and all atoms within the cell were allowed to relax with a SCF tolerance of 1.0 × 10⁻⁶ eV atom−1. This method has been extensively used in the study of NaAlH4.35 For charged defects, a jellium background was employed to neutralize the supercells.
3. Results and discussion
3.1 Structural characterization and hydrogen storage properties
Fig. 1a shows XRD patterns of the Mg(NH2)2-2LiH-xNaBH4 samples milled for 36 h. Obviously, in addition to LiH phase, the post-milled samples all exhibit some broad diffraction peaks centered around 14.6° and 29.1° (2θ), which originate from the nano-crystalline/amorphous Mg(NH2)2 as reported extensively before.36 It is worth noting that the peak around 29.1° becomes sharper for the NaBH4-added sample with respect to the pure sample due to the fact that the strongest diffraction peak of NaBH4 is at about 28.9°. In particular, the NaBH4 phase can be unambiguously identified from the peaks at 24.7°, 28.9°, 41.4°, 48.9°, 51.4°, 59.8°, and 67.9° for the samples with x = 0.5. Further FTIR examinations show that the signature N–H vibration of Mg(NH2)2 at 3272/3326 cm−1 is observed in all the samples (Fig. 1b), indicating the existence of Mg(NH2)2 in the post-milled samples. In the meantime, three absorbances at 2387, 2297 and 2227 cm−1 are also discernable for the NaBH4-added samples, and they become clearer with increasing the content of NaBH4, which locate in the typical B–H vibration range of borohydride. According to the XRD analyses, they should belong to NaBH4. Thus, we believe that the as-milled samples are still composed of the starting chemicals, Mg(NH2)2, LiH and NaBH4, without the formation of new phase.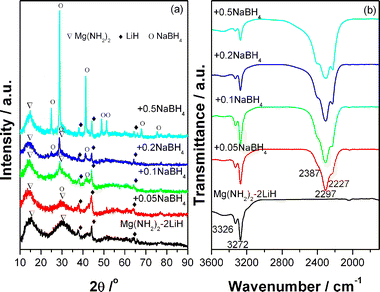 | ||
| Fig. 1 XRD patterns of the Mg(NH2)2-2LiH-xNaBH4 samples milled for 36 h. | ||
The influence of the addition of NaBH4 on hydrogen desorption behaviors of the Mg(NH2)2-2LiH system was qualitatively evaluated by means of TPD. Fig. 2a shows the TPD curves of the post-milled Mg(NH2)2-2LiH-xNaBH4 samples. Apparently, the addition of NaBH4 lowers down the hydrogen desorption temperatures of the Mg(NH2)2-2LiH system. The sample with x = 0.1 generates the lowest operating temperature for hydrogen desorption in the present work with the starting temperature decreased to ca. 130 °C and the peak temperature to ca. 184 °C. In comparison with the pristine sample, a reduction of around 12 °C for the peak temperature of hydrogen release was attained. However, the introduction of NaBH4 into the Mg(NH2)2-2LiH system decreased the hydrogen desorption amount as represented by the reduction of the peak areas. The volumetric desorption measurements gave the quantitative values as shown in Fig. 2b. It can be seen that the decrease in the amount of hydrogen desorption is dependent on the concentration of NaBH4. The hydrogen desorbed from the pure Mg(NH2)2-2LiH sample amounts to 5.46 wt%, while it is only 4.28 wt% for the Mg(NH2)2-2LiH-0.5NaBH4 sample, both of which are very close to the theoretical hydrogen capacities of 5.56 wt% and 4.40 wt%, respectively, with the supposition that NaBH4 remains unchanged in the dehydrogenation process.
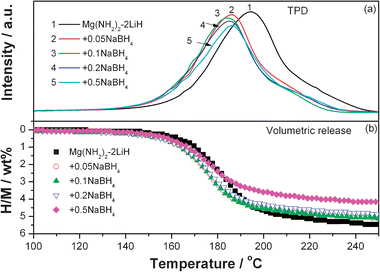 | ||
| Fig. 2 TPD (a) and volumetric release (b) curves of the Mg(NH2)2-2LiH-xNaBH4 samples. | ||
The enhancement in the dehydrogenation kinetics induced by the addition of NaBH4 was further characterized by isothermal hydrogen desorption examinations. Fig. 3a shows the isothermal dehydrogenation curves of the samples with and without NaBH4 at 150 °C. It can be seen that faster desorption kinetics were achieved with the addition of NaBH4, and the sample with x = 0.1 shows optimal dehydrogenation kinetics. Approximately 3.75 wt% of hydrogen is released from the Mg(NH2)2-2LiH-0.1NaBH4 sample within 100 min at 150 °C, whereas the amount of hydrogen desorption is only ∼2.55 wt% for the pure sample under the same conditions, corresponding to 73% and 46% of hydrogen storage capacities, respectively. Analyzing the tangent slope of the linear parts of dehydrogenation curves, a ∼0.06 wt% min−1 average rate was determined for the hydrogen desorption of the Mg(NH2)2-2LiH-0.1NaBH4 sample, while it is only ∼0.02 wt% min−1 for the pure sample. Specifically, the rate of hydrogen desorption for the Mg(NH2)2-2LiH-0.1NaBH4 sample is about 3 times that of the pure sample. Taking into account the hydrogen storage capacity and the dehydrogenation rate, x = 0.1 is deemed the optimal concentration in the present study. As a consequence, the following hydrogenation examinations and the reaction mechanism analyses were focused on the Mg(NH2)2-2LiH-0.1NaBH4 sample.
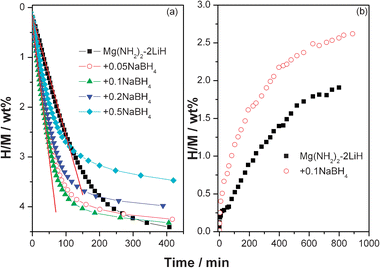 | ||
| Fig. 3 Isothermal hydrogen desorption (a) and absorption (b) curves of the Mg(NH2)2-2LiH-xNaBH4 samples. | ||
Fig. 3b shows the isothermal hydrogenation curves of the dehydrogenated Mg(NH2)2-2LiH and Mg(NH2)2-2LiH-0.1NaBH4 samples. At the hydrogen pressure of 105 bar and 100 °C, the dehydrogenated Mg(NH2)2-2LiH-0.1NaBH4 sample exhibits a slightly faster hydrogenation rate over the pure sample, as it takes up ∼3.1 wt% hydrogen within 1000 min while only ∼2.6 wt% hydrogen is recharged into the pure sample in the same period of time. This indicates that the addition of NaBH4 slightly improves the hydrogenation kinetics of the Mg(NH2)2-2LiH system as well.
Significantly, the dehydrogenation/hydrogenation kinetics of the Mg(NH2)2-2LiH system was enhanced with the presence of NaBH4. To understand the role played by NaBH4, the structural change of the Mg(NH2)2-2LiH-0.1NaBH4 sample at different dehydrogenation stages is investigated by means of XRD and FTIR. The results are shown in Fig. 4. It is found that from Fig. 4a, in addition to LiH and NaBH4, a new set of diffraction peaks assignable to the cubic Li2MgN2H2 phase emerges at 18.4°, 30.7°, 42.6°, 51.1° and 60.7° with noticeable intensities in the XRD pattern of the dehydrogenated sample stopped at 180 °C.15,22,25 As dehydrogenation stopped at 250 °C, the Li2MgN2H2 phase dominates with the disappearance of the LiH phase. Moreover, it is worthy to note that NaBH4 can be still identified in XRD profiles from the peaks at 25.1, 28.9, 41.4 and 48.9° in the dehydrogenation process although their intensities are weak. The change in the structure during dehydrogenation is further investigated by FTIR examinations as shown in Fig. 4b. It can be seen that for the dehydrogenation sample stopped at 180 °C, the peak intensity of N–H vibration of Mg(NH2)2 at 3272/3326 cm−1 clearly decreases, and a new absorbance emerges at around 3174 cm−1, which agrees well with the N–H vibration of cubic Li2MgN2H2.22,25 This indicates that Mg(NH2)2 was gradually consumed and a new imide product of Li2MgN2H2 developed with the release of hydrogen. As the sample is heated up to 250 °C, only the absorbance at 3174 cm−1 is detected for the N–H vibration while the absorbances of amide disappears completely. Interestingly enough, unlike LiBH4,24 the ternate B–H vibration of the BH4− anion in NaBH4 remains almost unchanged relative to the post-36 h milled sample, which is in good agreement with XRD results. This implies that NaBH4 still exists before and after dehydrogenation. However, it was found that two sharp absorbances at 3243 and 3301 cm−1 emerged in the dehydrogenated Mg(NH2)2-2LiH-xLiBH4 samples, which can be assigned to a new solid solution (LiNH2)x(LiBH4)1−x due to the formation of LiNH2 upon dehydrogenation from the Mg(NH2)2-2LiH combination.24 These facts imply that the different roles may be played by NaBH4 and LiBH4 in dehydrogenation process of the Mg(NH2)2-2LiH system.
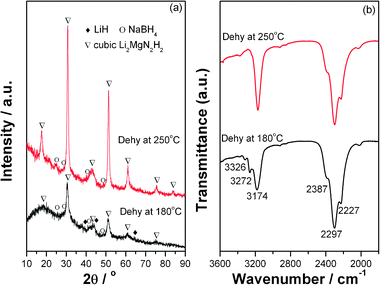 | ||
| Fig. 4 XRD patterns (a) and FTIR spectra (b) of the Mg(NH2)2-2LiH-0.1NaBH4 samples at different dehydrogenation stages. | ||
To obtain the detailed structural information of NaBH4, solid-state NMR was conducted to characterize the chemical shift of B and Na elements in the dehydrogenation process. Fig. 5 shows the solid-state 11B and 23Na NMR spectra of the Mg(NH2)2-2LiH-0.1NaBH4 sample before and after dehydrogenation. 11B and 23Na NMR spectra of NaBH4 were also recorded as references. It is seen that the solid-state 11B and 23Na NMR spectra of NaBH4 exhibit a symmetric single peak at −39.2 ppm and −8.2 ppm, respectively. In the case of Mg(NH2)2-2LiH-0.1NaBH4, the resonance of 11B is identical to that of the pure NaBH4, viz., a symmetric transition at −39.2 ppm, which persists in the dehydrogenation process, implying that the chemical environment of B atom remains almost unchanged. It can be therefore concluded that the BH4 ions maintain their integrity during dehydrogenation of the Mg(NH2)2-2LiH-0.1NaBH4 sample. However, the resonance of 11B in the Mg(NH2)2-2LiH-0.1LiBH4 sample was shifted from −41 ppm to about −39 ppm after dehydrogenation, indicating a lower electron cloud density around B atom due to the formation of a new solid solution (LiNH2)x(LiBH4)1−x.24 The 23Na NMR spectrum of the post-milled Mg(NH2)2-2LiH-0.1NaBH4 sample becomes broader and more asymmetric while the chemical shift seems almost unchanged as compared to that in the pure NaBH4, indicating that the average local environment around Na nuclei is only slightly changed, viz., more disordered as reported previously.37 This is possibly due to the crystal imperfection caused by the increase in defects during ball milling. In general, atoms on the surface experience surface relaxation and/or reconstruction compared with atoms in the bulk. As a consequence, the increase in number of atoms on the surface would result in less-ordered state.38
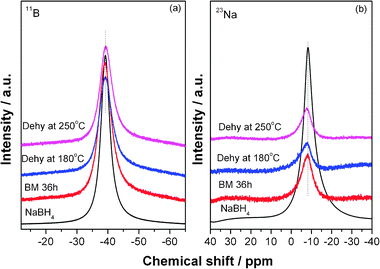 | ||
| Fig. 5 Solid state 11B (a) and 23Na (b) NMR spectra of NaBH4 and the Mg(NH2)2-2LiH-0.1NaBH4 samples at different dehydrogenation stages. | ||
The dehydrogenated Mg(NH2)2-2LiH-0.1NaBH4 sample was re-hydrogenated under 105 bar of hydrogen pressure. As shown in Fig. 6, it is seen that as the temperature was gradually elevated from room temperature to 150 °C, appropriately 5.0 wt% of hydrogen is recharged. The re-hydrogenated sample was then subjected to XRD and FTIR examinations (Fig. 7). Apparently, the re-hydrogenated sample consists of three species, viz., Mg(NH2)2, LiH and NaBH4. The result indicates that the dehydrogenated product goes back to the starting reactants with complete hydrogen absorption.
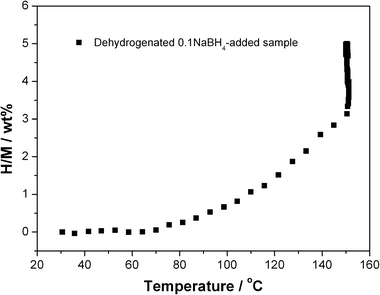 | ||
| Fig. 6 Hydrogenation curve of the dehydrogenated Mg(NH2)2-2LiH-0.1NaBH4 sample with temperatures. | ||
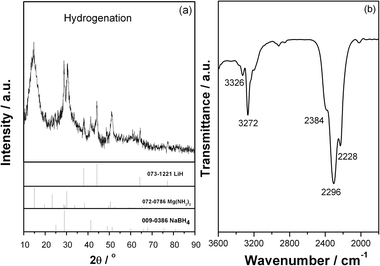 | ||
| Fig. 7 XRD pattern (a) and FTIR spectrum (b) of the Mg(NH2)2-2LiH-0.1NaBH4 sample after re-hydrogenation. | ||
The data obtained from volumetric measurements, XRD, FTIR and NMR analyses make us believe that hydrogen storage in the Mg(NH2)2-2LiH-xNaBH4 system in the temperature range of 20–250 °C originates mainly from the reaction between Mg(NH2)2 and LiH. The dehydrogenation/hydrogenation processes can be still described by the following reversible reaction.
| Mg(NH2)2 + 2LiH ⇌ Li2MgN2H2 + 2H2 | (2) |
To quantitatively evaluate the effect of the addition of NaBH4 on the kinetic barrier, the apparent activation energy of dehydrogenation reaction of the Mg(NH2)2-2LiH-0.1NaBH4 sample was calculated with the Kissinger method.39Fig. 8 shows the Kissinger plots of the Mg(NH2)2-2LiH and Mg(NH2)2-2LiH-0.1NaBH4 samples. The apparent activation energy Ea is determined to be about 109.8 kJ mol−1 for the pure sample, which is in good agreement with the previous reports.15 For the Mg(NH2)2-2LiH-0.1NaBH4 sample, the Ea value is decreased to 99.0 kJ mol−1, a ∼10% reduction with respect to the pure sample. This result reveals that the presence of NaBH4 alleviates the kinetic barrier of dehydrogenation reaction of the Li–Mg–N–H, which is responsible for the reduced operating temperature for hydrogen desorption.
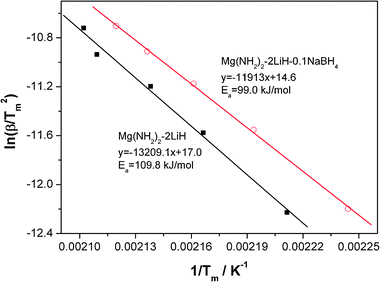 | ||
| Fig. 8 Kissinger's plots of the Mg(NH2)2-2LiH and Mg(NH2)2-2LiH-0.1NaBH4 samples. | ||
As described above, an improved dehydrogenation performance was achieved by the addition of an appropriate amount of NaBH4 yet with the NaBH4 additive remaining unchanged before and after dehydrogenation. We believe therefore that the NaBH4 additive should work as a catalyst in the dehydrogenation process of the Li–Mg–N–H system instead of a reactant. For understanding the catalytic mechanisms of NaBH4, high-resolution XRD technique was employed to identify the exact structural changes in the dehydrogenation process. Fig. 9 shows three strongest reflections of the Mg(NH2)2 phase in the high-resolution XRD patterns of the re-hydrogenated Mg(NH2)2-2LiH and Mg(NH2)2-2LiH-0.1NaBH4 samples at 200 °C. It is found that all of the three strongest reflections of the Mg(NH2)2 phase in the Mg(NH2)2-2LiH-0.1NaBH4 sample slightly shift to higher angles with respect to the pure Mg(NH2)2-2LiH sample, indicating the subtle decrease in the lattice parameter. This phenomenon is likely to originate from the appearance of Mg vacancies and/or the substitution of Mg by smaller atoms or ions in the Mg(NH2)2 cell.
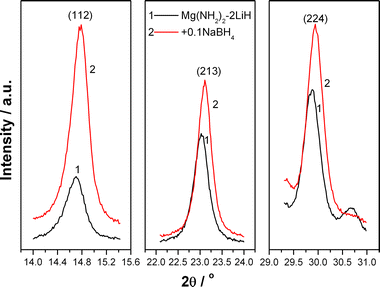 | ||
| Fig. 9 Three strongest reflections of Mg(NH2)2 in the re-hydrogenated Mg(NH2)2-2LiH and Mg(NH2)2-2LiH-0.1NaBH4 samples. | ||
3.2 First-principles calculations
It is well known that the hydrogen storage process of the metal–N–H system always associates with the dissociation/reconstruction of the N–H bonds.22–24 Therefore, the N–H bond strength of the amides/imides, which is affected by the presence of point defects including vacancies, interstitials, and substitutional impurities, plays a crucial role during hydrogen release/uptake. First-principles calculation is a powerful tool for understanding and predicting the structures and properties of materials, such as the properties of crystals and surfaces, band structures, optical properties, point defects, extended defects, and so on, through calculating their electronic structures.40 It is therefore highly desirable to perform a first-principles calculation on the structures and bonding of Mg(NH2)2 and NaBH4 to obtain some insights on the mechanism of formation of defects.Mulliken population41 analyses on Mg(NH2)2 shows that the Mulliken effective charges (MEC) of Mg, N and H are +1.62e, −1.31e and +0.25e, respectively. In addition, the average bond overlap populations (BOP) of N–H, Mg–N and H–H bonds are calculated to be 0.75e, −0.90e and −0.15e, respectively. With the above information, we know that the bonding between N–H is strongly covalent and that between Mg–N is primarily ionic. For evaluating the covalent bond strength and understanding the stability of N–H bonds in Mg(NH2)2, the calculated bond length (BL) and BOP of N–H bonds for Mg(NH2)2 with defects free and various defects are listed in Table 1. Vacancies or substitutional atoms/ions were created by removing or replacing atoms/ions from supercells while holding the cell volume and shape fixed. This method is appropriate for materials with low defect densities.42 As shown in Table 1, the average BL of N–H in Mg(NH2)2 remains almost unchanged with the presence of various defects including the Mg vacancies and the substitution of Mg with Na. The average BOP of the N–H bond in Mg(NH2)2 are decreased from 0.755e to 0.747/0.736/0.722e for the Mg/Mg+/Mg2+ vacancies while it is almost unchanged for the substitution of Mg with Na. More interestingly, the minimum value of BOP of the N–H bond are decreased from 0.75e to 0.64e with the appearance of Mg vacancies, forming the bigger reduction as compared with 0.73e for the substitution of Na for Mg. As a result, we believe that the presence of Mg/Mg+/Mg2+ vacancies in Mg(NH2)2 plays the dominant role in weakening the N–H bond rather than the substitution of Na/Na+ for Mg.
| Defects | Minimum values | Average values | ||
|---|---|---|---|---|
| BOP/e | BL/Å | BOP/e | BL/Å | |
| Defect-free | 0.75 | 1.034 | 0.755 | 1.035 |
| Mg vacancy | 0.64 | 1.058 | 0.747 | 1.036 |
| Mg+ vacancy | 0.64 | 1.058 | 0.736 | 1.036 |
| Mg2+ vacancy | 0.64 | 1.058 | 0.723 | 1.037 |
| Na @ Mg site | 0.73 | 1.033 | 0.754 | 1.036 |
| Na+ @ Mg+ site | 0.73 | 1.033 | 0.756 | 1.034 |
| Na+ @ Mg2+ site | 0.73 | 1.033 | 0.755 | 1.035 |
Vacancy formation energy is an important parameter for understanding the formation of vacancy in a crystal.43 It is generally defined as the energy that creates a vacancy in a crystal. Further calculations were performed on the formation energies of the relevant point defects in NaBH4 and Mg(NH2)2 in charged state according to eqn (3):44
 | (3) |
| μNa = μNaBH4 −μB − 2μH2 | (4) |
| μMg = μMg(NH2)2 − 2μNH3 − μH2 | (5) |
| Vacancy (Xq) | Mg(NH2)2 | NaBH4 | |||||||
|---|---|---|---|---|---|---|---|---|---|
| Mg0 | Mg+ | Mg2+ | Na0 | Na+ | B0 | B3+ | BH40 | BH4+ | |
| ΔE(Xq) (eV) | 1.92 | 3.51 | 5.44 | 2.46 | −0.98 | 3.55 | 5.03 | 3.29 | 1.97 |
It is clear that the formation of a Mg vacancy in Mg(NH2)2 and Na+ vacancy in NaBH4 is more energetically favorable in the present study, which is possibly caused by the energetic ball-milling treatment. Subsequently, the possibility of Mg moving into Na+ vacancy or BH4− vacancy in NaBH4 was estimated from the defect formation energies as listed in Table 3. The lowest defect formation energy is attained for the replacement of Mg2+ for Na+ (1.06 eV), which indicates that the migration of Mg2+ cation into the Na+ vacancies in NaBH4 supercell is most likely to occur in the NaBH4-doped Mg(NH2)2-2LiH system because of the close contact of the species at the molecular level caused by energetic milling. To further elucidate the stability of a Mg atom or cation in the matrix of NaBH4, the overall binding energy (Ebinding(X)) of the Mg atom or cation with the surrounding atoms was calculated according to the following equation:45
 | (6) |
| Defects (Xq) | NaBH4 supercell | |||||
|---|---|---|---|---|---|---|
| Mg@Na+ | Mg + @Na+ | Mg2+ @Na+ | Mg@BH4− | Mg + @BH4− | Mg2+ @BH4− | |
| ΔE(Xq) (eV) | 4.05 | 2.48 | 1.06 | 5.45 | 6.64 | 7.77 |
| E binding(Mg) (eV) | 2.96 | −0.51 | −3.83 | 1.43 | 0.72 | −0.07 |
According to the above calculations, it can be seen that the formation energy for Mg vacancies in Mg(NH2)2 and Na+ vacancies in NaBH4 is relatively low. So it is easy to create a Mg vacancy in Mg(NH2)2 and a Na+ vacancy in NaBH4. The dispelled Mg may convert to a Mg2+ cation via charge transfer on the surface of Mg(NH2)2. Then, the substitution of Mg2+ for Na+ in NaBH4 is energetically favorable. Moreover, the overall binding energy of Mg2+ with its surrounding atoms in the NaBH4 supercell is the lowest in the present study, which implies that Mg2+ can stably stay at the Na+ position in NaBH4. As a result, it increases Mg vacancies in Mg(NH2)2, and is responsible for the shrinkage in the lattice parameters of Mg(NH2)2 in the re-hydrogenation process as observed in Fig. 9. The increase of Mg vacancies not only weakens the N–H bonds but also promotes the diffusion of atoms and/or ions, consequently resulting in an improvement in the reaction kinetics of hydrogen desorption/absorption of the NaBH4-added Mg(NH2)2-2LiH system.
4. Conclusions
The hydrogen storage properties of the NaBH4-added Mg(NH2)2-2LiH system and the catalytic mechanisms of NaBH4 on the system were systematically investigated by experimental examinations and first-principles calculations. It was found that the dehydrogenation kinetics of the Mg(NH2)2-2LiH system was improved by introducing NaBH4 with a 12 °C reduction in the peak temperature of dehydrogenation of the Mg(NH2)2-2LiH-0.1NaBH4 sample. Structural analyses showed that in the whole dehydrogenation process, Mg(NH2)2 reacted with LiH to convert to Li2MgN2H2 while NaBH4 remains almost unchanged. First-principles calculations exhibited a low formation energy for Mg vacancies in Mg(NH2)2 and a favorable overall binding energy of Mg2+ with its surrounding atoms in the NaBH4 supercell, which facilitate the formation of Mg vacancies in the NaBH4-doped Mg(NH2)2-2LiH system. The presence of Mg vacancies enhances the reaction kinetics of hydrogen desorption/absorption of the NaBH4-added Mg(NH2)2-2LiH system. So the adoption of a manufacturing process which increases the crystal defects and the introduction into the system the species which weakens the N–H bonds are both effective approaches for further improving the hydrogen release/uptake kinetics of the amides/hydrides combined system used for hydrogen storage.Acknowledgements
The authors would like to acknowledge the financial support from National Natural Science Foundation of China (Grant Nos.: 51025102, 50701040 and 50871100), from the Ministry of Science and Technology of China (Grant Nos.: 2009AA05Z106 and 2010CB631304) and from Zhejiang Innovation Program for Graduates (Grant No.: YK2009003).References
- J. A. Turner, Science, 1999, 285, 687 CrossRef CAS.
- L. Schlapbach and A. Züttel, Nature, 2001, 414, 353 CrossRef.
- M. Felderhoff, C. Weidenthaler, R. von Helmot and U. Eberle, Phys. Chem. Chem. Phys., 2007, 9, 2643 RSC.
- J. Graetz, Chem. Soc. Rev., 2009, 38, 73 RSC.
- P. Chen and M. Zhu, Mater. Today, 2008, 11, 36 CrossRef CAS.
- D. H. Gregory, J. Mater. Chem., 2008, 18, 2321 RSC.
- S. Orimo, Y. Nakamori, J. R. Eliseo, A. Züttel and C. M. Jensen, Chem. Rev., 2007, 107, 4111 CrossRef CAS.
- O. Kircher and M. Fichtner, J. Alloys Compd., 2005, 404–406, 339 CrossRef CAS.
- S. Y. Zheng, F. Fang, G. Y. Zhou, G. Y. Chen, L. Z. Ouyang, M. Zhu and D. L. Sun, Chem. Mater., 2008, 20, 3954 CrossRef CAS.
- F. H. Wang, Y. F. Liu, M. X. Gao, K. Luo, H. G. Pan and Q. D. Wang, J. Phys. Chem. C, 2009, 113, 7978 CrossRef CAS.
- A. Züttel, A. Borgschulte and S. Orimo, Scr. Mater., 2007, 56, 823 CrossRef.
- M. Fichtner, Z. R. Zhao-Karger, J. J. Hu, A. Roth and P. Weidler, Nanotechnology, 2009, 20, 204029 CrossRef.
- P. Chen, Z. T. Xiong, J. Z. Luo, J. Y. Lin and K. L. Tan, Nature, 2002, 420, 302 CrossRef CAS.
- W. F. Luo, J. Alloys Compd., 2004, 381, 284 CrossRef CAS.
- Z. T. Xiong, G. T. Wu, J. J. Hu and P. Chen, Adv. Mater., 2004, 16, 1522 CrossRef CAS.
- Y. F. Liu, K. Zhong, M. X. Gao, J. H. Wang, H. G. Pan and Q. D. Wang, Chem. Mater., 2008, 20, 3521 CrossRef CAS.
- F. E. Pinkerton, G. P. Meisner, M. S. Meyer, M. P. Balogh and M. D. Kundrat, J. Phys. Chem. B, 2005, 109, 6 CrossRef CAS.
- Y. F. Liu, J. J. Hu, G. T. Wu, Z. T. Xiong and P. Chen, J. Phys. Chem. C, 2007, 111, 19161 CrossRef CAS.
- Y. F. Liu, K. Luo, Y. F. Zhou, M. X. Gao and H. G. Pan, J. Alloys Compd., 2009, 481, 473 CrossRef CAS.
- M. Gupta and R. P. Gupta, J. Alloys Compd., 2007, 446–447, 319 CrossRef CAS.
- Z. T. Xiong, J. J. Hu, G. T. Wu, P. Chen, W. F. Luo, K. Gross and J. Wang, J. Alloys Compd., 2005, 398, 235 CrossRef CAS.
- Y. F. Liu, J. J. Hu, Z. T. Xiong, G. T. Wu and P. Chen, J. Mater. Res., 2007, 22, 1339 CrossRef CAS.
- A. Sudik, J. Yang, D. Halliday and C. Wolverton, J. Phys. Chem. C, 2007, 111, 6568 CrossRef CAS.
- J. J. Hu, Y. F. Liu, G. T. Wu, Z. T. Xiong, Y. S. Chua and P. Chen, Chem. Mater., 2008, 20, 4398 CrossRef CAS.
- Y. F. Liu, K. Zhong, K. Luo, M. X. Gao, H. G. Pan and Q. D. Wang, J. Am. Chem. Soc., 2009, 131, 1862 CrossRef CAS.
- F. A. Kroger, The Chemistry of Imperfect Crystals, North-Holland, Amsterdam, 1964 Search PubMed.
- M. D. Segall, P. J. D. Lindan, M. J. Probert, C. J. Pickard, P. J. Hasnip, S. J. Clark and M. C. Payne, J. Phys.: Condens. Matter, 2002, 14, 2717 CrossRef CAS.
- P. Hohenberg and W. Kohn, Phys. Rev., 1964, 136, B864 CrossRef.
- D. Vanderbit, Phys. Rev. B: Condens. Matter, 1990, 41, 7892 CrossRef.
- J. P. Perdew and Y. Wang, Phys. Rev. B: Condens. Matter, 1992, 45, 13244 CrossRef.
- H. J. Monkhorst and J. D. Pack, Phys. Rev. B: Solid State, 1976, 13, 5188 CrossRef.
- G. P. Francis and M. C. Payne, J. Phys.: Condens. Matter, 1990, 2, 4395 CrossRef.
- G. Kresse and J. Furthmuller, Phys. Rev. B: Condens. Matter, 1996, 54, 11169 CrossRef CAS.
- W. H. Press, B. P. Flannery, S. A. Teukolsky and W. T. Vettering, Numerical Recipies, Cambridge University Press, Cambridge, 1986 Search PubMed.
- G. B. Wilson-Short, A. Janotti, K. Hoang, A. Peles and C. G. Van de Walle, Phys. Rev. B: Condens. Matter Mater. Phys., 2009, 80, 224102 CrossRef.
- J. J. Hu, G. T. Wu, Y. F. Liu, Z. T. Xiong, P. Chen, K. Murata, K. Sakata and G. Wolf, J. Phys. Chem. B, 2006, 110, 14688 CrossRef CAS.
- X. Y. Xue, S. M. Zhai and M. Kanzaki, Am. Mineral., 2009, 94, 1739 CrossRef CAS.
- C. Lu, J. Z. Hu, J. H. Kwak, Z. G. Yang, R. M. Ren, T. Markaitree and L. L. Shaw, J. Power Sources, 2007, 170, 419 CrossRef CAS.
- H. E. Kissinger, Anal. Chem., 1957, 29, 1702 CrossRef CAS.
- C. G. Van de Walle and J. Neugebauer, J. Appl. Phys., 2004, 95, 3851 CrossRef CAS.
- M. D. Segall, R. Shah, C. J. Pickard and M. C. Payne, Phys. Rev. B: Condens. Matter, 1996, 54, 16317 CrossRef.
- S. Q. Hao and D. S. Sholl, Phys. Chem. Chem. Phys., 2009, 11, 11106 RSC.
- M. A. Shandiz, J. Phys.: Condens. Matter, 2008, 20, 325237 CrossRef.
- C. G. Van de Walle and J. Neugebauer, J. Appl. Phys., 2004, 95, 3851 CrossRef CAS.
- Y. Song and Z. X. Guo, Phys. Rev. B: Condens. Matter Mater. Phys., 2006, 74, 195120 CrossRef.
| This journal is © the Owner Societies 2011 |
