Local structure investigation of oxide ion and proton defects in Ge-apatites by pair distribution function analysis†‡
Lorenzo
Malavasi
*a,
Alodia
Orera
b,
Peter R.
Slater
c,
Pooja M.
Panchmatia
d,
M. Saiful
Islam
d and
Joan
Siewenie
e
aDept. Physical Chemistry “M.Rolla”, INSTM and IENI-CNR, University of Pavia, Viale Taramelli 16, I-27100 Pavia, Italy. E-mail: Lorenzo.malavasi@unipv.it; Fax: +39 382-987575; Tel: +39 382-987921
bInstituto de Ciencia de Materiales de Aragón. Dpto. de Ciencia y Tecnología de Materiales y Fluidos Ed. Torres Quevedo c/María de Luna 3, 50018, Zaragoza, Spain
cSchool of Chemistry, University of Birmingham, Birmingham, B15 2TT, UK
dDept. of Chemistry, University of Bath, Bath, BA2 7AY, UK
eLos Alamos National Laboratory, LANSCE-12, MS H805, Los Alamos, NM, 87545, USA
First published on 22nd June 2010
Abstract
In this communication we provide a direct insight into the local structure and defects of oxygen excess Ge-apatites, in both dry and deuterated states, by means of pair distribution function analysis.
Apatite-type oxides are among the most fascinating of the new materials being studied as alternative solid oxide fuel cell (SOFC) electrolytes. The general formula for apatite oxides can be written M10(XO4)6O2±y, where M = rare-earth or alkaline-earth cation, X = P, Si or Ge, and y is the amount of oxygen non-stoichiometry. In particular, lanthanum silicate and germanate apatites have purely ionic (oxide ion) conductivities with values exceeding those of yttria stabilized ZrO21 at intermediate temperature. The structures of these materials can be described as comprising of isolated Si/GeO4 tetrahedra arranged so as to form distinct oxide ion and (Ln/A) cation channels running parallel to the c-axis (Fig. S1 of ESI†).
The highest conductivities in Si- and Ge-apatites have been found in samples with excess oxygen where oxygen interstitials play a key role in the conduction mechanism.2–4 As a consequence, the exact comprehension of migration processes in the apatites requires a good knowledge of the position of these oxygen defects in the structure and the local distortion induced by the defects. From an experimental point of view the available information are only based on average structure studies by means of neutron diffraction.5–11 While this can help in gaining a general picture of the (average) structural changes induced by oxygen defects, neutron diffraction does not allow a comprehensive and full description of the local structure, which is the essential piece of information required in this case. In addition, there is a rich literature where modelling studies at the atomic scale have been performed in oxygen excess Si- and Ge-apatites, identifying potential interstitial sites and accompanying local distortions.12–14
In this communication we present experimental data obtained on the oxygen excess Ge-apatite La9.67(GeO4)6O2.5 by means of neutron total scattering measurements coupled to pair distribution function (PDF) analysis. The power of the PDF analysis in obtaining information on the short range order in complex materials is now well established.15,16 In addition, its application to investigate the local order in ion-conducting materials has proved to be successful in unveiling new information on the short range order.17
The La9.67(GeO4)6O2.5 composition has been selected for several reasons. First of all oxygen excess Ge-apatites seem to have a greater potential for application with respect to analogous Si-apatites due to their higher conductivities at elevated temperatures; secondly together with oxide ion conductivity it has been observed that in water enriched La10−x(GeO4)6O3−1.5x systems an enhancement of conductivity occurs, which has been suggested as due to a mixed oxide-ion and proton conductivity;18 in addition, Orera and Slater found that the germanate-based apatites take up more water than the silicate analogues thus making the experimental observation of protonic defects more accessible.19 Finally, very recently a thorough atomistic modelling work investigated the oxygen interstitial sites and proton defects in the La9.67(GeO4)6O2.5apatite thus allowing a direct comparison between computer simulation and experimental results.20
Samples of La9.67(GeO4)6O2.5 were prepared by a sol–gel based method. GeO2 was dissolved in very hot water before the stoichiometric amount of La(NO3)3·6H2O was added to the solution. Both citric acid and ethylene glycol were added to the solution in 1![[thin space (1/6-em)]](https://www.rsc.org/images/entities/char_2009.gif) ∶
∶![[thin space (1/6-em)]](https://www.rsc.org/images/entities/char_2009.gif) 1 ratio. The solution was left under agitation and low heat overnight to form a transparent gel that was afterwards dried and calcined at 1100 °C for 12 h. One sample (hereinafter DRY) has been measured as prepared while a second sample (hereinafter WET) has been hydrated under hydrothermal conditions using D2O as explained in ref. 19. The amount of water per formula unit has been estimated to be ca. 0.55 from thermogravimetric analysis. Neutron powder diffraction (NPD) measurements at 15 K were carried out on the NPDF diffractometer at the Lujan Center at Los Alamos National Laboratory in a cylindrical vanadium tube. Data from an empty container were also collected to subtract the container scattering. The corrected total scattering structure function, S(Q), was obtained with the program PDFGETN.21 Finally, the PDF was obtained by Fourier transformation of S(Q). A Qmax = 35.0 Å−1 was used. Refinement of the experimental PDF data was carried out with the aid of PDFGUI and PDFFfit2 software.22
1 ratio. The solution was left under agitation and low heat overnight to form a transparent gel that was afterwards dried and calcined at 1100 °C for 12 h. One sample (hereinafter DRY) has been measured as prepared while a second sample (hereinafter WET) has been hydrated under hydrothermal conditions using D2O as explained in ref. 19. The amount of water per formula unit has been estimated to be ca. 0.55 from thermogravimetric analysis. Neutron powder diffraction (NPD) measurements at 15 K were carried out on the NPDF diffractometer at the Lujan Center at Los Alamos National Laboratory in a cylindrical vanadium tube. Data from an empty container were also collected to subtract the container scattering. The corrected total scattering structure function, S(Q), was obtained with the program PDFGETN.21 Finally, the PDF was obtained by Fourier transformation of S(Q). A Qmax = 35.0 Å−1 was used. Refinement of the experimental PDF data was carried out with the aid of PDFGUI and PDFFfit2 software.22
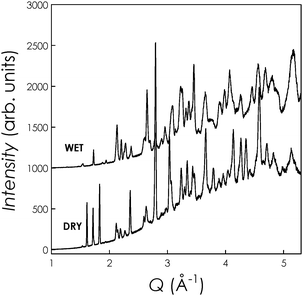
Fig. 1 shows the neutron diffraction data (first bank, 2θ = 40°) at 15 K collected on the two samples. Low-temperature data collection was used in order to increase the resolution of the data. The DRY sample data have been refined (Rietveld method) according to a triclinic crystal structure model (space group P![[1 with combining macron]](https://www.rsc.org/images/entities/char_0031_0304.gif) ) giving final lattice parameters of a = 9.8934(4) Å, b = 9.8518(3) Å, c = 7.2776(2) Å, α = 89.478(3)°, β = 89.530(9)° and γ = 119.779(2)°. The deuterated sample shows a symmetry increase and could be nicely refined according to a hexagonal model (space groupP63/m) giving final lattice parameters of a = b = 9.9787(2) Å, and c = 7.2744(2) Å. These results regarding the average structure are in agreement with published data.7
) giving final lattice parameters of a = 9.8934(4) Å, b = 9.8518(3) Å, c = 7.2776(2) Å, α = 89.478(3)°, β = 89.530(9)° and γ = 119.779(2)°. The deuterated sample shows a symmetry increase and could be nicely refined according to a hexagonal model (space groupP63/m) giving final lattice parameters of a = b = 9.9787(2) Å, and c = 7.2744(2) Å. These results regarding the average structure are in agreement with published data.7
 | ||
| Fig. 1 NPD data for DRY and WET La9.67(GeO4)6O2.5 samples. | ||
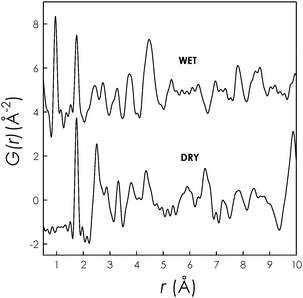
From the neutron total scattering measurements the PDF was extracted. Fig. 2 shows the experimental PDFs for the DRY and WET La9.67(GeO4)6O2.5 samples.
 | ||
| Fig. 2 Experimental PDF data for DRY and WET La9.67(GeO4)6O2.5. | ||
As can be appreciated the difference in the average structure between the two samples is also evident on the local scale. One striking difference between the DRY and WET samples is visible within the 2 Å range. Both data sets present an intense peak around 1.9 Å which is due to Ge–O pairs but the PDF of the WET sample has also a very intense peak around 1 Å which is absent in the DRY sample. PDFs of both samples have been simulated using as starting structural data those determined from the Rietveld refinement.
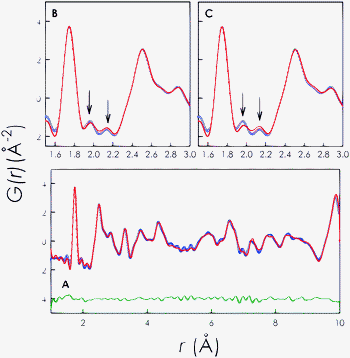
Fig. 3 (panel A) shows the result of the PDF fit for the DRY sample up to 10 Å in the P![[1 with combining macron]](https://www.rsc.org/images/entities/char_0031_0304.gif) space group. This model considers the oxygen excess as located within the Ge–O framework rather than at the channel centre. The goodness of refinement is Rw = 9.8%. Panel B and C shows a limited region of the PDF comparing the model with oxygen interstitials within the structure framework (panel B) and in the O4 channels (panel C) for the same oxygen content according to the sample formula.
space group. This model considers the oxygen excess as located within the Ge–O framework rather than at the channel centre. The goodness of refinement is Rw = 9.8%. Panel B and C shows a limited region of the PDF comparing the model with oxygen interstitials within the structure framework (panel B) and in the O4 channels (panel C) for the same oxygen content according to the sample formula.
 | ||
Fig. 3 Panel A: PDF fit of DRY La9.67(GeO4)6O2.5 in the P![[1 with combining macron]](https://www.rsc.org/images/entities/char_0031_0304.gif) space group up to 10 Å. Blue circles: experimental data; red line: calculated PDF; and horizontal green line: residual. Panel B: selected PDF region for the fit of DRY La9.67(GeO4)6O2.5 considering oxygen excess in the Ge–O framework. Panel C: selected PDF region for the fit of DRY La9.67(GeO4)6O2.5 considering oxygen excess in the structure channels along the c-axis. space group up to 10 Å. Blue circles: experimental data; red line: calculated PDF; and horizontal green line: residual. Panel B: selected PDF region for the fit of DRY La9.67(GeO4)6O2.5 considering oxygen excess in the Ge–O framework. Panel C: selected PDF region for the fit of DRY La9.67(GeO4)6O2.5 considering oxygen excess in the structure channels along the c-axis. | ||
The two peaks highlighted with arrows mark the most prominent and clear effects which result in the PDF by placing the excess oxygen in the two different positions. This result clearly confirms that the oxygen interstitials are located with the Ge–O framework at the channel periphery in La9.67(GeO4)6O2.5 in agreement with theoretical predictions.14,20 We also remark that the refinement of oxygen occupancy for panel A data leads to a final stoichiometry of 0.22(1) for the interstitial sites which is in good agreement with the expected value of 0.25. The final refined position for the interstitial oxygen was x = 0.051(7), y = 0.515(9) and z = 0.627(9).
The refinement of the WET sample was first attempted within the hexagonal space group. However, this starting structure did not allow us to properly describe the experimental results leading to very poor agreement factors. This arises from the significant local lattice distortion induced by water incorporation which cannot be described in the hexagonal space group. As a consequence, the fitting of the PDF for the WET La9.67(GeO4)6O2.5 was conducted in the P![[1 with combining macron]](https://www.rsc.org/images/entities/char_0031_0304.gif) space group.
space group.
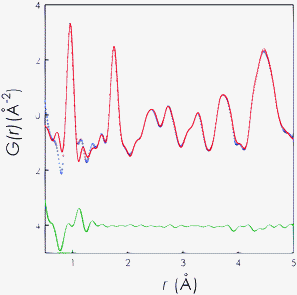
Fig. 4 shows the result of the PDF fit procedure for the WET sample. In this case, the starting atomic positions were taken from the results of the Rietveld refinement of the hexagonal structure but removing the symmetry constraints of this space group. In addition different models with hydroxyl groups placed in the structure framework or in the structure channel running along the c-axis were tested. The results shown in Fig. 4 correspond to the case where the hydroxyl group was placed within the channels of the structure. Any other model leads to unsatisfactory results. The goodness of PDF refinement is Rw = 10.2%.
 | ||
Fig. 4
PDF fit of WET La9.67(GeO4)O2.5 in the P![[1 with combining macron]](https://www.rsc.org/images/entities/char_0031_0304.gif) space group up to 5 Å. Blue circles: experimental data; red line: calculated PDF; and horizontal green line: residual. space group up to 5 Å. Blue circles: experimental data; red line: calculated PDF; and horizontal green line: residual. | ||
One of the most important and interesting results is the clear observation of a strong new peak around 1 Å (with respect to the DRY sample). This feature contains the contribution from D–O pairs of the hydroxyl group with a D–O distance of 0.96(4) Å which is in very good agreement with the distance calculated from atomistic simulation of ca. 0.99 Å.20 In addition, the position of the hydroxyl group has been found to lie in the O4 channel of the structure as predicted computationally. The O4–O(H) distance has been calculated to be 3.96(1) which is again in fairly good agreement with the value of 3.85 Å reported by Panchmatia et al.20 To the best of our knowledge this is the first direct experimental observation of D–O bonds within a deuterated oxide material and our results are in line with the structures of naturally occurring hydroxyl-apatites in which the hydroxyl ions lie along the oxide channel and with computer simulations carried out on the La9.67(GeO4)6O2.5apatite.
In this communication we have presented a local structure investigation of the La9.67(GeO4)6O2.5apatite by means of total neutron scattering data and PDF analysis. This work is the first experimental investigation aimed at studying the oxygen and proton defects in this class of exciting materials. First, an important result has been the confirmation that PDF analysis of neutron total scattering data can be a very powerful tool in order to investigate the atomic-scale features of complex oxide ion conductors such as apatites. Our results have confirmed that for germanates the oxygen interstitials are found in lattice positions within the Ge–O framework and not in the O-channel running through the c-axis. Due to the contrasting results presented in the literature which are based on the study of the average structure by means of NPD we have provided here a strong support to those experimental and theoretical models which locate the oxygen excess in the channel periphery. The investigation of a water-enriched sample allowed us to clearly view the contribution of proton (deuterium) defects within the apatite lattice. The results confirm the existence of hydroxyl groups within the oxide channel as computationally predicted as well as a significant local distortion of the crystal structure with respect to the hexagonal symmetry.
We acknowledge the support of the INSTM-Regione Lombardia Project “PICASSO”. This work has benefited from the use of NPDF at the Lujan Center at Los Alamos Neutron Science Center, funded by DOE Office of Basic Energy Sciences.
Notes and references
- S. Nakayama, H. Aono and Y. Sadaoka, Chem. Lett., 1995, 431 CAS.
- H. Arikawa, H. Nishiguchi, T. Ishihara and Y. Takita, Solid State Ionics, 2000, 136–137, 31 CrossRef CAS.
- P. R. Slater, J. E. H. Sansom and J. R. Tolchard, Chem. Rec., 2004, 4, 373 CrossRef CAS.
- E. Kendrick, M. S. Islam and P. R. Slater, J. Mater. Chem., 2007, 17, 3104 RSC.
- J. Sansom, D. Richings and P. R. Slater, Solid State Ionics, 2001, 139, 205 CrossRef CAS.
- L. León-Reina, E. R. Losilla, M. Martinez-Lara, M. C. Martin-Sedeno, S. Bruque, P. Nunez, D. V. Sheptyakov and M. A. G. Aranda, Chem. Mater., 2005, 17, 596 CrossRef CAS.
- L. León-Reina, E. R. Losilla, M. Martínez-Lara, S. Bruque and M. A. G. Aranda, J. Mater. Chem., 2004, 14, 1142 RSC.
- S. S. Pramana, W. T. Klooster and T. J. White, Acta Crystallogr., Sect. B, 2007, 63, 597 CrossRef.
- S. S. Pramana, W. T. Klooster and T. J. White, J. Solid State Chem., 2008, 181, 1717 CrossRef CAS.
- R. Ali, M. Yashima, Y. Matsushita, H. Yoshioka, K. Okoyama and F. Izumi, Chem. Mater., 2008, 20, 5203 CrossRef CAS.
- S. Guillot, S. Beaudet-Savignat, S. Lambert, R.-N. Vannier, P. Roussel and F. Porcher, J. Solid State Chem., 2009, 182, 3358 CrossRef CAS.
- J. R. Tolchard, M. S. Islam and P. R. Slater, J. Mater. Chem., 2003, 13, 1956 RSC.
- A. Jones, P. R. Slater and M. S. Islam, Chem. Mater., 2008, 20, 5055 CrossRef CAS.
- E. Kendrick, M. S. Islam and P. R. Slater, Chem. Commun., 2008, 715 RSC.
- S. J. L. Billinge and M. G. Kanatzidis, Chem. Commun., 2004, 749 RSC.
- T. Egami and S. J. L. Billinge, Underneath the Bragg peaks: structural analysis of complex materials, Pergamon Press, Elsevier, Oxford, England, 2003 Search PubMed.
- L. Malavasi, H. Kim, S. J. L. Billinge, Th. Proffen, C. Tealdi and G. Flor, J. Am. Chem. Soc., 2007, 129, 6903 CrossRef CAS.
- L. León-Reina, J. M. Porras-Vasquez, E. R. Losilla and M. A. G. Aranda, J. Solid State Chem., 2007, 180, 1250 CrossRef CAS.
- A. Orera and P. R. Slater, Solid State Ionics, 2010, 181, 110 CrossRef CAS.
- P. M. Panchmatia, A. Orera, E. Kendrick, J. V. Hanna, M. E. Smith, P. R. Slater and M. S. Islam, J. Mater. Chem., 2010, 20, 2766 RSC.
- P. F. Peterson, M. Gutmann, Th. Proffen and S. J. L. Billinge, J. Appl. Crystallogr., 2000, 33, 1192 CrossRef CAS.
- C. L. Farrow, P. Juhas, J. W. Liu, D. Bryndin, E. S. Bozin, J. Bloch, Th. Proffen and S. J. L. Billinge, J. Phys.: Condens. Matter, 2007, 19, 335219 CrossRef.
Footnotes |
| † Electronic supplementary information (ESI) available: Graphical representation of apatite structure. See DOI: 10.1039/c0cc00523a |
| ‡ This article is part of the ‘Emerging Investigators’ themed issue for ChemComm. |
| This journal is © The Royal Society of Chemistry 2011 |
