Simultaneous and selective voltammetric determination of epinephrine, acetaminophen and folic acid at a ZrO2 nanoparticles modified carbon paste electrode
Mohammad
Mazloum-Ardakani
*a,
Hadi
Beitollahi
a,
Mohammad Kazem
Amini
b,
Fakhradin
Mirkhalaf
c and
Mohammad
Abdollahi-Alibeik
a
aDepartment of Chemistry, Faculty of Science, Yazd University, Yazd, 89195-741, I.R. Iran. E-mail: mazloum@yazduni.ac.ir; Fax: +00983518210644; Tel: +00983518211670
bDepartment of Chemistry, University of Isfahan, Isfahan, 81744-73441, Iran
cSonochemistry Centre, Coventry University Coventry, CV1 5FB, UK
First published on 9th February 2011
Abstract
A new carbon paste electrode modified with ZrO2 nanoparticles (ZONMCPE) was prepared, and used to study the electrooxidation of epinephrine (EP), acetaminophen (AC), folic acid (FA) and their mixtures by electrochemical methods. The modified electrode displayed strong resolving function for the overlapping voltammetric responses of EP, AC and FA into three well-defined peaks. The potential differences between EP − AC, AC − FA and EP − FA were 210, 290 and 500 mV respectively. Differential pulse voltammetry (DPV) peak currents of EP, AC and FA increased linearly with their concentration at the ranges of 2.0 × 10⁻⁷–2.2 × 10⁻³ M, 1.0 × 10⁻⁶–2.5 × 10⁻³ M and 2.0 × 10⁻⁵–2.5 × 10⁻³ M, respectively. The detection limits for EP, AC and FA were found to be 9.5 × 10⁻⁸, 9.1 × 10⁻⁷and 9.8 × 10⁻⁶ M, respectively.
1. Introduction
Drug analysis plays important roles in drug quality control, and has a great impact on public health. Therefore, a simple, sensitive and accurate method for the determination of active ingredient is very important.Epinephrine (EP) is an important neurotransmitter in the mammalian central nervous systems,1 and exists in the nervous tissue and body fluid in the form of large organic cations. The changes in its concentration may result in many diseases.1 Thus; a quantitative determination of EP concentration is significant for developing nerve physiology, pharmacological research and life sciences. There are some methods applied for the determination of EP, such as high performance liquid chromatography (HPLC),2 capillary electrophoresis,3 flow injection,4 chemiluminescence,5 fluorimetry6 spectrophotometry7 and the electrochemiluminescence8 method. As an electroactive device, it can also be studied via electrochemical techniques. Some reports showed the electrochemical response of EP on different kinds of electrodes.9–12
Acetaminophen (AC) is categorized as analgesics (pain relievers) and antipyretics (fever reducers). When used appropriately, side effects are rare. The most serious side effect is liver damage due to large doses, chronic use or concomitant use with alcohol or other drugs. To date, a variety of methods such as high performance liquid chromatography (HPLC),13 spectrophotometry,14 capillary electrophoresis,15 have been developed for the determination of AC. AC is electro-active, and can be oxidized under certain conditions. Therefore, different electrochemical methods using various modified electrodes have also been proposed for the determination of AC.16,17
Folic acid (FA), is a water-soluble vitamin and can act as coenzyme in the transfer and utilization of one-carbon groups and in the regeneration of methionine from homocysteine.18 Deficiency of FA is a common cause of anaemia and it is thought to increase the likelihood of heart attack and stroke. Numerous methods for the measurement of FA are available.19–21 As FA is an electroactive component, some electrochemical methods have been reported for its determination.22,23
The electrochemical methods using chemically modified electrodes (CMEs) have been widely used as sensitive and selective analytical methods for the detection of the trace amounts of biologically important compounds.24–26
Electrode surfaces can be modified with metal nanoparticles and such surfaces have found numerous applications in the field of bioelectrochemistry, particularly in biosensors. It has also been observed that nanoparticles can act as conduction centers facilitating the transfer of electrons. In addition, they provide large catalytic surface areas. Many kinds of nanoparticles, including metal nanoparticles, oxide nanoparticles, semiconductor nanoparticles and even composite nanoparticles, have been widely used in electrochemical sensors and biosensors.27–31
Since EP, AC and FA are electroactive components they can be determined electrochemically. However, it is very difficult to distinguish their response signal at bare electrodes because of their similar potentials and interference from each other. Therefore, it is very important to develop a modified electrode to resolve their voltammetric response from each other. To the best of our knowledge, no study has been reported so far on the simultaneous determination of EP, AC and FA by using carbon paste electrodes modified with ZrO2 nanoparticles. In this study, we report the preparation and application of a carbon paste electrode modified with ZrO2 nanoparticles for the simultaneous determination of EP, AC and FA without any additional modification such as addition of electron transfer mediator or specific reagents for the first time.
2. Experimental
2.1. Apparatus and chemicals
The electrochemical measurements were performed with an Autolab potentiostat/galvanostat (PGSTAT-302 N, Eco Chemie, Netherlands) controlled by the General Purpose Electrochemical System (GPES) software. The ZONMCPE was used as the working electrode. An Ag/AgCl (3.0 KCl) electrode and a Pt wire were employed as the reference electrode and counter electrode, respectively and all potentials are reported with respect to the former. A Metrohm 691 pH/ion meter was used for pH measurements.All solutions were freshly prepared with doubly-distilled water. EP, AC, FA and all other reagents were analytical grade from Merck. Graphite powder and paraffin oil (DC 350, 0.88 g cm−3), both from Merck, were used as received. Phosphate buffer solutions (PBSs) were prepared from orthophosphoric acid and its salts in the pH range of 2.0–11.0. All solutions were deoxygenated with pure nitrogen gas for about 30 min prior to each electrochemical experiment.
2.2. Preparation of nanosized zirconia by the sol–gel method
Several methods have been reported in the literature for the preparation of zirconia nano particles.32–35 In this method ZrCl4 was used as inexpensive starting material and zirconia nano particles was prepared by control of concentration, addition rate of reactants and pH of reaction media.ZrO2 nanoparticles were synthesized via the sol–gel method. In a typical procedure, ZrCl4 (2.8 mg, 12 mmol) was dissolved in water (100 mL). To this solution was added drop wise an aqueous solution of 2.5 wt.% ammonium hydroxide (200 mL) under vigorous stirring for 4 h at room temperature until a final pH of ∼9.5 was reached. The resulting gel was separated by centrifuge and washed with water (4 × 100 mL) until no chloride ion was detected by the AgNO3 test. The hydrous zirconia was dried at 120 °C for 12 h. The solid was powdered and calcined at 480 °C in air for 4 h.
A Philips model XL30 scanning electron microscope was used to determine the morphology of the synthesized zirconia sample. The morphology of the prepared ZrO2 was studied by scanning electron microscopy (Fig. 1). The SEM image shows the agglomerated ZrO2 particles with an average size of less than 100 nm.
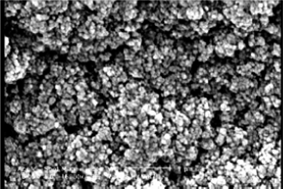 | ||
| Fig. 1 SEM of ZrO2 nanoparticles. | ||
2.3. Preparation of the electrode
The ZrO2 modified carbon paste electrodes were prepared by mixing 0.1 g of ZrO2 nanoparticles, 0.9 g of graphite powder and ∼0.7 mL of paraffin oil with a mortar and pestle until a uniform paste was obtained. The paste was then packed into the end of a glass tube (ca. 3.4 mm i.d. and 10 cm long). The electrical contact was provided by inserting a copper wire into the carbon paste. Prior to the experiment, the surface of the carbon paste was polished with fine paper. The unmodified carbon paste electrode was prepared in the same way without adding ZrO2 nanoparticles to the paste.3. Result and discussion
3.1. Cyclic voltammetric study of EP
Fig. 2 depicts the cyclic voltammetric responses for the electrochemical oxidation of 1.0 mM EP at ZONMCPE (curve a) and bare CPE (curve b). The anodic peak potential for the oxidation of EP at ZONMCPE (curve a) is about 340 mV compared with 450 mV for that on the bare CPE (curve b). Similarly, when the oxidation of EP at the ZONMCPE (curve a) and bare CPE (curve b) are compared, an extensive enhancement of the anodic peak current at ZONMCPE relative to the value obtained at the bare CPE (curve b) is observed. In other words, the results clearly indicate that the combination of graphite powder and ZrO2 nanoparticles improve the EP oxidation signal.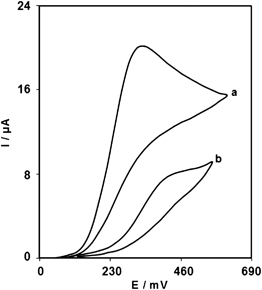 | ||
| Fig. 2 Cyclic voltammograms of (a) ZONMCPE and (b) bare CPE in 0.1 M PBS (pH 7.0) in the presence of 1.0 mM EP at the scan rate 20 mV s−1. | ||
The effect of scan rate on the electro-oxidation of EP at the ZONMCPE was investigated by cyclic voltammetry (Fig. 3). A plot of peak current (Ip) versus the square root of scan rate (ν1/2), in the range of 10–1000 mV s−1 (Fig. 3 (A)) is linear. This suggests that, at sufficient overpotential, the process is diffusion rather than surface controlled.36
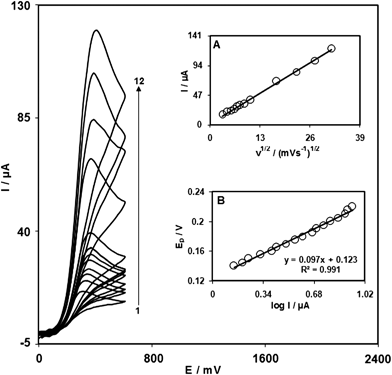 | ||
| Fig. 3 Cyclic voltammograms of the ZONMCPE in the presence of 1.0 mM EP at various scan rates; The numbers 1–12 correspond to 10, 20, 30, 40, 50, 60, 80, 110, 300, 500, 750 and 1000 mV s−1 scan rates, respectively. Insets: (A) The variation of the anodic peak currents vs. v1/2. (B) Tafel plot derived from the rising part of voltammogram recorded at a scan rate 10 mV s−1. | ||
A Tafel plot was obtained from data of the rising part of the current–voltage curve recorded at a scan rate of 10 mV s−1 (Fig. 3 (B)). This part of voltammogram, known as Tafel region, is controlled by the electron transfer kinetics between the substrate (EP) and ZONMCPE, assuming a fast proton transport step. In this condition, the number of electrons involved in the rate determining step can be estimated from the slope of Tafel plot. The Tafel slope was found to be 0.0972 V decade−1 and thus the charge transfer coefficient was calculated as α = 0.39.
3.2. Chronoamperometric measurements
Current as a function of time is the system response as well as the monitored response in chronoamperometry. Chronoamperometry has proven useful for the measurement of diffusion coefficients of electroactive species. Therefore chronoamperometry was employed for the investigation of electro-oxidation of EP at ZONMCPE by setting the working electrode potential at 0.4 V. Chronoamperometric measurements of EP at ZONMCPE were done for various concentrations of EP (in the range of 0.15–2.8 mM). For an electroactive material (EP in this case) with a diffusion coefficient of D, the current for the electrochemical reaction (at a mass transport limited rate) is described by the Cottrell equation:36| I = nFAD1/2Cbπ−1/2t−1/2 | (1) |
The slope of linear region of Cottrell's plot can be used to estimate the diffusion coefficient of EP. The mean value of EP diffusion coefficient in the ranges (0.15–2.80 mM) was found to be 8.3 × 10⁻⁶ cm2 s−1.
3.3 Calibration plots and simultaneous determination of EP, AC and FA at ZONMCPE
Differential pulse voltammetry (DPV) was used to obtain the analytical features of the method such as linear ranges of the calibration plots, and detection limits for EP, AC and FA. The results are presented in Table 1.| Analyte | Linear range (M) | Regression equation | Correlation coefficient | Detection limit (M) |
|---|---|---|---|---|
| EP | 2.0 × 10⁻⁷–2.2 × 10⁻³ | I (μA) = 0.016C (μM) + 0.5934 | 0.999 | 9.5 × 10⁻⁸ |
| AC | 1.0 × 10⁻⁶–2.5 × 10⁻³ | I (μA) = 0.0172C (μM) + 0.3823 | 0.9989 | 9.1 × 10⁻⁷ |
| FA | 2.0 × 10⁻⁵–2.5 × 10⁻³ | I (μA) = 0.0085C (μM) + 1.6836 | 0.9985 | 9.8 × 10⁻⁶ |
Capability of separating the electrochemical responses of EP, AC and FA by a modified electrode was studied. Therefore, DPV was used for the simultaneous determination of EP, AC and FA. The importance of DPV in determination of species is based on its superior elimination of the capacitive/background current. Analytical experiments were carried out by varying the concentration of AC or FA in the presence of constant concentrations of EP in 0.1 M PBS (pH 7.0) by using ZONMCPE as the working electrode. Fig. 4A and 4B show DPVs obtained in 900.0 and 800.0 μM EP containing increasing concentrations of AC and FA, respectively. It can be clearly seen that the response of the ZONMCPE to EP is independent of both AC and FA. The utilization of the ZONMCPE for the simultaneous determination of EP, AC and FA was demonstrated by simultaneously changing the concentrations of EP, AC and FA. The DP voltammetric results show three well-distinguished anodic peaks at potentials of 250, 460 and 750 mV, corresponding to the oxidation of EP, AC and FA, respectively, indicating that the simultaneous determination of EP, AC and FA is possible at the ZONMCPE (Fig. 5). The sensitivities of the ZONMCPE towards EP, AC and FA in the individually (0.016, 0.0172 and 0.0085 μA μM−1) and simultaneous (0.0158, 0.017 and 0.0087 μA μM−1) determination are virtually the same, which further indicate that the oxidation processes of EP, AC and FA at the ZONMCPE are independent and therefore, simultaneous measurements of the three analytes are feasible without any interference.
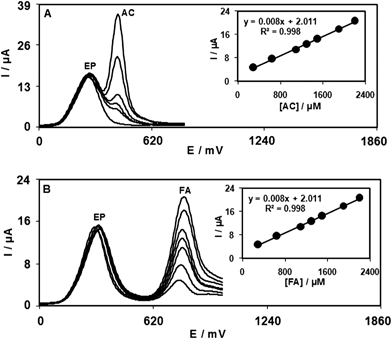 | ||
| Fig. 4 (A) Differential pulse voltammograms of ZONMCPE in 0.1 M PBS (pH 7.0) containing 900.0 μM EP and different concentrations of AC, from bottom to top, 325.0, 450.0, 600.0, 1300.0 and 2100.0 μM, respectively. Inset: plot of the peak current as a function of AC concentration. (B) Differential pulse voltammograms of ZONMCPE in 0.1 M PBS (pH 7.0) containing 800.0 μM EP and different concentrations of FA, from bottom to top: 300.0, 650.0, 1100.0, 1300.0, 1500, 1900 and 2200.0 μM, respectively. Inset: plot of the peak current as a function of FA concentration. | ||
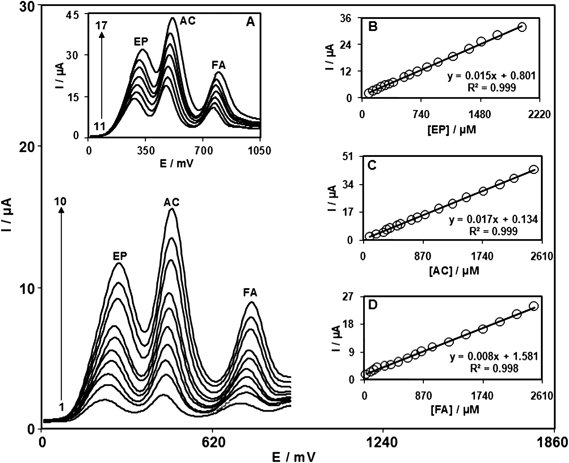 | ||
| Fig. 5 Differential pulse voltammograms of ZONMCPE in 0.1 M PBS (pH 7.0) containing different concentrations of EP + AC + FA, (numbers 1–17 correspond to) 100.0 + 100.0 + 30.0, 150.0 + 200.0 + 100.0, 200.0 + 300.0 + 150.0, 250.0 + 350.0 + 200.0, 300.0 + 400.0 + 300.0, 350.0 + 500.0 + 400.0, 400.0 + 550.0 + 500.0, 525.0 + 700.0 + 650.0, 600.0 + 800.0 + 750.0, 700.0 + 900.0 + 850.0, 825.0 + 1100.0 + 1000.0, 950.0 + 1300.0 + 1250.0, 1150.0 + 1500.0 + 1500.0, 1350.0 + 1750.0 + 1750.0, 1500.0 + 2000.0 + 2000.0, 1700.0 + 2200.0 + 2250.0, and 2000.0 + 2500.0 + 2500.0 μM, respectively. Insets: (B) plot of the peak current as a function of EP concentration. (C) plot of the peak current as a function of AC concentration. (D) plot of the peak current as a function of FA concentration. | ||
3.4 Real sample analysis
One millilitre of an EP ampoule was diluted to 10 mL with phosphate buffer solution (0.1 M, pH 7.0); then, a different capacity of the diluted solution was transferred into each of a series of 10 mL volumetric flasks and diluted to the mark with phosphate buffer. Each sample solution was transferred into the electrochemical cell and DPV was recorded between 0.0 and 0.5 V at a scan rate of 10 mV s−1. The Ipa was measured at the oxidation potential of EP and the concentration of this compound was obtained from the calibration plot. This procedure was repeated five times for each sample, and the average amount of EP in the injection was found to be 0.987 mg, a value in good agreement with the value on the ampoule label (1.0 mg). Also, to a series of 10 mL volumetric flasks, a different capacity of the diluted EP injection solution together with standard AC and FA solutions were added and diluted to the mark with phosphate buffer. The DPVs were recorded and the anodic peak currents for each of EP, AC and FA were measured at their own oxidation potentials. According to the results listed in Table 2, very good recoveries for the determinations of EP, AC and FA were obtained with high reproducibility, which indicates that the sensor can be applied for the analysis of these compounds with no significant influence from each other.| No. | EP injection (μM) | AC added (μM) | FA added (μM) | EP | AC | FA | ||||||
|---|---|---|---|---|---|---|---|---|---|---|---|---|
| Found (μM) | Recovery (%) | RSD (%) | Found (μM) | Recovery (%) | RSD (%) | Found (μM) | Recovery (%) | RSD (%) | ||||
| 1 | 10 | 20 | 50 | 10.23 | 102.3 | 2.7 | 20.34 | 101.7 | 1.9 | 49.12 | 98.24 | 2.4 |
| 2 | 20 | 30 | 60 | 19.62 | 98.1 | 3.1 | 30.85 | 102.8 | 2.3 | 61.59 | 102.6 | 1.5 |
| 3 | 30 | 40 | 70 | 29.73 | 99.1 | 1.6 | 39.38 | 98.45 | 2.9 | 70.93 | 101.3 | 3.2 |
4. Conclusion
The present work reports the construction of a novel carbon paste electrode modified with ZrO2 nanoparticles and its application for the simultaneous determination of EP, AC and FA. The high selectivity and sensitivity of the ZONMCPE for the detection of EP, AC and FA prove its potential for sensing applications. The results show that the oxidation of EP is catalyzed at pH 7.0 and the peak potential of EP is shifted by 110 mV to a less positive potential at the surface of the ZONMCPE. The ZONMCPE exhibits highly electrocatalytic activity to the oxidations of EP, AC and FA.References
- W. A. Banks, Brain Res., 2001, 899, 209 CrossRef CAS.
- M. A. Fotopoulou and P. C. Loannou, Anal. Chim. Acta, 2002, 462, 179 CrossRef CAS.
- S. L. Wei, G. Q. Song and J. M. Li, J. Chromatogr., A, 2005, 1098, 166 CrossRef CAS.
- J. X. Du, L. H. Shen and J. R. Lu, Anal. Chim. Acta, 2003, 489, 183 CrossRef CAS.
- Z. Lin, X. Wu, X. Lin and Z. Xie, J. Chromatogr., A, 2007, 1170, 118 CrossRef.
- P. Canizares and L. de Castro, Anal. Chim. Acta, 1995, 317, 335 CrossRef CAS.
- M. H. Sorouraddin, J. L. Manzoori, E. Kargarzadeh and A. M. H. Shabani, J. Pharm. Biomed. Anal., 1998, 18, 877 CrossRef CAS.
- Y. Su, J. Wang and G. Chen, Talanta, 2005, 65, 531–536 CrossRef CAS.
- H. Beitollahi, M. Mazloum Ardakani, B. Ganjipour and H. Naeimi, Biosens. Bioelectron., 2008, 24, 362 CrossRef CAS.
- Z. Yang, G. Hu, X. Chen, J. Zhao and G. Zhao, Colloids Surf., B, 2007, 54, 230 CrossRef CAS.
- M. Mazloum-Ardakani, H. Beitollahi, M. A. Sheikh-Mohseni, A. Benvidi, H. Naeimi, M. Nejati-Barzoki and N. Taghavinia, Colloids Surf., B, 2010, 76, 82 CrossRef CAS.
- H. Yi, D. Zheng, C. Hu and S. Hu, Electroanalysis, 2008, 20, 1143 CrossRef CAS.
- Y. Ishii, M. Iijima, T. Umemura, A. Nishikawa, Y. Iwasaki, R. Ito, K. Saito, M. Hirose and H. Nakazawa, J. Pharm. Biomed. Anal., 2006, 41, 1325 CrossRef CAS.
- J. Hanaee, Pharm. Acta Helv., 1997, 72, 239 CrossRef CAS.
- Q. Chu, L. Jiang, X. Tian and J. Ye, Anal. Chim. Acta, 2008, 606, 246 CrossRef CAS.
- M. Mazloum-Ardakani, H. Beitollahi, M. A. Sheikh-Mohseni, H. Naeimi and N. Taghavinia, Appl. Catal., A, 2010, 378, 195 CrossRef CAS.
- N. Havensa, P. Trihna, D. Kimb, M. Lunab, A. K. Wanekayab and A. Mugwerua, Electrochim. Acta, 2010, 55, 2186 CrossRef.
- C. M. Pfeiffer, Z. Fazili, L. McCoy, M. Zhang and E. W. Gunter, Clin. Chem., 2004, 50, 423 CrossRef CAS.
- S. L. Zhaoa, H. Y. Yuan, C. Xie and D. Xiao, J. Chromatogr., A, 2006, 1107, 290 CrossRef CAS.
- Z. Song and X. Zhou, Spectrochim. Acta, Part A, 2001, 57, 2567 CrossRef CAS.
- A. Rodriguez-Bernaldo de Quiros, C. Castro de Ron, J. Lopez-Hernandez and M. A. Lage-Yusty, J. Chromatogr., 2004, 1032, 135 CrossRef CAS.
- M. Korolczuk and K. Tyszczuk, Electroanalysis, 2007, 19, 1959 CrossRef CAS.
- A. A. Ensafi and H. Karimi-Maleh, J. Electroanal. Chem., 2010, 640, 75 CrossRef CAS.
- M. Mazloum-Ardakani, H. Beitollahi, M. K. Amini, Fakhradien Mirkhalf and Bibi-Fatemeh Mirjalili, Biosens. Bioelectron., 2011, 26, 2102 CrossRef CAS.
- M. Mazloum-Ardakani, Z. Taleat, H. Beitollahi and Hossein Naeimi, Anal. Methods, 2010, 2, 149 RSC.
- M. Mazloum-Ardakani, H. Beitollahi, M. K. Amini, F. Mirkhalaf and M. Abdollahi-Alibeik, Sens. Actuators, B, 2010, 151, 2430.
- M. Kathiwala, A. O. Affum, J. Perry and A. Brajter-Toth, Analyst, 2008, 6, 810 Search PubMed.
- M. Mazloum-Ardakani, H. Beitollahi, Z. Taleat, H. Naeimi and N. Taghavinia, J. Electroanal. Chem., 2010, 644, 1 CrossRef CAS.
- M. Mazloum-Ardakani, R. Arazi, H. Beitollahia and Hossein Naeimi, Anal. Methods, 2010, 2, 1078 RSC.
- Christopher B. Jacobs, M. Jennifer Peairs and B. Jill Venton, Anal. Chim. Acta, 2010, 662, 105 CrossRef CAS.
- M. H. Mashhadizadeh and H. Khani, Anal. Methods, 2010, 2, 24 RSC.
- M. Epifani, J. Arbiol, E. Pellicer, N. Sergent, T. Pagnier and J. R. Morante, Mater. Chem. Phys., 2010, 124, 809 CrossRef CAS.
- T. Suzuki-Muresan, P. Deniard, E. Gautron, V. Petříček, S. Jobic and B. Grambow, J. Appl. Crystallogr., 2010, 43, 1092 CrossRef CAS.
- A. A. Ashkarran, S. A. Ahmadi Afshar, S. M. Aghigh and M. kavianipour, Polyhedron, 2010, 29, 1370 CrossRef CAS.
- N. T. Kalyana Sundaram, T. Vasudevan and A. Subramania, J. Phys. Chem. Solids, 2007, 68, 264 CrossRef.
- A. J. Bard and L. R. Faulkner, Electrochemical Methods, Fundamentals and Applications, Wiley, New York, 2001 Search PubMed.
| This journal is © The Royal Society of Chemistry 2011 |