An online ionic liquid-based microextraction system coupled to electrothermal atomic absorption spectrometry for cobalt determination in environmental samples and pharmaceutical formulations
Paula
Berton
a and
Rodolfo G.
Wuilloud
*ab
aAnalytical Chemistry Research and Development Group (QUIANID), (LISAMEN—CCT—CONICET—Mendoza), Av. Ruiz Leal S/N Parque General San Martín, M 5502 IRA, Mendoza, Argentina. E-mail: rwuilloud@mendoza-conicet.gob.ar; Web: http://www.mendoza-conicet.gob.ar/lisamen/english/ Fax: +54-261-5244001; Tel: +54-261-5244064
bInstituto de Ciencias Básicas, Universidad Nacional de Cuyo, Mendoza, Argentina
First published on 3rd February 2011
Abstract
In the present work, an ionic liquid (IL) lighter than water was employed as extraction solvent in a dispersive liquid–liquid microextraction (DLLME) methodology. An original flow injection system for online microextraction and preconcentration of cobalt (Co) based on the use of tetradecyl(trihexyl)phosphonium chloride (CYPHOS® IL 101) was designed. Cobalt was complexed with 4-(2-pyridylazo)-resorcinol (PAR) reagent at pH 4.8 and then, the IL-DLLME procedure was developed by dispersing CYPHOS® IL 101 with acetone in an aqueous solution containing Co–PAR complex. Different pyridylazo dyes were evaluated for Co preconcentration in terms of their molecular structure, stability and acid–base equilibrium. Online extraction of Co–PAR into the IL and separation of the dispersed IL enriched phase were accomplished with a microcolumn containing Florisil material. Cobalt was removed from the microcolumn with a 10% (v/v) HNO3 acidified-acetone solution and finally measured by electrothermal atomic absorption spectrometry (ETAAS). The detection limit achieved after preconcentration of 2 mL of sample solution was 8 ng L−1. The precision for 10 replicate determinations at the 1 µg L−1Co level was 5.1% relative standard deviation (RSD), calculated from the peak heights obtained. The method was successfully applied to Co determination in water samples as well as ophthalmic and parenteral solutions. For the first time, an IL-based microextraction technique was applied for metal determination in these complex samples, where Co recovery varied between 97.9 and 103%.
Introduction
The impact of trace elements on environment and man's health has fostered the development of analytical techniques and instrumentation capable of measuring concentrations lower than the parts per million level and, more frequently, parts per billion or less.1Cobalt (Co) is an essential trace element in nature, having an important role in many body functions, mainly as a component of vitamin B12.2 However, and depending on its concentration, it can be either essential or toxic for many organisms, including humans.3 One route for metal incorporation into the human body is the administration of nutrients directly into the bloodstream, called parenteral nutrition (PN). This nutrition is an important supportive for patients with gut failure or who are unable to intake food by an oral or enteral route.4 Heavy-metal contamination can occur in PN preparations, which could result in tissue accumulation and pathologic changes.5 Thus, adequate and accurate regulation of trace metals and careful measuring of possible contamination in parenteral fluids are important for assessing the problem.6 However, powerful analytical techniques are required for trace amounts determination and only few of them show enough sensitivity. Among them, electrothermal atomic absorption spectrometry (ETAAS) and inductively coupled plasma mass spectrometry (ICP-MS) are the most commonly employed for trace metal determination, but the low levels of Co are often not compatible with the detection limits of these techniques. Moreover, a drawback for ICP-MS analysis is its unstable spraying conditions and frequently clogging of the nebulizer by deposits when analyzing samples with a high salt content.7 On the other hand, ETAAS is a good choice for the determination of trace and ultra-trace elements in environmental, biological and clinical samples, as it offers high sensitivity, low sample consumption and cost-effective analysis.8 Nevertheless, in order to achieve accurate, reliable and sensitive results, it is necessary to perform a separation and preconcentration procedure for trace element detection.Sample preparation processes developed in batch mode are usually time consuming and labour excessive, besides tending to consume excessive amounts of reagents and producing large amounts of harmful organic solvents.9 In order to overcome these drawbacks, flow injection (FI) techniques have been well developed as a tool for automation, speeding up and miniaturization of solution handling during sample preparation. Likewise, improved precision, enrichment factors and limits of detection (LODs) can be ensured.10 Comparing with conventional liquid–liquid extractions (LLEs), FI systems provide advantages for reducing contamination risks as they are mainly closed systems made of inert materials and isolated from the environment.11 Ionic liquids (ILs), especially hydrophobic ones, have been proposed as alternative solvents for extracting low polar compounds from aqueous solutions.12 Their reduced or non-detectable volatility makes these solvents promising replacements to regular organic solvents, thus diminishing safety concern related with high organic solvent consumption during classical LLE procedures.12 Likewise, scale down of extraction protocols by diminishing the extractant phase volume is especially important when expensive samples and reagents are employed or a limited amount of these are available.13 Among miniaturization techniques, ionic liquid-based dispersive liquid–liquid microextractions (IL-DLLMEs) have been proposed as novel liquid–liquid microextraction techniques for metal preconcentration.14 IL-DLLME shows important advantages over conventional extraction techniques, since it is fast and easy to operate.14 However, these procedures have been mainly developed in batch-mode, entailing similar drawbacks than conventional LLE.15 Moreover, a practical limitation of IL-DLLME is the pre-requisite that IL should have higher density than water to achieve straightforward phase separation, thus conditioning the selection of the IL.
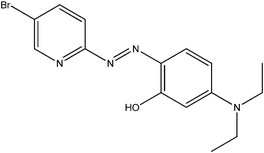
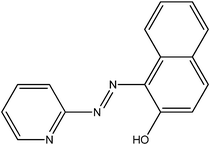
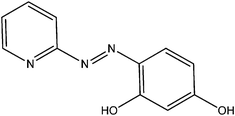
In the present work, a solution for the above mentioned drawback is proposed. A flow injection system for online IL-DLLME is presented, allowing the use of phosphonium-ILs, which are less dense than water, but with higher availability and lower cost than other ILs commonly employed for IL-DLLME.16 The application of different pyridylazo dyes (Table 1) in the IL-based extraction approach for Co preconcentration was evaluated in terms of their molecular structure, stability and acid–base equilibrium. The method was finally developed with initial chelation of Co with 4-(2-pyridylazo)-resorcinol (PAR) followed by DLLME with tetradecyl(trihexyl)phosphonium chloride (CYPHOS® IL 101). Separation of the IL phase and analyte extraction were performed in an online system directly coupled to ETAAS for Co determination. The method was applied to the determination of trace Co in water samples as well as parenteral and ophthalmic solutions.
| 5-Br-PADAP | PAN | PAR | |
|---|---|---|---|
| Structure |
|
|
|
| Acid dissociation constants21,34 | |||
| pKa1 | 0.10 | 1.9 | 2.5 |
| pKa2 | 2.02 | 12.2 | 5.6 |
| pKa3 | 11.3 | 11.9 | |
| Fractional composition diagrams: molar fraction (α) vs. pH | |||

|
|

|
|
| ■ LH32+; ● LH2+; ▲ LH; ▼ L− | ■ LH2+; ● LH; ▲ L− | ■ LH32+; ● LH2+; ▲ LH; ▼ L− | |
Experimental
Instrumentation
Experiments were performed using a Perkin Elmer (Shelton, CT, USA) model 5100ZL atomic absorption spectrometer equipped with a graphite furnace module, a pyrolytic graphite tube (Perkin Elmer) and a transversely heated graphite atomizer Zeeman-effect background correction system. A Co hollow cathode lamp (SCP Science, Champlain, NY, USA) operated at a current of 15 mA and a wavelength of 240.7 nm with a spectral bandwidth of 0.2 nm was used. All absorbance measurements were performed using peak heights. Temperature and time programs for ETAAS instrument were as shown in Table 2.| Instrumental conditions | |
|---|---|
| Wavelength | 240.7 nm |
| Spectral bandwidth | 0.2 nm |
| Lamp current | 15 mA |
| Injection volume | 100 µL |
| Modifier (Pd) mass | 7.5 µg (15 µL) Pd |
| Graphite furnace temperature program | ||||
|---|---|---|---|---|
| Step | Temperature/°C | Ramp time/s | Hold time/s | Argon flow rate/mL min−1 |
| Drying 1 | 110 | 20 | 50 | 250 |
| Drying 2 | 130 | 30 | 30 | 250 |
| Pyrolysis 1 | 600 | 80 | 15 | 250 |
| Pyrolysis 2 | 800 | 10 | 10 | 250 |
| Pyrolysis 3 | 1200 | 10 | 10 | 250 |
| Atomization | 2400 | 0 | 3 | — |
| Cleaning | 2400 | 1 | 2 | 250 |
| Extraction conditions | |
|---|---|
| Sample volume | 2 mL |
| PAR concentration | 8.5 × 10⁻⁵ mol L−1 |
| Working pH | 4.8 |
| Buffer concentration | 2.5 × 10⁻² mol L−1 |
| Surfactant concentration (Triton X-114) | 0.1% (w/v) |
| NaClO4 concentration | 2.4% (w/v) |
| IL amount | 35 mg (approx. 40 µL) |
| Disperser solvent | Acetone |
| Volume of disperser solvent | 100 µL |
| Eluent | Acetone [10% (v/v) HNO3] |
| Eluent volume | 100 µL |
| Loading flow rate | 0.5 mL min−1 |
| Elution flow rate | 0.25 mL min−1 |
The online procedure is shown schematically in Fig. 1. A similar FI device, adapted for a cold induced aggregation microextraction (CIAME) procedure utilizing an IL with higher density than water, has been employed previously by our group.17 The FI system consisted of two Gilson (Villiers Le-Bell, France) Minipuls 3 peristaltic pumps, two six-port two-position injection valves (Oak Harbor, WA, USA) and a homemade microcolumn (12 mm length; 2 mm i.d.) filled with Florisil and fitted with porous 25 µm glass frits for online retention of the IL dispersed phase. Tygon-type pump tubes (Gilson) were employed for all aqueous streams delivery. Solvent-resistant pump tubes (Gilson) were employed for delivery of the acidified acetone stream.
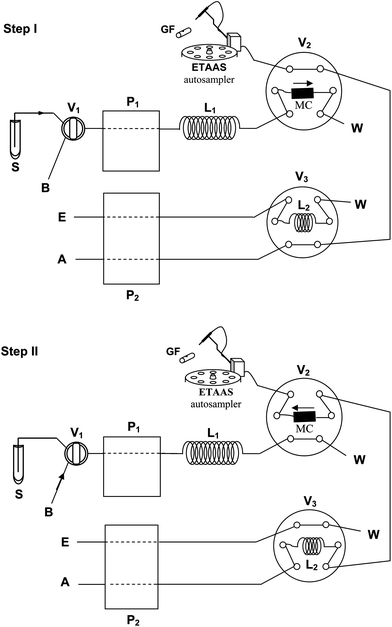 | ||
| Fig. 1 Flow injection device and its operation sequence for online DLLME and determination of cobalt. Load (Step I) and Injection (Step II) positions. ETAAS: electrothermal atomic absorption spectrometer; GF: graphite furnace; P1 and P2: peristaltic pumps; V1, V2, and V3: injection valves; L1: mixing loop; L2: solvent loop; S: sample; B: buffer; E: eluent; A: air; W: waste; MC: microcolumn. | ||
Chemicals and standards
A 1000 mg L−1Co(II) stock standard solution was prepared by dissolving 0.5033 g of Co(II) nitrate hexahydrate (98%) (Aldrich, Milkwaukee, WI, USA) in 100 mL of 0.1% (v/v) HNO3 (Merck, Darmstadt, Germany) solution. Lower concentrations were prepared by diluting the stock solution with 0.1 mol L−1HNO3. Appropriate amounts of PAR (98%) (Aldrich), 2-(5-bromo-2-pyridylazo)-5-diethylaminophenol (5-Br-PADAP) (Aldrich) or 1-(2-pyridylazo)-2-naphthol (PAN) (MP Biomedicals, Ohio, USA) were dissolved in 100 mL of methanol in order to obtain 10−2 mol L−1 solutions. Lower concentrations of the pyridylazo solutions were prepared by serial dilution with methanol. A 2.0 mol L−1acetic acid–acetate solution (Merck) adjusted to pH 4.8 by dissolution of sodium hydroxide (Merck) was employed as buffer solution. A surfactant solution containing 5% (w/v) Triton X-114 (Merck) was used as anti-sticking agent. A 24% (w/v) sodium perchlorate solution was prepared by dissolving 6 g of NaClO4 (Merck) in 25 mL of ultrapure water. For chemical modification, a 1000 mg L−1Pd solution was prepared by dissolving 62.7 mg Pd(NO3)2·2H2O (Fluka, Buchs, Switzerland) in 25 mL 0.1% (v/v) HNO3. The IL, CYPHOS® IL 101 (density (ρ) 0.8826 g cm−3 (298.15 K)18), was provided by CYTEC Industries Inc. (Canada). Synthetic magnesium silicate, Florisil (100–200 mesh particle size, 289 m2 g−1 surface area) (Sigma-Aldrich) was selected as filling material for the microcolumn. Ultrapure water (18 MΩ cm) was obtained from a Millipore Continental Water System (Bedford, MA, USA). All glassware was washed with a 0.1 mol L−1HNO3 solution at least for 24 h and thoroughly rinsed with ultrapure water before use.Sampling collection and conditioning
Online microextraction and separation procedure
2 mL of the pre-treated sample or a 5 µg L−1Co(II) standard solution (for method optimization), 17 µL of 10−2 mol L−1PAR solution, 25 µL of 2 mol L−1 (pH 4.8) acetate/acetic acid buffer, 200 µL of 24% (w/v) NaClO4 and 40 µL of 5% (w/v) Triton X-114 were placed in a 10 mL glass marked conical tube. 100 µL of acetone containing 35 mg of CYPHOS® IL 101 was then rapidly injected to the sample solution and the tube was immediately agitated with a vortex stirrer.The role and elapsed time of each online step are summarized in Table 3. Before loading, the column was conditioned for preconcentration at the correct pH with a buffer-diluted solution, valve V1 in position B (buffer load), which was propelled by the peristaltic pump P1. After this procedure, the valve V1 was switched to the S position (sample load). The dispersed mixture was propelled (Step I) by pump P1 at a flow rate of 0.5 mL min−1. The Co–PAR complex was thus online extracted into the dispersed IL phase and finally retained in the Florisil-packed microcolumn. Valve V2 was set in load position during this operation (Table 3). After loading, further washing with a 0.025% (w/v) Triton X-114 solution served to remove any sample still present in the lines. Simultaneously, pump P2 delivered 10% (v/v) HNO3 acidified-acetone to the solvent loop (L2) of valve V3 until it was filled. Then, pump P2 was turned off. The arm of ETAAS autosampler was then manually moved into the dosing hole of the graphite tube.
| Step | Time | Flow rate/mL min−1 | Active pump | Valve positionsa | Purpose | ||
|---|---|---|---|---|---|---|---|
| V1 | V2 | V3 | |||||
| a Valve positions: B: buffer load position; L: load position; S: sample load position; I: injection position. | |||||||
| I | 30 s | 1 | P1 | B | L | L | Column conditioning |
| 4 min | 0.5 | P1 and P2 | S | L | L | Sample and solvent load | |
| 30 s | 1 | P1 | B | L | L | Remove sample present in the line, vial and column | |
| II | 54 s | 0.25 | P2 | B | I | I | Elute analyte into graphite tube |
During Step II, valves V2 and V3 were set on injection position and the retained IL phase containing Co–PAR was eluted from the microcolumn with 100 µL of 10% (v/v) HNO3 acidified-acetone in countercurrent mode. Elution was performed by a stopped-flow procedure filling the microcolumn with the eluent solution and keeping it for 0.5 min. Then, the eluent was delivered by pump P2 with an air stream at a flow rate of 0.25 mL min−1 directly into the graphite tube of ETAAS for Co determination. After injection, the autosampler arm was retracted to the washing position. The concentration of Co was evaluated by ETAAS using peak heights and under the instrumental conditions shown in Table 2. Calibration was performed against aqueous standards submitted to the same preconcentration procedure. Likewise, blank solutions were analyzed following the same procedure as standard and sample solutions.
Results and discussion
ETAAS conditions for Co determination in IL phase
Initial studies were focused on obtaining high accuracy and precision for ETAAS measurements of Co in the presence of the CYPHOS® IL 101 matrix. An increased background signal was observed during the atomization step due to the organic nature of the IL matrix. A minimal background absorbance makes background correction more accurate. Therefore, different heating ramps during pyrolysis were evaluated to increase matrix elimination and then obtain minimal or no background signal later on the atomization step. Although a background reduction was achieved, it was also observed that the Co signal gradually decreased by increasing the IL concentration. This could be attributable to minor smoke originated during thermal decomposition of the IL in the pyrolysis step, resulting in Co loss during the ashing stage. In order to improve the Co signal, different amounts of NH4H2PO4, Mg(NO3)2, Pd(NO3)2 and a mixture of them were tested as chemical modifiers. A significant background reduction (about 50%) as well as sharp and well-defined absorption peaks were obtained when 7.5 µg of Pd were injected into the graphite furnace. Hence, Pd was used in subsequent experiments as a chemical modifier.Finally, a 100 µg L−1Co solution under same conditions as resulting from extraction procedures, and with equal mass of CYPHOS® IL 101, was employed for optimization of pyrolysis and atomization temperatures. Optimal pyrolysis and atomization temperatures were selected by considering absorption-to-background ratio and peak shape. Well defined Gaussian and sharp peaks were considered as optimal. For temperature values higher than 1200 °C, analyte loss was evidenced during pyrolysis (Fig. 2). On the other hand, no signal was observed when this temperature was assayed in the atomization step. The effect of atomization temperature on Co measurement was studied within the range of 2200–2600 °C. The maximum absorption signal was obtained at 2400 °C (Fig. 2). Therefore, pyrolysis and atomization temperatures for next experiments were selected as 1200 °C and 2400 °C, respectively. The resulting acetone–IL phase was thus successfully analyzed by ETAAS under the conditions showed in Table 2. Optimum ETAAS conditions (Table 2) allowed loading up to 40 mg of IL into the graphite furnace without significantly reducing analytical sensitivity. It has to be stated that even though toxicological aspects of ILs are still under current study, one notorious advantage of the proposed method is originated from the use of ETAAS as a detector. Therefore, during the pyrolysis step, organic matter is completely eliminated, avoiding waste generation at the end of the analytical process.
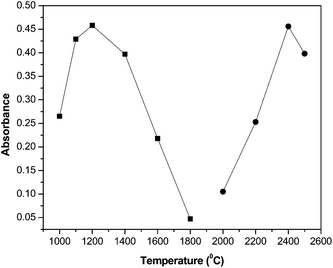 | ||
| Fig. 2 Pyrolysis (■) and atomization (●) temperature curves obtained by injection of a 100 µg L−1Co solution in the presence of 8.5 × 10⁻⁵ mol L−1PAR in IL acidified acetone, with 7.5 µg of Pd as modifier. Atomization temperature for pyrolysis optimization: 2500 °C. Pyrolysis temperature for atomization optimization: 1200 °C. Additional instrumental variables were as mentioned in Table 2 (95% confidence interval; n = 6). | ||
Complex formation and extraction mechanism
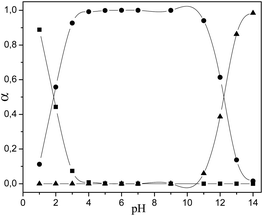
First attempts for Co extraction into ILs employed pyridylazo and thiazolylazo reagents (PAN and TAN) in order to increase partitioning of metal ions from aqueous to IL phases.19 Because of their fast kinetics of complex formation, low price and sensitive chromogenic reagents, complexation of metals with pyridylazo-type reagents has been successfully applied not only in spectrophotometric detection but also in atomic absorption spectrometry, chromatography, extraction separation (such as solid phase, liquid–liquid and cloud point extraction) and electrochemical analysis, etc.20 In this work, three pyridylazo dyes were evaluated (PAR, PAN and 5-Br-PADAP, shown in Table 1), in the pH range 2–8 by adding appropriate volumes of HCl or NaOH solution to the samples. These molecules act as tridentate ligands and generally yield chelates with a stoichiometry of metal![[thin space (1/6-em)]](https://www.rsc.org/images/entities/char_2009.gif) :
:![[thin space (1/6-em)]](https://www.rsc.org/images/entities/char_2009.gif) ligand 2
ligand 2![[thin space (1/6-em)]](https://www.rsc.org/images/entities/char_2009.gif) :
:![[thin space (1/6-em)]](https://www.rsc.org/images/entities/char_2009.gif) 1.21 The pH plays an important role, not only on metal–chelates formation but also on DLLME performance, since the separation of metal ions by the microextraction procedure involves the previous formation of a complex with enough hydrophobicity to be extracted into a small volume of IL rich phase. Generally, little is known regarding the mechanisms involved during extraction of several solutes into ILs,14 and much less about phosphonium-type ILs. Acidic protons allow imidazolium cations to interact with solutes, either viahydrogen bonding interactions or with the aromatic nature of the ring system. Moreover, the high chemical affinity of imidazolium-based ILs to compounds with one or more aromatic rings in their structures (such as many complexing reagents) could be explained through CH–π hydrogen interactions between C2–H bonds of the imidazolium ring and the aromatic parts.22 On the other hand, tetraalkylphosphonium salts do not have such acidic protons or aromatic rings, and consequently there is little potential for interaction with solutes by the above mentioned mechanism.23 Therefore, extraction of solutes with phosphonium-ILs might be dominated by polarity affinity or through an ion-exchange phenomenon. As shown in Fig. 3, extraction efficiency (%) of Co increased following the order: PAN < 5-Br-PADAP < PAR. The optimum pH for Co chelation with PAR was observed within the interval of 3.5–5. Thus, a neutral species [CoIIIL(LH)], in equilibrium with anionic [CoIIIL2]− and cationic [CoIII(LH2)]+ species, is expected at the working pH,24 as it can be deduced from the dissociation constants of PAR (Table 1). On the other hand, the major species of 5-Br-PADAP and PAN reagents within the working pH range is neutral (LH) (Table 1). Consequently, a cationic species [CoIIIL2]+ is thus formed when Co is chelated with 5-Br-PADAP or PAN. Moreover, there are no reports suggesting extraction of positively charged molecules into CYPHOS® IL 101. Therefore, as expected, no improvement in Co extraction was obtained when 5-Br-PADAP or PAN acted as ligands. Thus, PAR was selected as chelating ligand, and samples and standards were adjusted at pH 4.8 before IL-DLLME procedure. The effect of PAR concentration on Co extraction was also evaluated. It was observed that Co extraction was enhanced by increasing the PAR concentration up to 1.7 × 10⁻⁵ mol L−1. No major changes were observed when higher concentrations were employed. Therefore, a concentration of 8.5 × 10⁻⁵ mol L−1 was selected for subsequent studies. With the aim of keeping a constant working pH that allows formation and stability of Co–PAR complex, an acetic/acetate buffer solution was selected. The possible influence of buffer concentration on Co extraction efficiency was studied in the range of 0–5.5 × 10⁻² mol L−1. Since Co extraction remained constant from a buffer concentration of 2.5 × 10⁻² mol L−1, this was chosen for further experiments.
1.21 The pH plays an important role, not only on metal–chelates formation but also on DLLME performance, since the separation of metal ions by the microextraction procedure involves the previous formation of a complex with enough hydrophobicity to be extracted into a small volume of IL rich phase. Generally, little is known regarding the mechanisms involved during extraction of several solutes into ILs,14 and much less about phosphonium-type ILs. Acidic protons allow imidazolium cations to interact with solutes, either viahydrogen bonding interactions or with the aromatic nature of the ring system. Moreover, the high chemical affinity of imidazolium-based ILs to compounds with one or more aromatic rings in their structures (such as many complexing reagents) could be explained through CH–π hydrogen interactions between C2–H bonds of the imidazolium ring and the aromatic parts.22 On the other hand, tetraalkylphosphonium salts do not have such acidic protons or aromatic rings, and consequently there is little potential for interaction with solutes by the above mentioned mechanism.23 Therefore, extraction of solutes with phosphonium-ILs might be dominated by polarity affinity or through an ion-exchange phenomenon. As shown in Fig. 3, extraction efficiency (%) of Co increased following the order: PAN < 5-Br-PADAP < PAR. The optimum pH for Co chelation with PAR was observed within the interval of 3.5–5. Thus, a neutral species [CoIIIL(LH)], in equilibrium with anionic [CoIIIL2]− and cationic [CoIII(LH2)]+ species, is expected at the working pH,24 as it can be deduced from the dissociation constants of PAR (Table 1). On the other hand, the major species of 5-Br-PADAP and PAN reagents within the working pH range is neutral (LH) (Table 1). Consequently, a cationic species [CoIIIL2]+ is thus formed when Co is chelated with 5-Br-PADAP or PAN. Moreover, there are no reports suggesting extraction of positively charged molecules into CYPHOS® IL 101. Therefore, as expected, no improvement in Co extraction was obtained when 5-Br-PADAP or PAN acted as ligands. Thus, PAR was selected as chelating ligand, and samples and standards were adjusted at pH 4.8 before IL-DLLME procedure. The effect of PAR concentration on Co extraction was also evaluated. It was observed that Co extraction was enhanced by increasing the PAR concentration up to 1.7 × 10⁻⁵ mol L−1. No major changes were observed when higher concentrations were employed. Therefore, a concentration of 8.5 × 10⁻⁵ mol L−1 was selected for subsequent studies. With the aim of keeping a constant working pH that allows formation and stability of Co–PAR complex, an acetic/acetate buffer solution was selected. The possible influence of buffer concentration on Co extraction efficiency was studied in the range of 0–5.5 × 10⁻² mol L−1. Since Co extraction remained constant from a buffer concentration of 2.5 × 10⁻² mol L−1, this was chosen for further experiments.
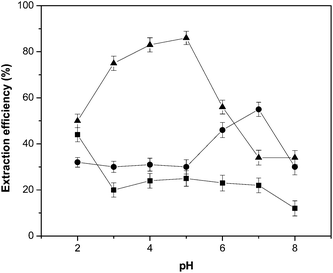 | ||
| Fig. 3 Effect of pH on Co extraction efficiency for different pyridylazo-type reagents (▲PAR; ■PAN; ●5-Br-PADAP). Other conditions were as indicated in Table 2. | ||
DLLME procedure selection
Different DLLME procedures were tested in order to achieve the highest Co recovery. Accordingly, ultrasound-assisted DLLME (USA-DLLME), CIAME and DLLME were evaluated. When USA-DLLME was attempted, a stable emulsion was formed, thus significantly increasing the time required for phase separation. On the other hand, CIAME technique is based on the formation of IL dispersion by changing the solvent solubility upon different temperatures. Relatively high temperatures (higher than 50 °C) were needed to dissolve the IL, leading to longer and unpractical cooling time needed for increasing IL viscosity and achieve efficient retention in the microcolumn of the FI system. When IL-based DLLME method was assayed, it was evidenced that relatively low volumes of organic solvent were necessary to obtain the IL phase dispersed. Moreover, a turbidity phenomenon was observed when CYPHOS® IL 101 was directly injected into an aqueous solution and agitated using a vortex stirrer, thus forming a dispersed IL phase. However, the use of an additional organic solvent was needed in order to achieve a reproducible dispersed IL phase, since diluting agents drastically decrease the viscosity of ILs, thus enhancing the reproducibility of analyte extraction in IL-DLLME.25 Different organic solvents including acetonitrile, acetone, ethanol and methanol were tested in this work. The analyte recovery was evaluated using 200 µL of each disperser solvent and 50 mg of CYPHOS® IL 101. The highest recovery was obtained with acetone and it was selected as disperser solvent for further experiments. The effect of the volume of acetone was studied over a range of 0–500 µL. It was observed that the extraction efficiency remained constant in the range of 100–250 µL, while a permanently stable cloudy solution was observed for higher volumes which negatively affected the retention of the IL phase in the microcolumn and Co recovery. Therefore, 100 µL of acetone were used as disperser solvent in this work.Ionic liquid load
Since extraction efficiency of the system can be remarkably affected by IL amount, it is highly important to establish the minimal quantity of CYPHOS® IL 101 that leads to total extraction of Co–PAR complex while achieving the highest analytical sensitivity. Recovery of Co upon different IL amount was examined within the range of 0–60 mg. The results revealed that the highest extraction efficiency was achieved with a minimal mass of 30 mg. Since 40 mg of IL was the maximum tolerable for Co determination on the graphite furnace, without significantly reducing analytical sensitivity, 35 mg IL (approx. 40 µL) were chosen for optimum extraction.Column manufacturing and online IL phase separation
As it was reported in a previous work,17 it was supposed that online retention of the IL phase could be performed due to the high viscosity of the IL CYPHOS® IL 101 at room temperature. Thus, an efficient retention of the IL phase by the FI system was conditioned by the best combination of loading flow rate, filling material, and microcolumn dimensions. Cotton, polyurethane foam, silica gel, XAD-16 resin or Florisil were tested as potentially suitable filtering materials of homemade columns for online retention of the dispersed IL phase. Florisil yielded the highest Co recovery among others and it was chosen to fill in the microcolumn. Comparing with silica gel and XAD-16 resin, the smaller particle size of Florisil could form a more compact filtering media, thus improving IL phase condensation and separation.17The length of the microcolumn was also considered in this study. It was observed that a minimal length of 10 mm was needed for total retention of IL microdrops. Shorter columns did not lead to good analyte recovery as IL droplets were not completely stopped by the filling material. On the other hand, an increase of column length did not enhance Co recovery and high back-pressure was generated within the FI system. Moreover, larger volumes of eluent were necessary for longer columns. Therefore, a 12 mm long column with a 2 mm inner diameter was chosen for best IL phase retention.
Sample flow rate is one of the most important variables which control the time of analysis in FI systems and determine the linear velocity of IL microdroplets through the microcolumn. This study was developed for loading flow rates ranging between 0.25 and 2.0 mL min−1. No major changes on the analytical response were observed up to 0.5 mL min−1, while it decreased at higher flow rates. This phenomenon could be better attributed to a filtering-like retention process of IL microdrops into the column, rather than a chemical one. Moreover, lower sample flow rates mean longer times into the mixing loop, thus allowing a better condensation of the IL phase. A flow rate of 0.5 mL min−1 was thus selected.
The extraction time was counted from the moment the IL dispersion was formed in aqueous phase until it arrived to the microcolumn for retention of IL microdrops. Although the extraction itself starts with the dispersion process in the tube, the length of the mixing loop defined most of the time of contact (extraction time) between the Co–PAR complex and the IL phase, and hence the extraction efficiency. The effect of loop length was studied within 12–210 cm (0.75 mm i.d.). The extraction efficiency was increased upon longer loops and reached a maximum at 70 cm. Lower Co recoveries were observed for shorter loops. This effect could be explained considering an insufficient time for total analyte extraction. A 74 cm loop was finally used.
Surfactant and salt effect
Due to the high viscosity of some ILs, one of the main drawbacks of using these solvents in FI systems is its partial adherence on the inner walls of Tygon® tubes. In order to overcome this issue, a common surfactant, Triton X-114, was added to the sample solution, thus forcing its sole retention into the microcolumn while reducing analyte scatter inside the whole FI system. Surfactant molecules surround the fine droplets of the IL, decreasing their interactions with the inner walls of FI lines and avoiding IL phase sticking.26 Moreover, the presence of surfactant helps to complete solubilization of the hydrophobic Co–PAR complex in aqueous solution.26 The effect of Triton X-114 on Co–PAR extraction and later IL phase retention into the microcolumn was studied between 0.025 and 0.3% (w/v). As shown in Fig. 4, 0.1% (w/v) Triton X-114 concentration yielded high extraction efficiency while facilitated the free running of IL droplets inside the lines. Higher surfactant concentrations led to insufficient retention into the microcolumn and low-reproducible results. Generally, salt addition in traditional liquid–liquid extraction using conventional organic solvents increases extraction performance due to salting out effect. This effect was investigated using NaClO4 in a concentration range of 0–6% (w/v). The extraction efficiency was strongly increased from 60% to more than 95% by increasing salt concentration up to 2%, and it remained constant up to 6%. Thus, a 2.4% (w/v) NaClO4 concentration was selected for subsequent experiments.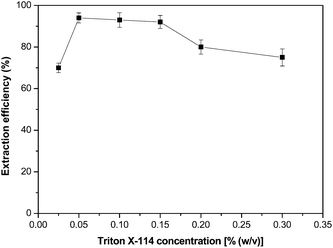 | ||
| Fig. 4 Effect of Triton X-114 concentration on Co selectivity and separation. Other conditions were as indicated in Table 2. | ||
Optimization of elution variables
In order to fully elute Co retained in the microcolumn, different types and amounts of organic eluents were evaluated. The selection of solvents was made based on CYPHOS® IL 101 solubility in these media.16 Thus, methanol, acetone, 10% (v/v) HNO3, methanol acidified with 10% (v/v) HNO3 and acetone acidified with 10% (v/v) HNO3 in volumes ranging from 60 to 100 µL were assayed for Co elution. The highest extraction efficiency was obtained when acidified acetone was applied. Quantitative elution of Co from the microcolumn was obtained with 100 µL of acidified acetone. Lower volumes turned out into incomplete analyte elution and a reduction of sensitivity, while larger volumes largely exceeded sample capacity of the graphite furnace. Acetone was acidified with HNO3 to induce dissociation of Co–PAR complex and further releasing of Co into eluent solution. Countercurrent flow through the microcolumn contributed to efficient elution by minimizing analyte dispersion.17With the aim of reducing the eluent volume and minimizing analyte dispersion when the eluate is delivered to the graphite furnace of the ETAAS instrument, the use of air-segmentation, which consists of sandwiching the eluate by air segments and transporting it into the graphite tube, was also applied.27 Furthermore, the elution was performed following a stopped-flow procedure filling the microcolumn with eluent solution and holding it for 0.5 min before injection into ETAAS. The eluate was injected into the graphite tube using an air stream at 0.25 mL min−1 for ETAAS analysis under conditions showed in Table 2.
Interferences
The possible effect of common coexisting ions was investigated. The experiments were developed at the concentration levels at which they may occur in the samples under study. A 5 µg L−1Co solution (2 mL) containing concomitant ions regularly found in these samples at different concentrations was analyzed following the recommended extraction procedure. Alkali and alkaline earth elements, commonly encountered concomitant ions, do not form stable complexes with PAR at the working pH.28 Thus, Cu2+, Zn2+, Ni2+, Mn2+ and Fe3+ could be tolerated up to at least 100 µg L−1. Additionally, their contribution to the ionic strength of the system was insignificant and did not affect the extraction efficiency. The analytical signal of the blank was not modified in the presence of the concomitant ions assayed.Analytical performance
An extraction efficiency of 95% was obtained when the procedure was performed under optimum experimental conditions (Table 2). The enrichment factor (EF), defined as the ratio of the calibration curve slopes for Co before and after the preconcentration step, was also evaluated.29 The obtained EF for a sample volume of 2 mL was 20. The relative standard deviation (RSD) resulting from the analysis of 10 replicates of 2 mL solution containing 1 µg L−1Co was 5.1%. The calibration graph was linear with a correlation coefficient of 0.9987 at levels near the detection limits and up to at least 7 µg L−1. The limit of detection (LOD), calculated based on the signal at intercept and three times the standard deviation about regression of the calibration curve,30 was 8 ng L−1 for the proposed methodology. The frequency of analysis was 10 samples per hour.Determination of Co in water samples and pharmaceutical formulations
The readily soluble fraction of metals is generally considered to be more available for plants.31 Thus, the concentration of soluble forms of Co in waters must be strictly controlled, as it enters food chain mainly via plants.2 However, the low levels (a few µg L−1)2 of Co usually found in these samples are not compatible with the LOD of ETAAS and a preconcentration step is required for proper determination. The results are shown in Table 4. A recovery study showed values for Co between 97.2 and 103.2%. Cobalt concentrations in river and tap water samples were not significantly different to those previously reported.32,33 Additionally, the accuracy of the proposed method was evaluated by analysing a certified reference material (CRM) of natural water NIST SRM 1643e, with a Co content of 27.06 ± 0.32 µg L−1. This CRM contains several ions commonly present in natural water samples. After a dilution factor of 10, employing the proposed methodology, the Co content found in the CRM was 27.53 ± 0.85 µg L−1 (95% confidence interval; n = 6).| Sample | Added/µg L−1 | Found/µg L−1 | Recoverya (%) | |
|---|---|---|---|---|
| a [(Found − base)/added] × 100. b Not detected. c Ringer-lactate physiological solution. d NaCl physiological solution. e Isotonic dextrose 5% physiological solution. | ||||
| Water | River water | 0 | 0.43 ± 0.01 | — |
| 1.00 | 1.39 ± 0.04 | 97.2 | ||
| 3.00 | 3.54 ± 0.18 | 103 | ||
| 6.00 | 6.51 ± 0.11 | 101 | ||
| Tap water | 0 | 0.55 ± 0.01 | — | |
| 1.00 | 1.56 ± 0.07 | 100 | ||
| 3.00 | 3.50 ± 0.13 | 98.5 | ||
| 6.00 | 5.51 ± 0.07 | 99.3 | ||
| Parenteral nutrition samples | 1c | 0 | n.d.b | — |
| 1.00 | 1.00 ± 0.04 | 100 | ||
| 5.00 | 4.97 ± 0.04 | 99 | ||
| 2d | 0 | n.d.b | — | |
| 1.00 | 1.03 ± 0.04 | 103 | ||
| 5.00 | 4.94 ± 0.06 | 98.8 | ||
| 3e | 0 | n.d.b | — | |
| 1.00 | 0.98 ± 0.03 | 97.9 | ||
| 5.00 | 5.06 ± 0.10 | 101 | ||
| Ophthalmic solution samples | 1 | 0 | n.d.b | — |
| 1.00 | 0.98 ± 0.03 | 98.1 | ||
| 5.00 | 5.09 ± 0.10 | 102 | ||
| 2 | 0 | n.d.b | — | |
| 1.00 | 1.03 ± 0.04 | 103 | ||
| 5.00 | 5.08 ± 0.15 | 102 |
The proposed method was also applied to the determination of Co in parenteral and ophthalmic solutions. Three portions of sample were analyzed with the proposed analytical method and the mean Co concentration of each sample was taken as a base value. Then, increasing quantities of Co were added to the other aliquots and the same procedure was followed. The results are shown in Table 4. The recovery of Co was between 97.9 and 103%. To our knowledge, there have been no reports demonstrating the viability of performing an IL-based microextraction technique in these kinds of samples.
Conclusions
The main benefit of using the online FI system is its suitability to work with ILs that have lower density than aqueous media, which is normally a major limitation in regular L–L microextraction-based procedures. Since analyte extraction and final separation of the IL droplets completely took place in an online FI system, the developed online procedure reduces manual operation and contamination risks, simplifying DLLME technique. In fact, our method could be fully automated as it only involves addition and mixing of reagents. In this way, implementation of ILs in online procedures opens up an attractive alternative for development of fully automated separation and preconcentration procedures. Furthermore, multielemental analysis is feasible with the method by selecting the right working pH which leads to simultaneous complexes formation with different elements.The proposed method presents a detection limit that is comparable to, or better than, other methodologies developed for total Co determination (Table 5), and has a good calibration range with a reduced amount of sample. Moreover, our method allowed reliable and accurate determination of Co in environmental and pharmaceutical samples, showing the possibility of using IL-based microextraction techniques for analysis of complex samples, with high salt concentration. Therefore, the method could be of key interest especially for routine analytical laboratories.
| Method | LOD/ng L−1 | RSD (%) | Sample consumption/mL | Calibration range/µg L−1 | Analysis frequency/h−1 | Ref. |
|---|---|---|---|---|---|---|
| a Not available. b FAAS: flame atomic absorption spectrometry; SFO: solidification of floating organic drop; ICP-OES: inductively coupled plasma-optical emission spectrometry; FO-LADS: fiber optic-linear array detection spectrophotometry. | ||||||
| DLLME-FAAS | 900 | 2.3–5.8 | 5 | 3–100 | n.a.a | 35 |
| DLLME-SFO-ICP-OES | 200 | 3.4 | 20 | 1.25–250 | n.a.a | 36 |
| DLLME-FO-LADS | 200 | <4 | 10 | 1–70 | n.a.a | 37 |
| CIAME-FO-LADS | 140 | 2.32 | 10 | 1.5–65 | n.a.a | 38 |
| IL-SDME-ETV-ICP-MS | 1.5 | 7.7 | 1.5 | 0.01–50 | 6 | 39 |
| IL-DLLME-ETAAS | 3.8 | 3.4 | 6 | 0.038–3.5 | n.a.a | 33 |
| IL-DLLME-FAAS | 700 | 2.36 | 25 | 2–166 | n.a.a | 40 |
| Online IL-DLLME-ETAAS | 8 | 5.1 | 2 | 0.080–7 | 10 | Proposed method |
Acknowledgements
This work was supported by Consejo Nacional de Investigaciones Científicas y Técnicas (CONICET), Agencia Nacional de Promoción Científica y Tecnológica (FONCYT) (PICT-BID) and Universidad Nacional de Cuyo (Argentina).References
- R. E. Sturgeon, Spectrochim. Acta, Part B, 1997, 52, 1451 CrossRef.
- Handbook of Elemental Speciation II—Species in the Environment, Food, Medicine and Occupational Health, ed. R. Cornelis, John Wiley & Sons, Ltd, Chichester, 1st edn, 2005 Search PubMed.
- D. Lison, in Handbook on the Toxicology of Metals, ed. G. F. Nordberg, B. A. Fowler, M. Nordberg and L. T. Friberg, Academic Press Inc., 3rd edn, 2007, pp. 511–528 Search PubMed.
- F. Y. Leung, Clin. Biochem., 1995, 28, 561 CrossRef CAS.
- M. A. Crook, Nutrition, 2001, 17, 683 CrossRef CAS.
- R. Nageswara Rao and M. V. N. Kumar Talluri, J. Pharm. Biomed. Anal., 2007, 43, 1 CrossRef CAS.
- A. R. Timerbaev, TrAC, Trends Anal. Chem., 2009, 28, 416 CrossRef CAS.
- M. C. Hsiang, Y. H. Sung and S. D. Huang, Talanta, 2004, 62, 791 CrossRef CAS.
- T. Sakai and N. Teshima, Anal. Sci., 2008, 24, 855 CrossRef CAS.
- J. Wang and E. H. Hansen, TrAC, Trends Anal. Chem., 2005, 24, 1 CrossRef CAS.
- E. V. Alonso, A. García De Torres and J. M. C. Pavón, Talanta, 2001, 55, 219 CrossRef CAS.
- D. Han and K. H. Row, Molecules, 2010, 15, 2405 Search PubMed.
- Y. Wang, M. L. Chen and J. H. Wang, Appl. Spectrosc. Rev., 2007, 42, 103 CrossRef CAS.
- E. M. Martinis, P. Berton, R. P. Monasterio and R. G. Wuilloud, TrAC, Trends Anal. Chem., 2010, 29, 1184 CrossRef CAS.
- M. Rezaee, Y. Yamini and M. Faraji, J. Chromatogr., A, 2010, 1217, 2342 CrossRef CAS.
- K. J. Fraser and D. R. MacFarlane, Aust. J. Chem., 2009, 62, 309 CrossRef CAS.
- P. Berton, E. M. Martinis and R. G. Wuilloud, J. Hazard. Mater., 2010, 176, 721 CrossRef CAS.
- P. Kilaru, G. A. Baker and P. Scovazzo, J. Chem. Eng. Data, 2007, 52, 2306 CrossRef CAS.
- A. E. Visser, R. P. Swatloski, S. T. Griffin, D. H. Hartman and R. D. Rogers, Sep. Sci. Technol., 2001, 36, 785 CrossRef CAS.
- T. Ying, L. Zaijun, Z. Juan and P. Jiaomai, Rev. Anal. Chem., 2005, 24, 103 Search PubMed.
- K. L. Cheng, K. Ueno and T. Imamura, Handbook of Organic Analytical Reagents, CRC Press, USA, 2nd edn, 1992 Search PubMed.
- C. C. Cassol, A. P. Umpierre, G. Ebeling, B. Ferrera, S. S. X. Chiaro and J. Dupont, Int. J. Mol. Sci., 2007, 8, 593 CrossRef CAS.
- C. J. Bradaric, A. Downard, C. Kennedy, A. J. Robertson and Y. Zhou, Green Chem., 2003, 5, 143 RSC.
- K. Mochizuki, T. Imamura, T. Ito and M. Fujimoto, Chem. Lett., 1976, 5, 1207 CrossRef.
- K. R. Seddon, A. Stark and M. J. Torres, Pure Appl. Chem., 2000, 72, 2275 CrossRef CAS.
- M. Baghdadi and F. Shemirani, Anal. Chim. Acta, 2008, 613, 56 CrossRef CAS.
- M. Burguera and J. L. Burguera, Spectrochim. Acta, Part B, 2007, 62, 884 CrossRef.
- G. Chakrapani, D. S. R. Murty, P. L. Mohanta and R. Rangaswamy, J. Geochem. Explor., 1998, 63, 145 CrossRef CAS.
- Z. Fang, Flow Injection Separation and Preconcentration, VCH, Weinheim, 1st edn, 1993 Search PubMed.
- J. N. Miller and J. C. Miller, Statistics and Chemometrics for Analytical Chemistry, Prentice Hall, Harrow, England, 5th edn, 2005 Search PubMed.
- X. P. Wang, X. Q. Shan, S. Z. Zhang and B. Wen, Chemosphere, 2004, 55, 811 CrossRef CAS.
- V. N. Bulut, A. Gundogdu, C. Duran, H. B. Senturk, M. Soylak, L. Elci and M. Tufekci, J. Hazard. Mater., 2007, 146, 155 CrossRef CAS.
- P. Berton and R. G. Wuilloud, Anal. Chim. Acta, 2010, 662, 155 CrossRef CAS.
- D. A. Johnson and T. M. Florence, Talanta, 1975, 22, 253 CrossRef CAS.
- P. X. Baliza, L. S. G. Teixeira and V. A. Lemos, Microchem. J., 2009, 93, 220 CrossRef CAS.
- Y. Yamini, M. Rezaee, A. Khanchi, M. Faraji and A. Saleh, J. Chromatogr., A, 2010, 1217, 2358 CrossRef CAS.
- N. Shokoufi, F. Shemirani and Y. Assadi, Anal. Chim. Acta, 2007, 597, 349 CrossRef CAS.
- M. Gharehbaghi, F. Shemirani and M. D. Farahani, J. Hazard. Mater., 2009, 165, 1049 CrossRef CAS.
- L. Xia, X. Li, Y. Wu, B. Hu and R. Chen, Spectrochim. Acta, Part B, 2008, 63, 1290 CrossRef.
- H. Abdolmohammad-Zadeh and E. Ebrahimzadeh, Cent. Eur. J. Chem., 2010, 8, 617 Search PubMed.
| This journal is © The Royal Society of Chemistry 2011 |
