Oil fingerprinting analysis using commercial solid phase extraction (SPE) cartridge and gas chromatography-mass spectrometry (GC-MS)
Zeyu
Yang
ab,
Chun
Yang
*a,
Zhendi
Wang
a,
Bruce
Hollebone
a,
Mike
Landriault
a and
Carl E.
Brown
a
aEmergencies Science and Technology Section, Environment Canada, Ottawa, ON, Canada. E-mail: chun.yang@ec.gc.ca; Fax: +1 613 991 9485; Tel: +1 613 991 1120
bCollege of Chemistry and Materials, South-Central University for Nationalities, Wuhan, China
First published on 2nd February 2011
Abstract
This study used solid phase extraction (SPE) cartridges for rapid cleanup and fractionation of oil samples in oil fingerprinting analysis. A series of commercially available florisil cartridges, normal phase SPE cartridges, and silica gel/cyanopropyl (SiO2/C3-CN) SPE cartridges was selected for the fractionation of oil into aliphatic and aromatic hydrocarbons. The florisil cartridges and normal phase SPE cartridges can clean up the oil samples but are unable to separate them into two fractions. The SiO2/C3-CN (1 g/0.5 g) SPE cartridge successfully separated oil samples into aliphatic and aromatic fractions by eluting with 4 mL of hexane and 4 mL of dichloromethylene (DCM)/hexane (3![[thin space (1/6-em)]](https://www.rsc.org/images/entities/char_2009.gif) :1, v:v), respectively. No cross-elution was observed between aliphatic and aromatic fractions when oil loading mass was less than 40 mg on the SiO2/C3-CN SPE cartridge. The relative standard deviation (RSD) of five replicates of SPE-GC-MS analysis of 5 mg of reference oil is 2.8%, 1.2%, and 6.9% for total n-alkanes, polycyclic aromatic hydrocarbons (PAHs), and biomarkers, respectively. The recoveries of six spiked deuterated surrogates were all above 95%. This SPE-GC-MS method was used for the fingerprinting analysis of various crude oils, refined petroleum products, and environmental sediment samples. The characterized target hydrocarbons included n-alkanes, unsubstituted priority PAHs and alkylated homologues, and biomarker terpanes and steranes. The concentration profiles and diagnostic ratios of target compounds are both comparable to those obtained by the conventional silica gel column-GC-MS method.
:1, v:v), respectively. No cross-elution was observed between aliphatic and aromatic fractions when oil loading mass was less than 40 mg on the SiO2/C3-CN SPE cartridge. The relative standard deviation (RSD) of five replicates of SPE-GC-MS analysis of 5 mg of reference oil is 2.8%, 1.2%, and 6.9% for total n-alkanes, polycyclic aromatic hydrocarbons (PAHs), and biomarkers, respectively. The recoveries of six spiked deuterated surrogates were all above 95%. This SPE-GC-MS method was used for the fingerprinting analysis of various crude oils, refined petroleum products, and environmental sediment samples. The characterized target hydrocarbons included n-alkanes, unsubstituted priority PAHs and alkylated homologues, and biomarker terpanes and steranes. The concentration profiles and diagnostic ratios of target compounds are both comparable to those obtained by the conventional silica gel column-GC-MS method.
Introduction
Oil spills occur frequently worldwide and has the potential to cause extensive damage to ecosystems and to affect human health. It is extremely important to accurately characterize spilled oils and identify spill sources in order to select an appropriate spill response, take effective cleanup measures, and assess potential environmental impacts. Successful oil fingerprinting usually involves appropriate strategies for sample preparation, analytical approach, and data interpretation. Forensic oil spill identification has largely relied on elaboration of the individual source-specific petroleum hydrocarbons.1,2Gas chromatography-flame ionization detection (GC-FID) and GC-MS were proven to be the most appropriate techniques for identifying and quantifying petroleum hydrocarbons in crude oil and refined petroleum products.2 Due to the complex nature of petroleum fuel, however, proper sample preparation is essential in order to achieve accurate quantification of individual components and unbiased identification of the spill source.3 Various procedures for the fractionation of petroleum into aliphatic, aromatic, and other hydrocarbon groups were reported in previous research.3–5 These procedures include column liquid chromatography with various adsorbents, such as silica gel,4–8alumina,3,9 a combination of silica and alumina,10–12 thin layer chromatography (TLC),13,14 and high performance liquid chromatography (HPLC).15 These methods are often complicated and time-consuming, however, because they generally require pre-treatment, cleaning, preparation, and activation adsorbent packing materials. This work may need to be conducted with precision and accuracy by highly trained personnel. In addition, large volumes of high purity solvents are necessary for each chromatographic or partitioning step.
Solid phase extraction (SPE) is a well established technique used to analyze many different classes of compounds in a variety of matrixes. To meet the need for rapid oil fingerprinting analysis, particularly in emergency spill incidents, commercial SPE cartridges might be a possible alternative for developing a rapid, inexpensive, and reproducible method. The SPE technique was recently used to improve fractionating of petroleum fuel due to its selectivity, faster elution profile, and minimization of solvent consumption.16–18
To date, there are few published studies on the use of commercially available SPE cartridges for fast oil fingerprinting analysis. Alzaga et al.16 reported a successful attempt using commercial SPE cartridges for oil analysis. This technique is worthy of continual exploration to optimize the operational conditions and to evaluate their applicability for fingerprinting analysis of oils in environmental matrices. In this study, a number of commercially available SPE cartridges with different adsorbents from low to high polarity were evaluated for fractionating oil samples. The disposable SPE cartridges packed with silica and cyanopropyl (SiO2/C3-CN) adsorbents are applied to separate aliphatic and aromatic hydrocarbons in environmental sediments, crude oils and refined petroleum products. Operational conditions such as elution solvent, elution volume, and loading capacity were evaluated for the selected SPE cartridges. The quantitative data for two crude oils, three refined petroleum products ranging from light to heavy, and two environmental sediments were compared with data obtained from the conventional adsorption chromatography method developed and used in our laboratory.7
Experimental
Chemicals and materials
UPTI-Clean silica/cyanopropyl SPE cartridges (SiO2/C3-CN, 1 g/0.5 g, 6 mL) were purchased from Interchim Inc. (San Pedro, CA, USA). Superclean LC-florisil SPE cartridges (1 g, 6 mL and 5 g, 20 mL), 1g, 6 mL of Supelco Discovery SPE cartridges (DSC) with normal phases, including DSC/NH2 (polymerically bonded, aminopropyl phase), DSC/Diol (polymerically bonded, 2, 3-dihydroxypropoxypropyl, 7%C), DSC/CN (monomerically bonded, cyanopropyl, 7%C) and DSC/Si (unbonded acid-washed silica sorbent) were obtained from Supelco (Bellefonte, PA, USA).Silica gel (100 to 200 mesh, 150 Å, pore 1.2 cm2 g−1, active surface 320 m2 g−1) was obtained from Sigma-Aldrich (Milwaukee, WI, USA). The solvents used were purchased from Caledon (Georgetown, ON, Canada) at the highest purity available and used without further purification.
Normal alkane and PAH calibration standard mixtures were both purchased from Restek (Bellefonte, PA, USA). Deuterated surrogates ([2H50] tetracosane, [2H8] naphthalene, [2H10] acenaphthene, [2H10] phenanthrene, [2H12] benzo[α]anthracene, and [2H12] perylene) and PAH internal standard of [2H14] terphenyl were all purchased from Supelco (Bellefonte, PA, USA). Biomarker terpane and sterane standards were obtained from Chiron (Trondheim, Norway).
The well characterized Prudhoe Bay crude oil (Alaska, USA, 13.1% weathered)19 was used as a reference oil for method development in this study. Oil samples studied were obtained from various sources by the Emergencies Science and Technology Section (ESTS) of Environment Canada. The crude oils studied are the Mississippi Canyon crude oil (API = 27.5, Gulf of Mexico) and Cold Lake Bitumen (API = 9.68, Alberta, Canada). The refined products selected include one No. 2 diesel fuel (purchased from a gas station in Ottawa, Canada), one heavy residual fuel (IFO 180), and one lubricating oil (Valvoline Lube-2003-10w–30, motor oil, Ottawa). Sediment samples studied were collected from Syncrude oil sands tailing ponds in Alberta, Canada.
Sample preparation
The SPE cartridges were attached to a 12-port Visiprep™ SPE Vacuum Manifold (<20 mmHg vacuum, Bellefonte, PA, USA) with disposable liners to eliminate the possibility of cross-contamination and maintain reproducible extractions by controlling the flow rate of eluents. The cartridges were pre-conditioned with 2 × 5 mL of hexane prior to use. Approximately 8 mg of oil dissolved in hexane was spiked with appropriate concentrations of surrogates [C24D50 for n-alkanes analysis, o-terphenyl for total petroleum hydrocarbons (TPH) analysis, and five deuterated PAHs for PAH analysis]. This mixture was loaded on the cartridge with vacuum by keeping the flow rate of eluent close to 1.5 mL min−1 and followed by sequentially eluting with 4 mL of hexane and 4 mL of hexane/dichloromethylene (DCM) mixture (3:1, v:v).
Conventional column cleanup and fractionation procedures followed the oil micro-column fractionation technology developed in our ESTS Oil Research Lab.7 A chromatographic column (200 × 10.5 mm I.D.) packed with 3-g silica gel was preconditioned with about 20 mL of hexane. Approximately 16 mg of oil samples dissolved in hexane and spiked with surrogates were loaded into the column and eluted using the following solvents: hexane (12 mL) was used to elute aliphatic hydrocarbons (F1) and a 15-mL mixture of hexane and DCM (1:1, v:v) was used to elute aromatic hydrocarbons (F2).
Aliquots (0.9 mL) of the hexane fraction (F1, final volume of 4 mL) and hexane–DCM fraction (F2, final volume of 4 mL) obtained from SPE cartridges and conventional silica gel column were spiked with appropriate internal standards (including 5α-androstane, [2H14] o-terphenyl and C30-ββ-hopane) and directly injected to the GC/FID and GC-MS for the analysis of TPH and aliphatic and aromatic hydrocarbons, respectively.
GC analysis
Analyses for TPHs were performed on an Agilent 6890 gas chromatograph equipped with an FID system and an Agilent 7683 auto sampler. Characterizations of the distribution of individual n-alkanes, PAHs, and petroleum biomarkers were performed on an Agilent 7890A GC system interfaced to an Agilent 5975C mass spectrometer. The column used was the HP-5 capillary fused silica column (30 m × 0.25 mm I.D., 0.25 μm film thickness).GC-FID analysis provides a baseline resolution of n-alkanes from n-C8 to n-C40. Quantization of TPHs was based on the internal standard compound (5-α-androstane). GC-MS analysis was performed using a selected ion monitoring (SIM) mode to improve detection limits. The concentrations of the individual n-alkanes, PAHs, and biomarker compounds were determined based on the internal standards 5α-androstane, [2H14] o-terphenyl, and C3017β(H),21β(H)-hopane, respectively. Detailed chromatographic conditions and temperature programs, analysis quality control, and quantification methodology are as described in Wang et al.7,20
Results and discussion
Selection of SPE cartridges for fractionation of aliphatic and aromatic hydrocarbons in oils
SPE cartridges tested in this study include commercially available SPE cartridges packed with different adsorbents (1 g of florisil, 5 g of florisil, 1 g of SiO2/0.5 g of C3-CN, 1 g of DSC/NH2, 1 g of DSC/Diol, 1 g of DSC/CN, and 1 g of DSC/Si). Eight milligrams of the reference oil spiked with surrogates was loaded on to these SPE cartridges and used to evaluate the SPE capabilities of separating aliphatic from aromatic hydrocarbons in oil samples.The selected ion chromatograms of n-alkanes (m/z 85), naphthalene (m/z 128) and alkylated naphthalenes (m/z 142, 156, 170, and 184) for several selective commercial SPE cartridges are shown in Fig. 1 (a–d). Only low molecular weight (MW) PAHs and their alkylated homologues are plotted in Fig. 1 because they are more easily coeluted with alkanes than those medium and heavy MW PAHs.
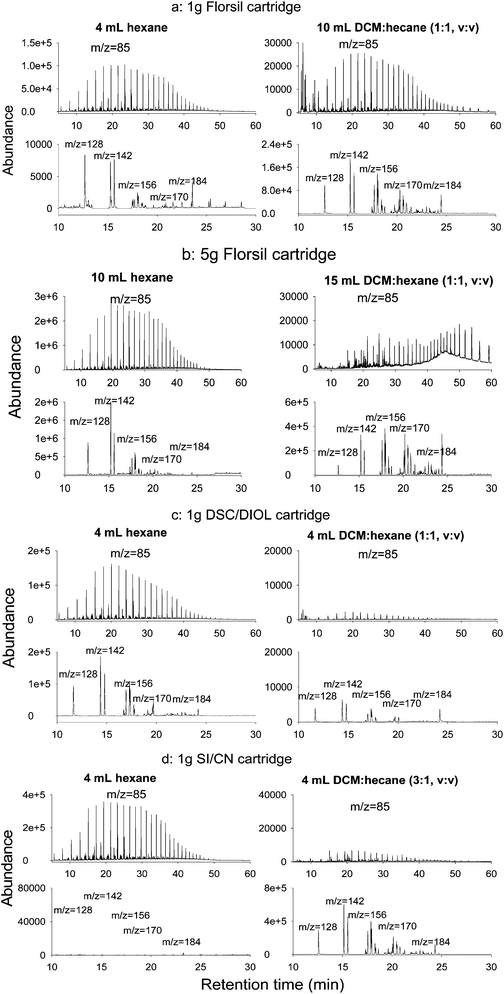 | ||
| Fig. 1 Fractionation efficiency of representative n-alkanes and PAHs using different SPE cartridges. | ||
Using the 1-g florisil SPE cartridge, 4 mL of hexane can not completely separate all the aliphatic hydrocarbons from unsubstituted PAHs and their alkylated homologues [about 20% of aliphatic hydrocarbons were detected in the 10 mL fraction of the DCM–hexane mixture (1:1, v:v)]. It was noted that low MW naphthalene and 2-/1-methyl naphthalene) were detected even in the first 4-mL hexane fraction (Fig. 1a). When the 5-g florisil SPE cartridge was used (Fig. 1b), about 99% of the aliphatic hydrocarbons can be eluted by 10 mL of hexane, but 60% to 90% of the naphthalene and methyl naphthalene were coeluted with aliphatic hydrocarbons in this fraction. Clearly, the selectivity of florisil cartridges is rather limited, especially for low MW PAHs (e.g., naphthalene and its alkylated homologues). Although it is possible to achieve a satisfied separation between aliphatic and aromatic hydrocarbons by adjusting the elution volume of hexane using 5-g florisil SPE cartirdge, a large amount of solvent is needed to be used in this scenario.
The cross-elution of aliphatic and aromatic hydrocarbons was observed for all Supelco Discovery normal phase SPE cartridges. The chromatograms for selective ions (m/z 85 for n-alkanes and m/z 128, 142, 156, 170, and 184 for naphthalene and its alkylated homologues) in the 1-g DSC/Diol cartridge were selected as a representative for all these normal phases (Fig. 1c). It can be seen that, while 4 mL of hexane eluted out about 99% of the aliphatic hydrocarbons, most of the naphthalene and its alkylated homologues were coeluted with the aliphatic fraction. Only about 5% of them were left in the fraction of the DCM–hexane (1:1, v:v) mixture.
Alzaga et al.16 reported that the SiO2/C3-CN cartridge exhibited a better ability to resolve aliphatic and aromatic hydrocarbons from petroleum oil than commercial SPE cartridges with SiO2 and cyanopropyl adsorbents. For the SiO2/C3-CN cartridge, 4 mL of hexane eluted out about 99% of the aliphatic hydrocarbons and no coeluted aromatic compounds were detected in this fraction (Fig. 1d), similar with the findings by Alzaga et al.16 Alzaga et al.16 used 4.5 mL of the DCM–hexane mixture (1:1, v:v) to elute nearly 100% of PAH loaded on a SiO2/C3-CN cartridge. However, in our experiment over 6 mL of DCM–hexane mixture (1:1, v:v) was needed to elute PAH compounds (Fig. 2). In order to reduce the elution volume, aromatic hydrocarbons were nearly completely eluted out with the subsequent 4 mL of the DCM–hexane mixture (3:1, v:v). The following section will focus on discussion of fractionation parameters of the SiO2/C3-CN cartridge.
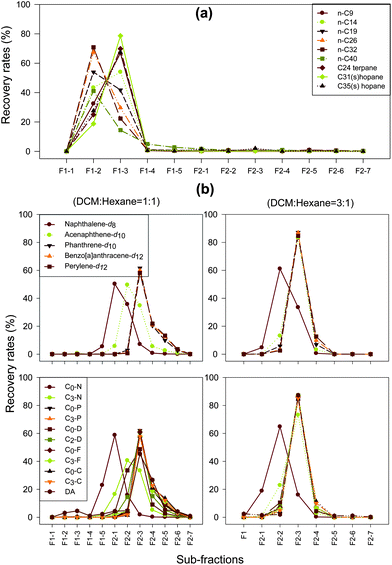 | ||
| Fig. 2 Elution profiles of selected target compounds at different sub-fractions using 1-g SiO2/0.5-g C3-CN cartridge. | ||
Evaluation of fractionation parameters for SiO2/C3-CN cartridge
One important criterion to evaluate the performance of a solvent is whether the solvent has the ability to extract maximum amount of analyte with a minimum volume while introducing minimum background interferences. Based on the “similar dissolves similar” principle, non-polar n-hexane was selected as the solvent for elution of non-polar aliphatic hydrocarbons in the F1 fraction using the SiO2/C3-CN cartridge.For evaluation of the solvent fractionation efficiency, five 1-mL aliquots of hexane were used to elute the aliphatic fraction. These eluents were designated as the sub-fractions F1–1 to F1–5, respectively. Similarly, seven 1-mL aliquots of the DCM–hexane mixture with volume ratios of 1:1 and 3:1 were then used to elute the PAH fraction. These eluents were designated as the sub-fractions F2−1 to F2–7, respectively. The recovery rates of the analytes were plotted against different sub-fractions to determine the proper elution solvent and volume in total (Fig. 2).
The elution profiles for several representative aliphatic hydrocarbons (ranging from n-C9 to n-C40) are shown in Fig. 2a. It can be seen that aliphatic hydrocarbons were nearly absent in the first 1 mL of the hexane sub-fraction (F1–1), while most of them were eluted out at the sub-fractions of F1–2 and F1–3,. The aliphatic hydrocarbons in sub-fractions F1–4 and F1–5 only account for less than 1% of the total detected aliphatic compounds. The long chain hydrocarbon of n-C40 is more difficult to elute, with 5% and 2.7% being detected in F1–4 and F1–5, respectively. The aliphatic hydrocarbons recovered in the F2 fraction series are less than 1% of the total aliphatic hydrocarbons; while 23% of naphthalene, 8% of 2-/1-methylnaphthalene, and 2% of C3-naphthalene were determined in aliphatic sub-fraction F1–5 (Fig. 2b). Four mL of hexane was, therefore, selected as the optimal elution volume for fractionation of aliphatic from aromatic hydrocarbons.
Polycyclic aromatic hydrocarbons (PAHs), which are mid-polar compounds, generally have higher polarity than non-polar aliphatic hydrocarbons. Solvents with higher polarity (the DCM–hexane or DCM–benzene mixture) are generally used to elute PAHs in the normal phase liquid chromatography (e.g., silica gel column).21Fig. 2b shows the elution profiles of several 2-ring to 5-ring PAHs and their corresponding alkylated homologues with the elution of two DCM–hexane (1:1, v:v) and DCM–hexane (3:1, v:v) mixtures. When the mixture of DCM–hexane (1:1, v:v) was used, about 60% of naphthalene was detected in the F2−1 fraction, most of other PAHs were eluted with ratios ranging from 20% to 60% in the sub-fractions F2–2 to F2–4, and less than 15% and 4% of them were eluted out in the sub-fractions F2–5 and F2–6, respectively (Fig. 2b, left panel). Therefore, 6 mL of the DCM–hexane mixture with a volume ratio of 1:1 was selected to elute PAHs.
When the proportion of DCM in the eluent was increased to DCM–hexane (3:1, v:v), less solvent was used (Fig. 2b, right panel). About 19% of the naphthalene was found in the sub-fraction F2−1, 23% to 65% of naphthalene and its alkylated homologues were found in the sub-fraction F2–2, and more than 85% of other PAHs were eluted out in the sub-fraction F2–3. The remaining 11% of PAHs were eluted in F2–4. PAHs detected in F2–5, F2–6, and F2–7 are negligible. Overall, the eluent volume can be reduced to 4 mL using DCM–hexane at a ratio of 3:1 (v:v) compared with 6 mL of DCM–hexane at a ratio of 1:1 (v:v) to elute 99% of total aromatic hydrocarbons. In addition, the 4 mL of eluent was used directly to analyze aromatics by GC-MS or GC/FID without further solvent evaporation, which will significantly reduce the sample preparation time while achieve similar performance as the conventional silica gel column technique does.
Loading capacity of SiO2/C3-CN cartridge
The maximum separation amount of target compounds in samples depends on the capacity of the sorbent bed and the nature of the sample loaded. When the SPE cartridge is overloaded, the cross-elution of aliphatic and aromatic hydrocarbons will be observed. In order to examine the column-loading capacity and to avoid cross-elution of aliphatic and aromatic compounds, increasing quantities of the reference oil (2, 4, 6, 8, 10, 12, 20, and 40 mg) were loaded on to the SiO2/C3-CN SPE cartridges and fractionated into aliphatic and aromatic fractions using 4 mL of n-hexane and 4 mL of DCM–hexane (3:1, v:v), respectively.
The concentrations of aliphatic hydrocarbons and PAHs were measured to find the loading capacity of the SiO2/C3-CN SPE cartridges. Fig. 3 shows the plots of the oil mass against concentrations of selected target hydrocarbons. It is obvious that the measured concentration of all representative analytes normally increases linearly with the loading amount (from 2 to 40 mg) using the SiO2/C3-CN commercial SPE cartridge, the linear fitting results indicate that the square of correlation coefficients are ranged from 0.53 to 0.99. In consideration of the content of target compounds in oils and the instrumental detection limits of the GC-MS, 5 to 10 mg of oil sample was found to be the appropriate loading amount for obtaining high fractionation efficiency.
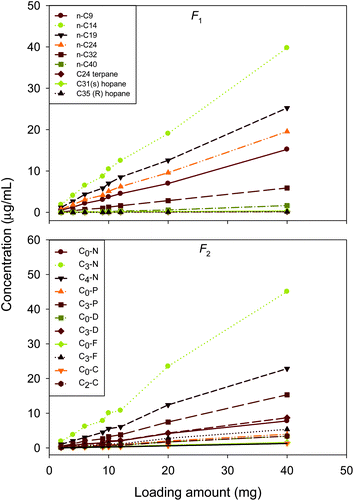 | ||
| Fig. 3 Loading capacity test of 1-g SiO2/0.5-g C3-CN cartridge. | ||
Method detection limits (MDLs), precision and accuracy
The method detection limits (MDLs) were measured by seven replicate analyses using the solutions of n-alkanes and PAH standard compounds. The concentrations of spiked standard compounds were about 3 times the instrumental detection limits (estimated from signal-to-noise ratio of 3) using GC-MS in selected ion monitoring mode. All samples were fractionated with a 1-g SiO2/C3-CN SPE cartridge and at the established fractionation conditions. The MDL (Table 1) was determined by multiplying the standard derivation by the value of tf, 0.99 (t = 3.14, n = 7). As seen in Table 1, the MDL values were determined to be 48 to 207 ng g−1 and 1.2 to 15 ng g−1 for individual n-alkanes and PAH compounds, respectively.| Compounds | MDL (ng g−1, n = 7)a | RSD (%, n = 5)b |
|---|---|---|
| a Data were obtained from n-alkane and PAH standards with seven replicate analysis. b data were obtained from 5 mg of Prudhoe Bay crude oil with 5 replicated analysis. c NA: not available. | ||
| n-C9 | 207 | 1.8 |
| n-C10 | 105 | 2.9 |
| n-C12 | 76 | 2.5 |
| n-C14 | 106 | 2.4 |
| n-C16 | 117 | 2.3 |
| n-C18 | 148 | 2.6 |
| n-C20 | 124 | 2.8 |
| n-C22 | 92 | 2.8 |
| n-C24 | 173 | 3.5 |
| n-C26 | 166 | 7.7 |
| n-C28 | 160 | 8.5 |
| n-C30 | 142 | 7.8 |
| n-C32 | 119 | 16.5 |
| n-C34 | 62 | 11.7 |
| n-C36 | 48 | 14.2 |
| Naphthalene (C0–N) | 3.1 | 7.9 |
| 2-Methylnaphthalene | 3.5 | 6.5 |
| 1-Methylnaphthalene | 4.6 | 6.4 |
| 2, 6-Diemthylnaphthalene | 1.2 | 6.0 |
| 2, 3, 5-Trimethylnaphthalene | 3.6 | 6.1 |
| Fluorene (C0–F) | 4.2 | 7.2 |
| Dibenzothiophene (C0-D) | 3.9 | 7.6 |
| Phenanthrene (C0–P) | 5.0 | 7.4 |
| 1-Methylphenanthrene | 5.9 | 8.2 |
| Chrysene (C0–C) | 3.4 | 12.6 |
| Biphenyl (Bph) | 3.8 | 6.4 |
| Acenaphthylene (Acl) | 2.2 | NAc |
| Acenaphthene (Ace) | 15 | 8.6 |
| Anthracene (An) | 4.9 | 7.4 |
| Fluoranthene (Fl) | 4.7 | 15.6 |
| Pyrene (Py) | 6.2 | 9.5 |
| Benzo[a]anthracene (BaA) | 4.2 | 39.6 |
| Benzo[b]fluoranthene (BbF) | 6.3 | 22.8 |
| Benzo[k]fluoranthene (BkF) | 2.8 | NA |
| Benzo[e]pyrene (BeP) | 2.7 | 15.9 |
| Benzo[a]pyrene (BaP) | 4.7 | 23.3 |
| Perylene (Pe) | 6.6 | 15 |
| Indeno[1,2,3-cd]pyrene (IP) | 3.6 | 18 |
| Dibenzo[a,h]anthrance (DA) | 5.4 | 17.2 |
| Benzo[g,h,i]perylene (BgP) | 4.8 | 24.1 |
The repeatability and accuracy of the method were evaluated by five replicate analyses of 5 mg of the Prudhoe Bay reference oil spiked with appropriate surrogates. The relative standard deviations (RSD) were determined to be 1.8% to 16.5% and 6.0% to 39.6% for analyzed alkanes and PAHs (Table 1), respectively. The mean RSDs (%, n = 5) for total target n-alkanes, PAHs, and biomarkers are 2.8%, 1.2%, and 6.9%, respectively. The recoveries for all surrogates ranged from 80.5% to 95.1%. These results indicate that the developed method exhibits satisfactory precision and accuracy. It is noted that some PAHs have relatively higher RSD values due to their low concentrations in the reference oil.
Application of SiO2/C3-CN SPE cartridges for fingerprinting analysis of crude oils and refined petroleum products
Two crude oils, three refined petroleum products and two envrionmental sediment samples from Alberta oil sands tailing ponds with widely different physical properties and chemical compositions were selected and analyzed using the SiO2/C3-CN SPE-GC-MS and the conventional silica gel-GC-MS method.7Table 2 summarizes the detailed TPH analysis results and Fig. 4 to 5 shows the comparison of the analysis results of target n-alkanes, biomarkers, and PAHs obtained from these two methods, respectively. It can be clearly seen that the concentrations of all hydrocarbon groups using the SiO2/C3-CN SPE cartridge are in the range of 80% to 120% of values obtained using the conventional silica gel micro-column technique. The total saturated hydrocarbons (TSHs), total aromatic hydrocarbons (TAHs), and total alkanes are fairly comparable with each other and the ratios of TSH/TPH and TAH/TPH from the two methods are also in good agreement. For the lighter diesel sample, the TPH value obtained using the SPE cartridge method is slightly higher than that using the adsorption chromatography method. This may most likely be due to the fact that the SPE-GC-MS method avoided the eluents concentration step. The volatile hydrocarbons (< n-C16) accounted for a higher fraction of detected TPHs in this diesel sample (Table 2).| Samples | Crude oils | Mid-range distillate | Heavy residual fuel | Lube oil | Environmental sediments | |||||||||
|---|---|---|---|---|---|---|---|---|---|---|---|---|---|---|
| Mississippi Canyon | Cold Lake Bitumen | Diesel-Ottawa | IFO 180 | Valvoline-10w-30 | Syncrude tailings pond sediments | |||||||||
| Abbreviation name | MC-Fresh | CLB | DO2 | IFO-180 | 10w-30 | Sediment #1 | Sediment #2 | |||||||
| SiO2/C3-CN | SiO2 | SiO2/C3-CN | SiO2 | SiO2/C3-CN | SiO2 | SiO2/C3-CN | SiO2 | SiO2/C3-CN | SiO2 | SiO2/C3-CN | SiO2 | SiO2/C3-CN | SiO2 | |
| a TPH: total petroleum hydrocarbons; TSH: total saturated hydrocarbons; TAH: total aromatic hydrocarbons. | ||||||||||||||
| TPH (mg g−1) | 344 | 391 | 746 | 906 | 662 | 571 | 291 | 334 | 221 | 195 | 317 | 256 | 423 | 376 |
| TSH (mg g−1) | 267 | 299 | 661 | 788 | 570 | 453 | 187 | 216 | 183 | 161 | 199 | 111 | 306 | 244 |
| TAH (mg g−1) | 76.4 | 91.9 | 85.2 | 117 | 91.8 | 117 | 104 | 119 | 38.1 | 33.9 | 124 | 143 | 115 | 132 |
| Total alkanes (mg g−1) | 13.6 | 17.2 | 2.5 | 2.8 | 75.1 | 60.7 | 20.0 | 23.3 | 0.37 | 0.25 | 0.0 | 0.0 | 2.4 | 2.4 |
| TSH/TPH-F3 (%) | 77.8 | 76.5 | 88.6 | 87.0 | 86.1 | 79.5 | 64.3 | 64.5 | 82.8 | 82.6 | 62.8 | 43.7 | 72.4 | 64.8 |
| TAH/TPH-F3 (%) | 22.2 | 23.5 | 11.4 | 13.0 | 13.9 | 20.5 | 35.7 | 35.5 | 17.2 | 17.4 | 39.3 | 56.3 | 27.3 | 35.2 |
| TPH-F3 distribution (mg g−1) | ||||||||||||||
| <C10 | 37.6 | 44.6 | 1.96 | 2.49 | 64.0 | 57.6 | 4.86 | 7.19 | 3.19 | 2.84 | 4.44 | 1.90 | 4.41 | 7.31 |
| C10-C16 | 121 | 115 | 10.4 | 11.5 | 436 | 373 | 115 | 136 | 39.4 | 30.3 | 21.7 | 26.6 | 80.5 | 18.0 |
| C16-C34 | 176 | 196 | 481 | 720 | 153 | 138 | 149 | 167 | 134 | 122 | 188 | 168 | 251 | 259 |
| >C34 | 50.0 | 6.17 | 127 | 171 | 1.03 | 0.46 | 17.8 | 28.4 | 43.0 | 39.0 | 102 | 59.1 | 87.8 | 91.4 |
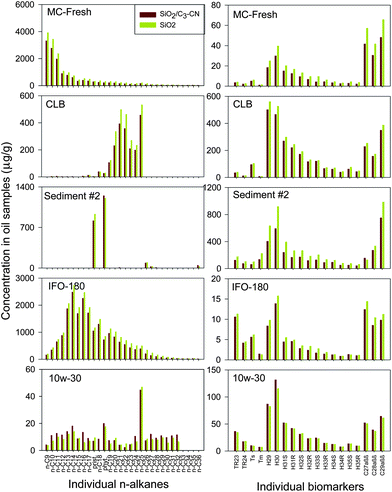 | ||
| Fig. 4 Comparison of n-alkane and biomarker results for the SiO2/C3-CN SPE and conventional silica gel column method for oil and sediment sample preparation. | ||
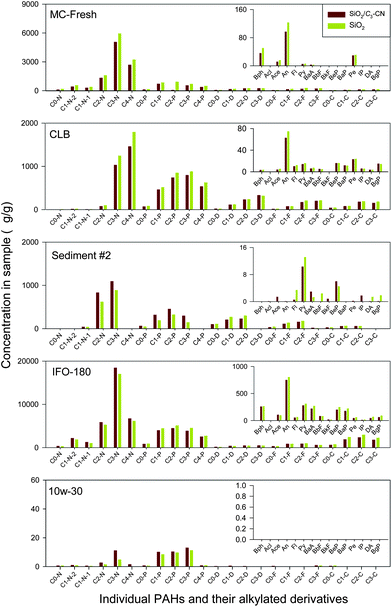 | ||
| Fig. 5 Comparison of US EPA priority and alkylated PAH results for SiO2/C3-CN SPE and conventional silica gel column method for oil and sediment sample preparation. | ||
Comparable results were obtained for all samples either for individual n-alkanes, biomarkers, or PAHs and their alkylated homologues using these two methods (Fig. 4 to 6). In addition of the high comparability of analytical data with the conventional silica gel-GC-MS method, the SiO2/C3-CN SPE-GC-MS method exhibits some other advantages such as shorter analysis time, less solvent consumption, and simplicity of operation. These suggest that the SiO2/C3-CN SPE-GC-MS may be used as an alternative approach for fast oil fingerprinting analysis, particularly for emergency oil spill response or when a large number of samples need to be processed.
It should be noted, that although adsorption chromatography with various adsorbents can be used to separate aliphatic and aromatic hydrocarbons,7,10 the fractionation efficiency of commercial SPE cartridges is rather limited. This is mainly due to their limited capacity and deactivation of adsorbents. In addition, in this study, there was higher background interference from the SPE sorbent or the SPE tube material. When the tube material was changed from plastic to glass, the background interference from the tube material was almost eliminated. Therefore, a high quality SPE cartridge is the key factor in achieving reliable analytical results.
Conclusions
Commercially available SPE cartridges are demonstrated to be an alternative for the cleanup and separation of aliphatic and aromatic hydrocarbons in crude oils, refined petroleum products and environmental sediment samples. The SiO2/C3-CN-GC-MS method also has various advantages in terms of analysis time, solvent consumption, and operational procedures compared with the conventional adsorption chromatography. The use of silica/cyanopropyl-based SPE cartridges and appropriate eluents, followed by GC-MS analysis can provide a performance that is comparable to the conventional adsorption chromatography for fingerprinting a series of target compounds including alkanes, biomarkers, and PAHs and their alkylated homologues. This would be particularly useful for the oil spill emergency response.References
- Z. Wang, M. Fingas, S. Blenkinsopp, G. Sergy, M. Landriault, L. Sigouin, J. Foght, K. Semple and D. W. S. Westlake, J. Chromatogr., A, 1998, 809, 89 CrossRef CAS.
- Z. Wang and M. Fingas, Mar. Pollut. Bull., 2003, 47, 423 CrossRef CAS.
- A. O. Barakat, A. R. Mostafa, Y. Qian and M. C. Kennicutt ll, Spill Sci. Technol. Bull., 2002, 7, 229 Search PubMed.
- Z. Wang, M. Fingas, P. Lambert, G. Zeng, C. Yang and B. Hollebone, J. Chromatogr., A, 2004, 1038, 201 CrossRef.
- C. Yang, Z. Wang, B. P. Hollebone, C. E. Brown and M. Landriault, J. Chromatogr., A, 2009, 1216, 4475 CrossRef CAS.
- P. Sun, B. Bao, G. Li, X. Wang, Y. Zhao, Q. Zhou and L. Cao, J. Chromatogr., A, 2009, 1216, 830 CrossRef CAS.
- Z. Wang, M. Fingas and K. Li, J. Sep. Sci., 1994, 32, 361 Search PubMed.
- Y. Briker, Z. Ring, A. Iacchelli and N. McLean, Fuel, 2003, 82, 1621 CAS.
- J. E. Schiller and D. R. Mathlason, Anal. Chem., 1977, 49, 1225 CrossRef CAS.
- D. W. Later, M. L. Lee, K. D. Bartle, R. C. Kong and D. L. Vassilaros, Anal. Chem., 1981, 53, 1612 CrossRef CAS.
- D. W. Later, B. W. Wilson and M. L. Lee, Anal. Chem., 1985, 57, 2979 CrossRef CAS.
- X. Gao and S. Chen, Estuarine, Coastal Shelf Sci., 2008, 80, 95 CrossRef CAS.
- M. Kamiński, J. Gudebska, T. Górecki and R. Kartanowicz, J. Chromatogr., A, 2003, 991, 255 CrossRef CAS.
- T. G. Harvey, T. W. Matheson and K. C. Pratt, Anal. Chem., 1984, 56, 1277 CrossRef CAS.
- C. A. Islas-Flores, E. Buenrostro-Gonzalez and C. Lira-Galeana, Energy Fuels, 2005, 19, 2080 CrossRef CAS.
- R. Alzaga, P. Montuori, L. Ortiz, J. M. Bayona and J. Albaigés, J. Chromatogr., A, 2004, 1025, 133 CrossRef CAS.
- B. Bennett and S. R. Larter, Anal. Chem., 2000, 72, 1039 CrossRef CAS.
- N. Theobald, Anal. Chim. Acta, 1988, 204, 135 CrossRef CAS.
- Z. Wang, B. Hollebone, C. Yang, B. Fieldhouse, M. Fingas and M. Landriault, in, Environment Canada, Ottawa, 2004.
- Z. Wang, C. Yang, F. Kelly-Hopper, B. P. Hollebone, X. Peng, C. E. Brown, M. Landriault, J. Sun and Z. Yang, J. Chromatogr., A, 2009, 1216, 1174 CrossRef CAS.
- D. Barceló, Environmental Analysis: Techniques, Applications, and Quality Assurance, Elsevier Science Publishers B.V., Amsterdam, The Netherlands, 1993 Search PubMed.
| This journal is © The Royal Society of Chemistry 2011 |