DOI:
10.1039/C0AY00691B
(Paper)
Anal. Methods, 2011,
3, 636-645
Simultaneous determination of ellagic and gallic acid in Punica granatum, Myrtus communis and Itriphal formulation by an electrochemical sensor based on a carbon paste electrode modified with multi-walled carbon nanotubes
Received
12th November 2010
, Accepted 25th December 2010
First published on 3rd February 2011
1. Introduction
Polyphenols derived from plants play an important role in human nutrition and possess numerous biological properties including antioxidant, anti-inflammatory, anticancer and anti-atherosclerotic activities. EA is a polyphenol dimeric derivative of gallic acid (GA) (Scheme 1) that is found in fruits and nuts in a free form (as EA-glycosides) or in a bound state (as ellagitannins, ETs).1 In many cases, EA is obtained from the hydrolysis of ellagitannins. EA is a potent antagonist of mutagenic aromatic hydrocarbons and may become a prototype for drugs that prevent cancer. EA induces G1 arrest, inhibits cell growth, causes apoptosis in tumor cells2 and exhibits hepatoprotective activity against carbon tetrachloride in vitro and in vivo.3 EA and GA are present in grapes and encompass a broad class of compounds including the free acid. Additionally, EA and GA are common in plants and are abundant in Punica granatum,4 green tea,5Myrtus communis6 and many herbs.7
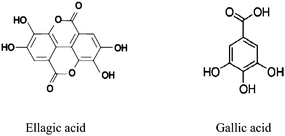 |
| | Scheme 1 Structures of ellagic and gallic acids | |
The pomegranate (Punica granatum) has been used in traditional medicine in Iran, Turkey, India, China, Afghanistan and Russia. The importance of the pomegranate as a medicinal plant is now supported by data obtained from modern science, revealing that the fruit has anti-carcinogenic,8 antioxidant, antidiabetic, anti-viral, anti-inflammatory and anti-atherosclerosis effects in vivo and in vitro.9,10 EA is an important phenolic acid with high antioxidant activity and has been reported in pomegranate peels. Biological activity of the pomegranate is attributed to high levels of antioxidant activity and total phenolic content. There are many methods for the quantitative analyses of EA including chromatography,11 spectrophotometry12 and capillary electrophoresis (CE).13
Myrtus communis L. (Myrtaceae) is an evergreen shrub found in Mediterranean ecosystems. M. communis is traditionally used as an anti-inflammatory and antiseptic agent, and is also used in the treatment of diabetes mellitus.14 Studies on phytochemicals found in M. communis led to investigations into the biological properties of tannins and related polyphenolic compounds isolated from the leaves of M. communis.
Many plants containing polyphenols and tannins are prescribed by ancient Iranian medicine. For example, Itriphal is considered the greatest and most versatile of all traditional formulations. It is prescribed for inflammation, heat sickness, infection, obesity, anemia, fatigue, candida, poor digestion, assimilation and tuberculosis.15 Itriphal is prepared by combining ground dry fruits of Amla, Belerica and Chebula in a 1![[thin space (1/6-em)]](https://www.rsc.org/images/entities/char_2009.gif) :
:![[thin space (1/6-em)]](https://www.rsc.org/images/entities/char_2009.gif) 1
1![[thin space (1/6-em)]](https://www.rsc.org/images/entities/char_2009.gif) :
:![[thin space (1/6-em)]](https://www.rsc.org/images/entities/char_2009.gif) 1 ratio. Itriphal is also known as Triphala in Ayurvedic formulations. HPLC methods with GA as a marker, and UV spectroscopic methods for the analysis of Itriphal, have been reported.16,17 Recent reports indicate the presence of GA in fruits of E. officinalis, T. chebula and T. bellerica.18
1 ratio. Itriphal is also known as Triphala in Ayurvedic formulations. HPLC methods with GA as a marker, and UV spectroscopic methods for the analysis of Itriphal, have been reported.16,17 Recent reports indicate the presence of GA in fruits of E. officinalis, T. chebula and T. bellerica.18
Several analytical techniques for the determination of EA and GA in plants have been reported. In this study, we report a novel sensor for the simultaneous determination of EA and GA in plants by an electrochemical method based on a carbon paste electrode modified with multi-walled carbon nanotubes. The procedure is simple to perform, rapid, reasonably inexpensive and is a viable alternative to other methods. Moreover, voltammetric techniques do not require substantial sample preparation and are able to analyze mixtures or samples in complex matrices, such as strongly acidic or highly saline solutions. In this study, carbon nanotube (CNTs) modified electrodes have been successfully applied to the simultaneous determination of EA and GA.
CNTs are a new form of elementary carbon composed of graphitic sheets rolled into closed concentric cylinders with nanometre diameters and micrometre lengths. Since their discovery in 1991,19 CNTs have received considerable attention from chemists, physicists and materials scientists due to their unique electrical conductivity, chemical stability and high mechanical strength.20 CNTs have been used as single-walled carbon nanotubes (SWCNTs) and multi-walled carbon nanotubes (MWCNTs). The electronic properties of carbon nanotubes suggest that electron transfer is promoted in electrochemical reactions where CNTs are used as an electrode. Thus, CNTs provide a new method of electrode surface modification for the design of electrochemical sensors and novel electrocatalytic materials.21
2. Experimental
2.1. Chemicals and reagents
EA and GA were purchased from Sigma-Aldrich. Multi-walled carbon nanotubes (O.D = 10–20 nm, L < 1–2 μm, >95% pure) were obtained from Nanolab Inc (Brighton, MA) and were purified using an acid treatment. Pure fine graphite powder (Merck) and paraffin oil (DC 350, Merck, density = 0.88 g cm−3) were used as binding agents in graphite pastes. All solutions were freshly prepared with doubly distilled water. A Britton Robinson (B–R) buffer was prepared from an acidic solution of 0.2 M H3PO4, CH3COOH, and H3BO3, by adjusting the pH with 0.2 M NaOH. All other reagents were of analytical grade. The herbal formulation and extracts were purchased from the traditional medicine department of Barij Essence Pharmaceutical in Kashan.
To prepare extracts, 1.0 g of dried powder was weighed and added to 10.0 mL of doubly distilled water–ethanol (30/70) at 25 °C. Samples were protected from light, immersed in an ultrasound bath and subjected to ultrasound treatment at a constant frequency of 35 kHz for 30 min at room temperature.
2.3. Apparatus and experimental procedure
Electrochemical experiments were conducted with an Autolab potentiostat-galvanostat PGSTAT 35 (Eco chemie Utrecht, Netherlands) equipped with GPES 4.9 software. Experiments were conducted under a nitrogen atmosphere at 25 ± 1 °C in a three-compartment electrochemical cell. The cell was equipped with a modified carbon paste disk as the working electrode, a silver chloride electrode (Ag/AgCl) as the reference electrode and a platinum wire as the counter electrode. The pH of solutions used as supporting electrolytes in voltammetric experiments was measured with a Metrohm 691 pH meter. An ultrasound bath (Bandelin Sonorex, Germany) at a constant frequency of 35 kHz was used during experiments. Stock solutions of GA and EA (0.001 M) were prepared daily by dissolving in water. Cyclic voltammograms were recorded from 0.1 to 1.2 V at various scan rates. Differential pulse voltammetric (DPV) analysis was used for the determination of EA and GA in samples.
2.4. Preparation of modified electrode
The modified carbon paste electrode was fabricated by combining 0.004 g of multi-walled carbon nanotube powder, 0.5 g of graphite powder and approximately 0.2 mL of paraffin oil. The carbon nanotubes were dispersed in ethanol using an ultrasonic bath, and graphite powder and paraffin oil were added to the mixture. A carbon paste electrode (CPE) was prepared in a similar manner by mixing graphite powder and paraffin oil, and packing the resultant paste into a syringe (2 mm diameter and 10 mm deep). Next, a copper wire was inserted through the center of the rod. Differential pulse voltammograms were obtained from electrochemical oxidation of solutions and carbon paste electrodes with differing amounts of carbon nanotubes. Results revealed that 0.004 g was the optimal amount of CNT in 0.5 g of graphite. The peak current of CNT/CPE was the highest of all investigated electrodes and was about 1.7 times greater than bare CPE. Additionally, a 20 mV shift toward negative potentials was observed with CNT/CPE, indicating a suitable electrocatalytic effect on EA oxidation. Oxidation peaks of EA and GA were observed for all electrodes. The results revealed that the peak current for MWCPE was the highest; therefore, more EA was adsorbed at the surface of MWCPE electrodes due to a larger specific surface area and good adsorptive properties. Variations in anodic peak current over time were also evaluated. The peak current increased rapidly with an increase in accumulation time and became relatively stable at 180 s, indicating that EA accumulated rapidly on MWCPE. A short accumulation time with MWCPE may be due to improved adsorption; however, an accumulation time of 180 s was achieved with an open circuit potential (OCP).
2.5. Investigation of the modifier effect
The electrochemical behavior of GA and EA on the CNT/CPE and bare CPE was studied by cyclic voltammetry (CV) and DPV. The peak oxidation potentials of about 0.519 V and 0.655 V vs. Ag/AgCl (3.0 M KCl) for GA and EA were obtained at pH 2.0 on the surface of modified electrode, respectively. Voltammograms obtained for both analytes at the CNT/CPE and bare CPE presented an irreversible chemical behavior for GA and EA, but with a magnification 1.7 times greater than bare CPE and 20 mV shifts to negative potential (results not shown).
3. Results and discussion
3.1. Influence of pH on the bulk-modified electrode
The effect of pH on EA and GA oxidation was studied using differential pulse voltammetry. As shown in Fig. 1A, DPV was conducted on solutions containing 25 nM EA and 0.2 M B–R buffer with pH values ranging from 2.0–9.0 at a scan rate of 25 mV s−1 and a modulation amplitude of 18 mV. At a pH between 2.0 and 9.0, the anodic peak current of EA decreased with increasing pH and the highest peak current was obtained at a pH of 2.0. Thus, a buffer solution with a pH of 2.0 was selected for further studies. When the pH of the solution was above 9.0, the oxidation peak of EA almost disappeared (Fig. 1B). Additionally, anodic potential peaks shifted by 516 mV to a more negative potential upon increasing pH. A slope of −68 mV pH−1 and an intercept (Fig. 1C) of 0.861 V was obtained for the Nernst equation (eqn (1)).| | | Epa (EA) (V vs. AgCl) = 0.855 − 0.068 pH, R2 = 0.993 | (1) |
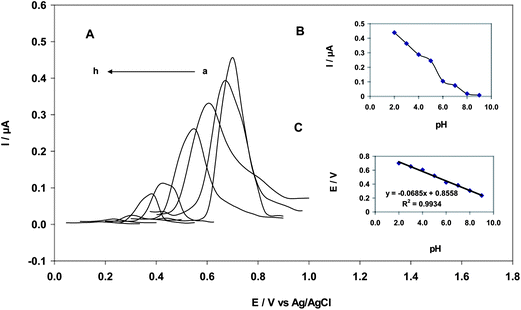 |
| | Fig. 1 (A) Differential pulse voltammograms of a 25 nM EA solution. a to h correspond to a pH of 2, 3, 4, 5, 6, 7, 8 and 9, respectively; (B) Plot of intensity: I/A vs. pH; (C) Plot of electrochemical potential: Epa/V vs. pH (scan rate: 25 mV s−1, amplitude: 18 mV). | |
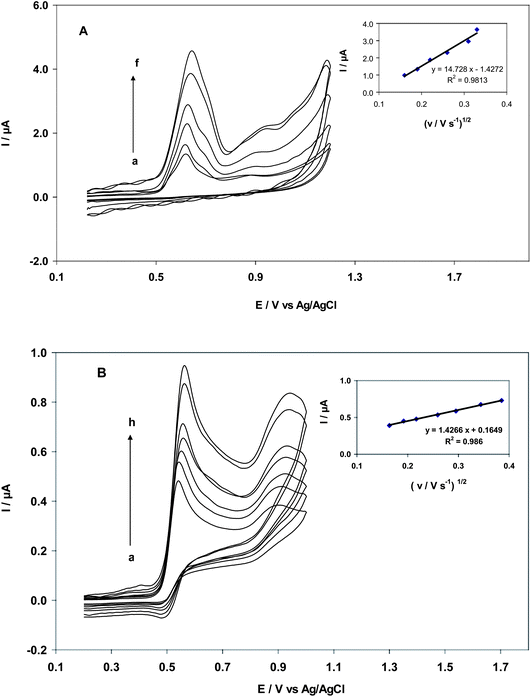 |
| | Fig. 2 (A) Cyclic voltammetry of MWCNT for EA (25.0 nM) at scan rates of 25, 35, 45, 65, 95 and 105 mV s−1 (from inner to outer); inset: Plot of peak current vs. (v/mV)1/2. (B) Cyclic voltammetry of CNT/CPE for GA (35.0 μM) at scan rates of 25, 35, 45, 65, 85, 120 and 150 mV s−1 (from inner to outer); inset: Plot of peak current vs. (v/mV)1/2. | |
Also, DPV experiments were conducted on solutions of GA and 0.2 M B–R buffer with pH values ranging from 2.0–5.0 at a scan rate of 25 mV s−1 and a modulation amplitude of 18 mV. At pH 2, a sharp peak at 0.520 V was predominant, indicating electrochemical oxidation of GA. In acidic solution, the oxidation of GA was facile; however, oxidation became difficult with an increase in pH. Anodic potential peaks of GA shifted by 210 mV to a more negative potential upon an increase in pH. However, peak current decreased with pH and the response in current vanished at a pH >5. According to the Nernst equation, potentials are a linear function of pH:
| Epa(GA) (V vs. AgCl) = 0.664 − 0.069 pH, R2 = 0.965 |
The slope of the Nernst equation for a 33.75 μM solution of GA was −69 mV. From the intercept of Evs. pH, the standard formal potential of GA was 0.664 V. Eqn (1) illustrates the dependence of DPV potentials of EA and GA on pH.
3.2. Effect of scan rate
The effect of scan rate on CNT/CPE in the oxidation of EA and GA showed a linear relationship. In the range of 25–105 mV s−1, (Fig. 2A), the anodic peak current (Ipa) of EA (25.0 nM) increased linearly with an increase in the square root of the scan rate (υ1/2). This result indicated that oxidation was controlled by diffusion (Fig. 2A), according to the Randles–Sevcik equation (eqn (2)):22| | | Ip = 2.69 × 10⁵n3/2AD1/2Cυ1/2 | (2) |
where n is the number of electrons transferred in the reaction, υ is the scan rate, A is the surface of the electrode, C is the concentration of reactant, and Ip is the peak current of the reactant. Also in GA oxidation (35.0 μM), there is a linear relationship between peak current and square root of the scan rate between 25–150 mVs−1. Results shown in Fig. 2B indicated that surface controlled and diffusion-controlled oxidation prevailed at low scan rates. Linear regression equations were as follows:
| Ipa(μA) (EA) = 14.72 υ1/2 (mV s−1)1/2 + 1.427, R2 = 0.981 |
| Ipa(μA) (GA) = 1.427 υ1/2 (mV s−1)1/2 + 0.165, R2 = 0.980 |
The mechanism of the GA oxidation process at the modified electrode can be proposed from the results in Scheme 2.19 In Fig. 2B, two oxidation peaks can be observed at about 0.525 V and 0.911 V, respectively. It seems that the first peak of GA originates primarily from the oxidation of the ortho-hydroquinone group in the ring of the molecule. The second oxidation peak is caused by the oxidation of the third –OH group of GA.23 Due to electrokinetic reasons the oxidation of the galloyl group, occurring at 400 mV higher potentials, constitutes a minor component of the response, but causes the shift of the peak potential.23
3.3. Chronocoulometric responses of EA and GA
Chronocoulometry was used to calculate the rate of diffusion to the surface of the modified electrode. Chronocoulograms of EA and GA were obtained with concentrations ranging from 7.5–60 nM and 10–30 μM, respectively, at a CNT/CPE electrode with a potential step of 500 mV; that for GA is shown in Fig. 3A. A plot of Qvs.t1/2 for different concentrations of GA is shown in Fig. 3B. Slopes of the resultant straight lines were plotted vs. GA concentration (Fig. 3C). According to the integrated Cottrell equation,22 the apparent diffusion coefficients of EA and GA were determined using an electrochemical approach (eqn (3)) and are 6.49 × 10⁻⁷ cm2 s−1 and 2.31 × 10⁻⁵ cm2 s−1, respectively.| | | Q = 2nFAD1/2C1/2 π−1/2t1/2 | (3) |
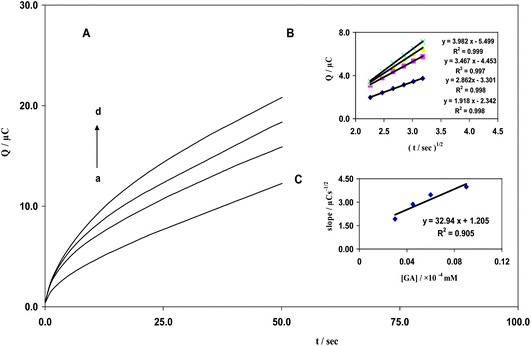 |
| | Fig. 3 (A) Chronocoulograms obtained from MWCNT in 0.2 M B–R buffer solution (pH 2.0) with varying concentrations of GA and a potential step of 500 mV. Curves a–d correspond to GA concentrations of 10, 15, 20, and 30 μM; (B) Plots of Qvs.t1/2 obtained from chronocoulograms a–d; (C) Slopes of straight lines vs. GA concentration. | |
| | | η = 2.3 RT/nααF(log io) − 2.3RT/nααF(log i) | (4) |
Values of the electron transfer coefficient, (α), were 0.33 and 0.66 for EA and GA. According to LSV, ionic exchange current density (io) was 1.7 and 1.47 μA cm−2 for EA and GA, respectively.
A rotating disk electrode (RDE) is used to study electrode processes that are controlled by diffusion.25 In this study, rotating disk electrode voltammetry with carbon nanotube paste electrodes was used for the first time to calculate kinetic coefficients of EA and GA oxidation. To elucidate the kinetics of EA and GA oxidation in RDE, measurements were performed with different rotation speeds in B–R (pH = 2) containing 35.0 nM and 33.3 μM EA and GA, separately. Steady state current–potential curves were recorded for the oxidation of EA and GA under various experimental conditions. A typical example of current–potential curves at rotation speeds ranging from 500–4500 and 1500–7500 rpm for EA and GA are shown in Fig. 5A and B, respectively. When oxidation at the surface of CNT/CPE is controlled solely by mass transfer, the relationship between current and the square root of rotating speed, ω1/2, obeys the Levich equation (eqn (5)):25| | | I = 0.62 nFAD2/3ν1/6ω1/2C | (5) |
Where D (cm2 s−1) is the diffusion coefficient, v (cm2 s−1) is the kinematic viscosity, ω (rad s−1) is the rotation speed, C (mol cm−3) is the concentration in bulk solution and all other parameters have conventional meanings. A plot of the current measured at 0.613 and 0.511 V vs.ω1/2 (Fig. 5A and B) revealed that current increased with an increase in electrode rotation speed until a constant value was achieved. The Koutecky–Levich equation (eqn (6)) was used to determine the rate constant of EA and GA oxidation at the carbon nanotube paste electrode.22| | | [I]−1 = [nFACk]−1 + [0.62 nFAD2/3υ−1/6Cω1/2]−1 | (6) |
Where A (cm2) is the electrode area, k (cm3 mol−1s−1) is the catalytic rate constant and v (cm2 s−1) is the kinematic viscosity. Using the data from voltammograms, a plot of I−1vs.ω−1/2 was constructed and yielded a straight line. The catalytic rate constant, k (cm3 mol−1s−1), was calculated from the intercept of the Koutecky–Levich plot and values of 5.5 × 10² and 8.6 × 102 cm3 mol−1s−1 were obtained for EA and GA, respectively. The diffusion coefficients of EA and GA were determined by RDE with a modified electrode and were close to values obtained by chronocoulometry. According to eqn (6), the diffusion coefficients of EA and GA oxidation are 2.16 × 10⁻⁷ and 1.08 × 10⁻⁵ cm2 s−1, respectively.
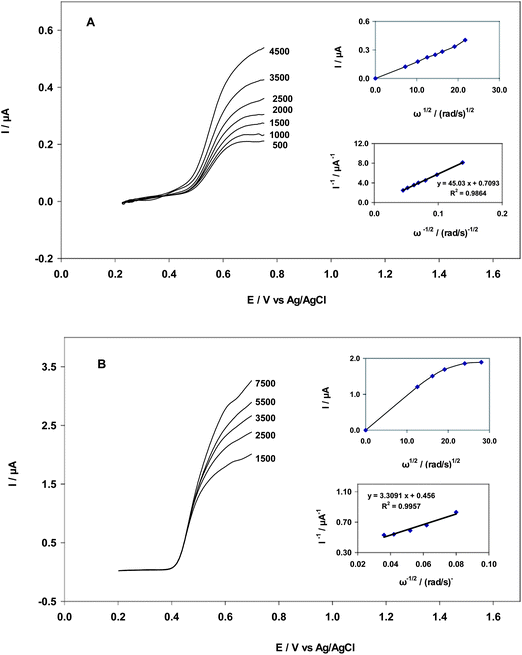 |
| | Fig. 5 (A) Typical steady-state voltammograms obtained for MWCNT in B–R buffer (pH = 2) containing 35.0 nM EA at various rotation rates; insets: Levich plot for EA oxidation at 613 mV on MWCNT and Koutecky–Levich plot obtained from data derived from the Levich plot. (B) Typical steady-state voltammograms obtained for MWCNT in B–R buffer (pH = 2) containing 33.3 μM GA at various rotation rates; insets: Levich plot for GA oxidation at 511 mV on MWCNT and Koutecky–Levich plot obtained from data derived from the Levich plot. | |
3.6. Quantification of EA and GA in CNT/CPE
The oxidation of EA and GA at a CNT/CPE and bare electrode were successfully conducted in B–R buffer (pH = 2) by differential pulse voltammetry (Fig. 6A). DPV has better resolution and sensitivity than cyclic voltammetry; therefore, it was used for the quantification of EA and GA at the modified electrode and for the estimation of lower detection limits. DPV is suitable for the analysis of mixtures of electrochemically active substances because relatively small differences in peak potentials are required for analyte determination. DPV voltammograms showed two linear relationships between peak current and concentration. In GA oxidation, a linear range occurred at concentrations of 1.00–6.25 μM, according to a calibration equation of Ip (μA) = 0.11 C (μM)−0.056 and R2 = 0.988. Another linear range occurred at GA concentrations of 6.25–33.75 μM, according to an equation of Ip (μA) = 0.36 C (μM) + 0.055 with R2 = 0.993. A detection limit of 0.27 μM of GA was obtained. In the oxidation of EA, linearity occurred in the range of 1.25–10.00 nM, according to a calibration equation of Ip (μA) = 141.97 C (μM) + 0.035 and R2 = 0.991. A second linear range for EA oxidation occurred between 10.00 and 25.00 nM, according to a calibration equation of Ip (μA) = 49.30 C (μM) + 1.00 and R2 = 0.987. A detection limit of 0.21 nM of EA was obtained (Fig. 6B).
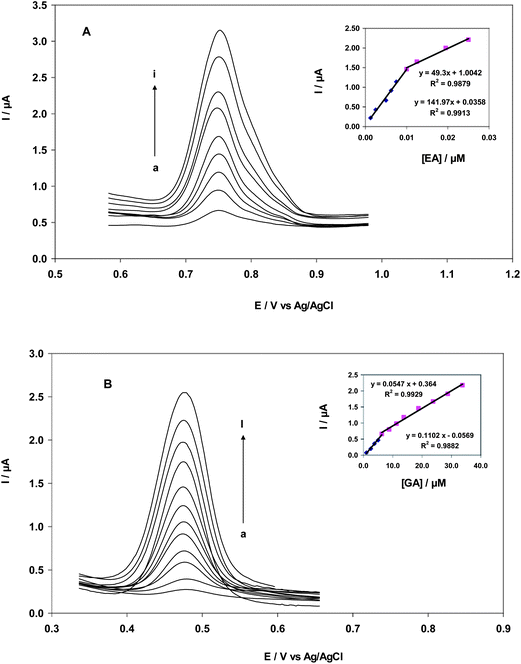 |
| | Fig. 6 (A) Differential pulse voltammograms of CNT/CPE in 0.2 M B–R buffer solution (pH = 2.0) containing different concentrations of EA. Curves 1–9 correspond to EA concentrations of 1.25, 2.50, 5.00, 6.25, 8.75, 10.0, 12.50, 20.0 and 35.0 nM; inset: Plots of electrocatalytic peak current as a function of EA concentration in the range of 1.25 to 12.5 nM and 12.5 to 35.0 nM. (B) Differential pulse voltammograms of CNT/CPE in 0.2 M B–R buffer solutions (pH = 2.0) containing different concentrations of GA. Curves 1–12 correspond to GA concentrations of 1.00, 2.50, 3.75, 5.00, 6.25, 8.75, 11.20, 13.70, 18.7, 23.7, 28.7 and 33.75 μM; inset: Plots of electrocatalytic peak current as a function of GA concentration in the range of 1.00–6.25 μM and 6.25–33.75 μM. | |
Under the optimized experimental conditions, with pH 2.0 and modulation amplitude of 18 mV, reproducibility and stability of the modified electrode was estimated. The relative standard deviations (RSD) of 3.75% in the oxidation peak current and 1.09% in the peak potential for five repeated detections of 20.5 μM GA, and the decrease in peak current to 96.7% of the initial current after 14 days continuous detection of 17.5 μM GA, suggests excellent reproducibility and stability of results using the modified electrode. The results obtained in this study clearly show that the combination of carbon nanotubes with a carbon paste electrode enhances GA and EA oxidation and results in a strong electrocatalytic effect. The detection limits and linear ranges are comparable to values reported by other research groups such as Pingarron et al.26
3.7. Simultaneous determination of EA and GA at CNT/CPE
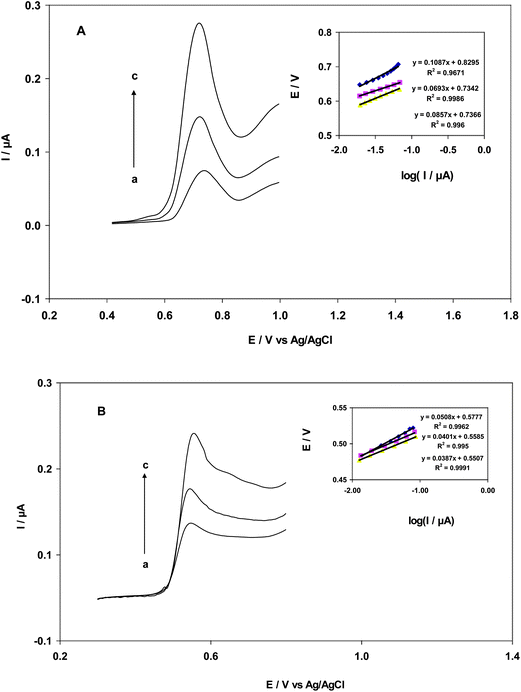
The main objective of the present study was to develop a modified electrode capable of electrocatalytic oxidation and separation of the electrochemical responses of EA and GA. In mixtures of EA and GA, the concentration of one species was varied while the concentration of the other compound remained constant. Additionally, the concentration of both compounds was varied. For simultaneous determination of EA and GA, differential pulse voltammetry was conducted between 200–900 mV. Two peaks at approximately 580 and 770 mV (vs. Ag/AgCl) were observed for EA and GA oxidation, respectively. Peak separation of 190 mV allowed for the simultaneous detection of EA and GA with DPV. A CNT/CPE electrode was successfully used in 0.2 M B–R buffer solution (pH = 2.0) containing 3.75 μM GA and EA concentrations between 7.50–19.0 nM. Calibration curves were constructed for the simultaneous determination of EA and GA. At a fixed concentration of GA, the oxidation peak of EA increased with an increase in EA concentration. DPV of CNT/CPE in 0.2 M B–R buffer solution containing 7.50 nM EA and concentrations of GA between 2.50–21.25 nM was successfully conducted. Upon an increase in GA concentration, an increase in the peak current of GA was observed, but EA oxidation remained unaffected. As shown in Fig. 7, the peak current for both compounds increased linearly with increasing concentration. The peak current of EA and GA increased proportionally with an increase in respective concentration; however, the peak current of the other compound was not affected. This result indicated that EA and GA oxidation occurred independently at CNT/CPE. Therefore, the simultaneous or independent measurement of EA and GA is possible.
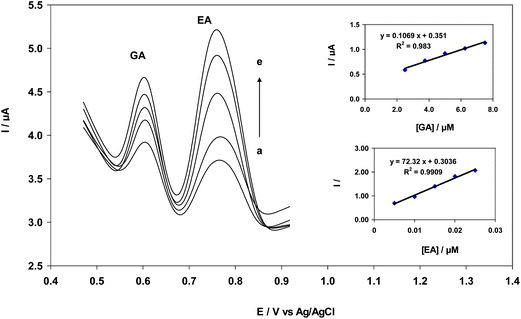 |
| | Fig. 7 Differential pulse voltammograms of CNT/CPE in 0.2 M B–R buffer solution (pH = 2.0) containing different concentrations of EA and GA (from inner to outer): 5.00, 7.50, 15.0, 20.0 and 25.0 nM EA, and 2.50, 3.75, 5.00, 6.25 and 7.50 μM GA; insets: Plot of peak current as a function of EA concentration in the linear range of 5.00–25.0 nM EA and peak current as a function of GA concentration in the linear range of 2.5–7.5 μM of GA. | |
3.8. Real sample analysis
3.8.1. Determination of EA in pomegranate peel.
EA has been reported in pomegranate peel. To our knowledge, the determination of EA in pomegranate extract by DPV has not been reported. In this paper, we report the oxidation of EA by a CNT/CPE electrode in DPV and compare a voltammetric and HPLC method for the quantification of EA in pomegranate extract. Determination of EA in pomegranate husk extract was achieved by the standard addition method, yielding a plot of peak height vs. EA concentration that was described by the following linear equation:
| ip (μA) = 0.318 C (μM) + 0.218, R2 = 0.997 |
Under these conditions, the concentration of EA in 1.0 g of pomegranate peel extract was found to be 5.8 ± 0.3 mg g−1. The concentration of EA in pomegranate obtained by DPV was of the same order of magnitude as the concentration obtained by HPLC analysis.27 The amount of EA varied between 0.78 and 12.80 mg g−1 (Table 1), depending on the source of pomegranate. Recovery rates of spiked samples ranged from 94.3% to 100.5% (Table 1), indicating that the procedure is free from matrix interference. The results are acceptable and the proposed method could be used for the determination of EA in extract.
| No. |
DPV/mg g−1 |
Average Recovery (%) |
| Pomegranate peel |
5.8 ± 0.03 (EA) |
97.4 |
|
Myrtus communis
|
4.8 ± 0.01 (GA) |
101.4 |
| Itriphal |
91.2 ± 0.05 (GA) |
100.2 |
3.8.2. Determination of GA in Myrtus communis.
Electrochemical methods can be used to evaluate low concentrations of GA present in Myrtus communis leaves. A carbon paste electrode modified with multi-walled carbon nanotubes was applied for the determination of GA from extract. Determination of GA in extract was achieved by the standard addition method, where linearity according to the following equation was observed:
| ip,M.communis (μA) = 0.131 C (μM) + 0.0297, R2 = 0.993 |
The average recovery was 101.4% for Myrtus communis, respectively.
3.8.3. Determination of GA in Itriphal formulation.
In this paper, we reported the novel use of CNT/CPE for the oxidation of GA and compared the quantification of GA by DPV to results obtained with HPLC. A linear equation (ip (μA) = 0.133C (μM) + 0.114) was obtained with a correlation coefficient of 0.999. The quantity of GA obtained using DPV was 91.2 mg g−1 (Table 1), which is in agreement with results obtained by HPLC.28 Recovery experiments were conducted to evaluate matrix effects and satisfactory recoveries for GA and Itriphal were observed (100.2% for Itriphal). Thus, matrix interferences were not significant for samples analyzed by DPV.
4. Conclusions
A simple, fast, sensitive and selective method was applied for the measurement of trace amounts of EA and GA. This method was successfully applied to the determination of EA and GA in Punica granatum, Myrtus communis and a herbal formulation. A novel analytical method involving oxidation of EA and GA at the surface of a modified carbon paste electrode incorporating MWCNT was conducted. The results revealed that EA and GA oxidation was dependent on pH. The electrode used for the quantification of EA and GA is simple to use, and provides rapid results. Additionally, the electrode is stable under the reaction conditions and surface renewal is easy. Electrochemical parameters such as the diffusion coefficient, electron transfer coefficient and electron transfer rate constant were determined for EA and GA oxidation by chronocoulometry, linear sweep and rotating disk voltammetry. The detection limits of EA and GA are 0.27 μM and 0.21 nM, respectively, after 180 s of accumulation in an open circuit potential.
Acknowledgements
The authors would like to thank the University of Kashan research council and the traditional medicine department of Barij Essence Pharmaceutical for financial support.
References
- A. Rommel and R. E. Wrolstad, J. Agric. Food Chem., 1993, 41, 1951 CrossRef CAS.
- B. A. Narayanan, O. Geoffroy, M. C. Willingham, G. G. Re and D. W. Nixon, Cancer Lett., 1999, 136, 215 CrossRef CAS.
- K. Singh, A. K. Khanna, P. K. Visen and R. Chander, Indian J. Exp. Biol, 1999, 37, 939 Search PubMed.
- M. I. Gill, F. A. Tomas-Barberan, B. Hess-Pierce, D. M. Holcroft and A. A. Kader, J. Agric. Food Chem., 2000, 48, 4581 CrossRef CAS.
- S. Mildner-Szkudlarz, R. Zawirska-Wojtasiak and W. Obuchowski, J. Food Sci., 2009, 74, 362.
- M. Yoshimura, Y. Amakura, M. Tokuhara and T. Yoshida, J. Nat. Med., 2008, 62, 366 Search PubMed.
- S. Peng, A. Scalbert and B. Monties, Phytochemistry, 1991, 30, 775 CrossRef CAS.
- C. Bell and S. Hawthorne, J. Pharm. Pharmacol., 2008, 60, 139 CrossRef CAS.
- M. Rosenblat, N. Volkova, R. Coleman and M. Aviram, J. Agric. Food Chem., 2006, 54, 1928 CrossRef CAS.
- M. Aviram, N. Volkova, R. Coleman, M. Dreher, M. K. Reddy and D. Ferreira, J. Agric. Food Chem., 2008, 56, 1148 CrossRef CAS.
- I. Bala, V. Bhardwaj, S. Hariharan and M. N. V. Ravi Kumar, J. Pharm. Biomed. Anal., 2006, 40, 206 CrossRef CAS.
- T. C. Wilson and A. E. Hagerman, J. Agric. Food Chem., 1990, 38, 1678 CrossRef CAS.
- Z. Behong, W. Zhenhua, L. Xiaojun, Z. Jie and H. Xianming, Phytochem. Anal., 2008, 19, 86 CrossRef.
- L. Bravo, Nutr. Rev., 1998, 56, 317 Search PubMed.
-
H. Avesina, In: Sharafkandi, A. (Translator), Canon of medicine. Soroosh Press, Tehran, 1988, 96–98 Search PubMed.
- D. Singh, R. Govindrajan and A. K. S. Rawat, Phytochem. Anal., 2008, 19, 164 CrossRef CAS.
- P. K. Mukherjee, S. Rai, S. Bhattacharya, A. Wahile and B. P. Saha, Indian J. Traditional Knowledge, 2008, 7, 379 Search PubMed.
- G. Suresh Kumar, H. Nayaka, S. M. Dharmesh and P. V. Salimath, J. Food Compos. Anal., 2006, 19, 446 CrossRef CAS.
- S. Iijima, Nature, 1991, 354, 56 CrossRef CAS.
- P. M. Ajayan, Chem. Rev., 1999, 99, 1787 CrossRef CAS.
- A. Salimi, R. G. Compton and R. Hallaj, Anal. Biochem., 2004, 333, 49 CrossRef CAS.
-
A. J. Bard and L. R. Faulkner, Electrochemical Methods: Fundamentals and Applications, 2nd ed., Wiley, New York, 2001 Search PubMed.
- B. Yang, A. Kotani, K. Arai and F. Kusu, Chem. Pharm. Bull., 2001, 49, 747 CrossRef CAS.
-
I. Epelboin, C. Gabrielli, M. Keddam, E. Yeager, B. E. Conway and S. Sarangapani, Comprehensive Treatise of Electrochemistry, Plenum press, New York, 1984 Search PubMed.
-
V. G. Levich, Physicochemical Hydrodynamics, Prentice-Hall, Englewood Cliffs, New Jersey, 1962 Search PubMed.
- J. M. Pingarron, M. Gamella, S. Campuzano and A. J. Reviejo, J. Agric. Food Chem., 2006, 54, 7960 CrossRef.
- A. F. Aguilera-Carbo, C. Augur, L. A. Prado-Barragan, C. N. Aguilar and E. Favela-Torres, Chem. Pap., 2008, 62, 440 Search PubMed.
- G. H. Naik, K. I. Priyadarsini and H. Mohan, Curr. Science, 2006, 90, 1100 Search PubMed.
|
| This journal is © The Royal Society of Chemistry 2011 |
Click here to see how this site uses Cookies. View our privacy policy here. 
![[thin space (1/6-em)]](https://www.rsc.org/images/entities/char_2009.gif) :
:![[thin space (1/6-em)]](https://www.rsc.org/images/entities/char_2009.gif) 1
1![[thin space (1/6-em)]](https://www.rsc.org/images/entities/char_2009.gif) :
:![[thin space (1/6-em)]](https://www.rsc.org/images/entities/char_2009.gif) 1 ratio. Itriphal is also known as Triphala in Ayurvedic formulations. HPLC methods with GA as a marker, and UV spectroscopic methods for the analysis of Itriphal, have been reported.16,17 Recent reports indicate the presence of GA in fruits of E. officinalis, T. chebula and T. bellerica.18
1 ratio. Itriphal is also known as Triphala in Ayurvedic formulations. HPLC methods with GA as a marker, and UV spectroscopic methods for the analysis of Itriphal, have been reported.16,17 Recent reports indicate the presence of GA in fruits of E. officinalis, T. chebula and T. bellerica.18


