DOI:
10.1039/C0AY00629G
(Paper)
Anal. Methods, 2011,
3, 274-279
Received
19th October 2010
, Accepted 4th December 2010
First published on 22nd December 2010
Abstract
In this work, we have developed a novel SERS-based approach to detect hydrogen peroxide (H2O2) scavenging activity by using gold nanoshell precursor nanocomposites (SiO2/GNPs) as nanoprobes. H2O2 can reduce AuCl4− to Au0 and enlarge the gold nanoparticles (GNPs) that attached on the surface of SiO2. As the concentration of H2O2 increases, the surface coverage of resultant gold on silica cores increases accordingly until continuous gold nanoshells (GNSs) are formed. During the growth process, there is a strong correlation between the SERS-activity of the GNSs and the amount of H2O2 that is used as reductant. When H2O2 reaches 250 μM, the resultant GNSs show the highest SERS-activity. H2O2 can be scavenged by antioxidants such as tannic acid and L-apple acid. Their H2O2 scavenging activities were determined by restraining the H2O2-mediated (250 μM) growth of SiO2/GNPs. The decrease of the SERS-activity was proportional to the H2O2 scavenging activity of the antioxidant. The results showed that tannic acid had a much higher H2O2 scavenging activity than that of L-apple acid.
1. Introduction
The importance of evaluating the antioxidant activity has been widely reported in the past two decades not only for the extensive application of antioxidants in food industry and food nutriology, but also because of the discoveries of the strong correlations between reactive oxygen species (ROS) and many pathogenesis of human diseases,1,2e.g. nervous system injuries,3 atherosclerosis and cancer.4,5Hydrogen peroxide (H2O2), a key part of ROS, is generated in vivo under physiological conditions by peroxisomes (a kind of oxidative enzyme including glucose oxidase and D-amino acid oxidase) and superoxide dismutase which catalyze the dismutation of superoxide radicals. Along with superoxide anion radical (O2˙−), H2O2 can damage many cellular components and further convert into more ROS such as hydroxyl radical. Thus, the evaluation of H2O2 scavenging activity is an important part for assessing the ROS scavenging activity. Generally, the evaluation of H2O2 scavenging activity is peroxidase based or enzyme-free but biomarker dependent.1,6,7 Many methodologies based on different mechanisms have been developed for detecting H2O2 and/or H2O2 scavenging activity, e.g. chemiluminescence (CL),2,7fluorometry,6colorimetry,2,6cyclic voltammetry (CV),1 electro spin resonance (ESR),1etc. However, for the peroxidase-based approach, many compounds can be served as a substrate for the peroxidase enzyme, resulting in error assessment. On the other hand, the biomarker dependent methods require a complicated sample preparation process and it is time consuming.1,6 Another common method for assessing the H2O2 scavenging activity is based on the intrinsic absorbance value of H2O2 at 230 nm,8,9 which will decrease when H2O2 is scavenged by antioxidants. However, the antioxidants may also have an absorbance range at 230 nm which depress the precision and the accuracy of this method.1 Therefore, it is still a challenge to develop a novel approach with high sensitivity, high speed, low cost, and easy operation to detect the H2O2 scavenging activity.
Many materials, such as quantum dots, metal nanoparticles and polymer spheres have been utilized for the detection of H2O2 scavenging activity.10–13Gold nanoshells (GNSs), a layered dielectric core coated with a gold shell, have gained extensive attentions as they show charming tunable optical properties and good biocompatibility.14–16 Many applications of GNSs have been reported, e.g. whole blood immunoassays, optical triggerable drug delivery, photothermal cancer therapy.17–20 Besides their tunable optical properties, a great enhancement of Raman scattering cross-section of adsorbed molecules can be achieved by applying GNSs as surface-enhanced Raman scattering (SERS) substrates.21,22 The SERS is a new powerful analytical technique with ultrahigh sensitivity.23–27 In addition to the “whole-finger-prints” information and the low water background, SERS has high signal enhancement and fluorescence quenching effects, which are extremely desirable for the biological sample analysis. Because of its unique attributes, SERS has been used in a wide range of fields, including homeland security,27food safety,28 clinical diagnosis,29,30 trace detection,23,31 chemical and biochemical monitoring,32–34etc., since it was discovered in the late 1970s.35–37 However, the significance and potential applications of the SERS-activity changes during the SERS substrates forming process are often neglected.
In the present work, we first studied the changing trend of the SERS-activity of the gold nanoshell precursor nanocomposites (SiO2/GNPs) upon treatment with different concentrations of H2O2. Then, we developed a new enzyme-free method for assessing H2O2 scavenging activity by applying SiO2/GNPs as SERS nanoprobes. The SiO2/GNPs were produced by adsorbing ultrasmall gold nanoparticles (GNPs) onto the silica core surface. H2O2 can reduce AuCl4− to Au0 and enlarge the GNPs, mediating the growth of SiO2/GNPs. During the growth process, the SERS-activity of the SiO2/GNPs with different enlargement conditions manifested an obvious change concomitant with the increase of gold coverage on the silica cores, which was quantitatively correlated with the concentration of H2O2 used. The presence of antioxidant with H2O2 scavenging activity would prevent the H2O2-mediated growth of SiO2/GNPs and caused a drop in SERS-activity. The decrease of the SERS-activity was proportional to the H2O2 scavenging activity of the antioxidant. The method presented here is simple to design; furthermore, it embraces the advantages of SERS which are extremely desirable for the biological sample analysis.
2. Experimental section
2.1 Materials and reagents
3-(Aminopropyl)-triethoxysilane (APTES, 98%) and Silica colloidal spheres (∼110 nm) were obtained by Sigma and Nissan Chemical Ind., Ltd., Japan, respectively. Sodium borohydride (NaBH4), hydrogen peroxide (H2O2, 30%), chloroauric acid terahydrate (HAuCl4·4H2O), potassium carbonate (K2CO3), and anhydrous ethanol were bought from Nanjing Sunshine Biotechnology Ltd., China. Niel blue A sulfate (NBA) was purchased from Sigma-Aldrich. Tannic acid and L-apple acid (L-malic acid) were purchased from Shanghai Aladdin Chemical Ltd., China. All of the chemical reagents were analytical grade and used without further purification. K2CO3/HAuCl4 solution (K–H growth solution) was prepared by adding 3 mL of 1% (W V−1) HAuCl4·4H2O stock solution into 98.5 mL of aqueous K2CO3 solution (0.5 g L−1) under continuous stirring for 20 min and then aged in the dark at 4 °C for 1 day. H2O used in the experiments was prepared by Milli-Q system (resistivity >18 MΩ).
2.2 Synthesis of GNPs
GNPs (∼5 nm) were prepared by the reduction of HAuCl4 with NaBH4 as described elsewhere.16 Briefly, 3 mL of 1% (W V−1) HAuCl4·4H2O was mixed with 200 mL of H2O under vigorous stirring for about 5 min, followed by the addition of 1 mL of K2CO3 (0.2 M). Then, 9 mL of freshly prepared NaBH4 (0.5 mg mL−1) was quickly added to the mixture. The mixture would turn into wine red rapidly, which indicated the generation of GNPs. The obtained solution was stored at 4 °C until use.
2.3 Preparation of SiO2/GNPs
SiO2/GNPs, the precursors of GNSs, were prepared as reported previously with some modifications.38 Firstly, 39 mL of monodisperse silica colloidal spheres (0.013 g mL−1 in ethanol) were amino-functionalized by mixing with 60 μL of APTES under vigorous stirring by magnetic bar at 70 °C for 3 h. In order to remove the excess reactants, the solution was centrifuged for 3 times and redispersed in ethanol. Then, 550 μL of pure APTES-functionalized silica spheres (0.043 g mL−1) were redispersed in 15 mL of ethanol and added dropwise to 200 mL of as-prepared colloidal GNPs with vigorous stirring. The GNPs were attached onto the surface of silica nanoparticles to form SiO2/GNPs nanocomposites. After centrifugation and removal of the supernatant for three times, pure SiO2/GNPs were obtained and redispersed in H2O. The peak absorbance (ca. 532 nm) of the obtained SiO2/GNPs solution was adjusted to 0.5 for use. The prepared SiO2/GNPs nanocomposites can be dispersed homogeneously in solvents such as water and ethanol for more than 1 month at 4 °C.
2.4
H2O2-mediated growth of SiO2/GNPs
Firstly, 3.2 mL of H2O was mixed with 0.5 mL of SiO2/GNPs solution and 3 mL of as-prepared K–H growth solution for 2 min. Then, 100 μL of H2O2 was added under gently shaking. After 15 min, the UV/Visible absorption spectra of the resultant solution were performed on a Shimadzu UV3150 UV-vis-NIR spectrophotometer in absorbance mode. To study the growth process of GNSs, the concentration of H2O2 was varied from 0 μM to 400 μM. A Zeiss ULTRA-plus scanning electron microscope (SEM) was used to image the morphology of SiO2/GNPs or GNSs at different stages of the shell forming operated at 15 kV.
2.5
H2O2 scavenging activity detection assay
Typically, 3 mL of H2O was mixed with 200 μL of antioxidant solution and 100 μL 17 mM H2O2 (250 μM in the final reaction solution which was 6.8 mL). After incubating for 2 min, 0.5 mL of SiO2/GNPs solution and 3 mL of as-prepared K–H growth solution were added and mixed under gently shaking at room temperature for 15 min. In order to remove the residual reactants, the solution was processed using centrifugation for 2 times (3000 rpm, 20 min) and the deposition was redispersed to 0.68 mL (The original solution was 6.8 mL before centrifuging.) A control experiment was tested by adding 200 μL of water instead of the antioxidant solution.
2.6
SERS measurements
In order to determine the SERS-activity of the GNSs, 0.5 mL 10 μM NBA was added into 0.5 mL GNSs solution and then incubated for half an hour before the Raman experiments. A Renishaw Invia Reflex system (equipped with a Peltier-cooled charge-coupled device (CCD) detectors and a Leica confocal microscope) was used to carry Raman experiments. Samples were excited with a 785 nm diode laser (∼0.6 mW) under linefocus mode and a grating of 1200 l mm−1 was used. The exposure time was 10 s. The laser was focused onto the sample surface by using a 50× long working distance objective. All Raman experiments were carried out at room temperature (∼20 °C). Every Raman spectrum was averaged from 5 measurements. All experiments were performed in triplicate and values were averaged. Results were given as means ± the standard deviation (SD).
3. Result and discussion
3.1
H2O2-mediated growth of GNSs
It has been reported that many chemical reagents, e.g.formaldehyde, hydroxylamine-hydrochloride and sodium borohydride, could mediate the growth and generation of GNSs.39 Our group has revealed that H2O2 could also reduce AuCl4− to Au0 and enlarge the GNPs on the SiO2/GNPs surface.38Scheme 1 outlines the main process of the GNSs formation. The ultrasmall GNPs are first attached onto the APTES-functionalized silica surface to form SiO2/GNPs. The pre-adsorbed GNPs will act as nucleation sites for gold deposition. The gold is then selectively reduced onto these GNPs by H2O2, causing the GNPs seeds to grow larger and coalesce gradually to form gold island clusters or complete GNSs (Scheme 1SiO2/GNPs to Complete GNSs).
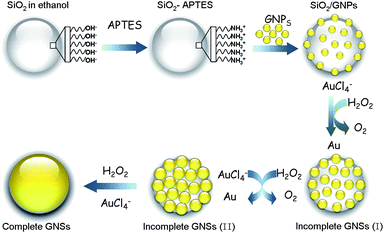 |
| | Scheme 1 Schematic illustration of the H2O2-mediated GNSs formation process | |
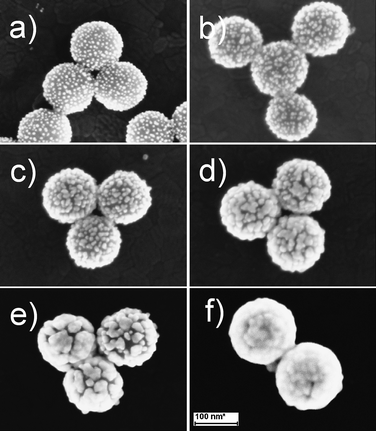
Fig. 1 shows a set of SEM images of GNSs that is produced by different concentration of H2O2. It can be seen clearly that there were numerous GNPs (∼5 nm in diameter) on the APTES-functioned silica surface (Fig. 1a), making up the SiO2/GNPs nanocomposites. The gold coverage of SiO2/GNPs precursor was about 25% (obtained from SEM images). As the concentration of H2O2 increased, more AuCl4− was reduced onto the GNPs on the silica surface, the gaps/interstices between GNPs became narrower and finally coalesced (Fig. 1b–f). Once complete GNSs forms, the additional deposition of gold only caused the increase of the outer shell thickness and the decline in the core-radius/shell-thickness ratio of GNSs. The H2O2-mediated growth process was confirmed by the localized surface plasmon study, whose plasmon peak shifted from 532 nm to 760 nm as the concentration of H2O2 increased from 0 μM to 400 μM, as shown in Fig. 2.
 |
| | Fig. 1
SEM images of GNSs produced by different concentrations of H2O2: a) 0 μM, b) 25 μM, c) 50 μM, d) 150 μM, e) 250 μM, f) 400 μM. The concentration of the H2O2 here means the concentration in the final reaction solutions (6.8 mL). The scale bar for the SEM images was 100 nm. | |
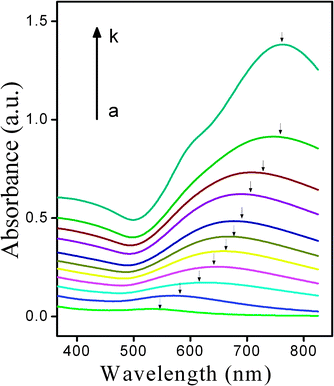 |
| | Fig. 2
Absorption spectra of the SiO2/GNPs after incubating with different concentration of H2O2 for 15 min (from a to k: 0, 25, 50, 75, 100, 125, 150, 200, 250, 300 and 400 μM). | |
3.2 SERS-activity of GNSs with different enlargements
Concomitant with the increase of gold coverage on the silica cores, the SERS-activity of GNSs exhibited a pronounced change, which quantitatively correlated with the concentration of H2O2 (Fig. 3). In order to demonstrate the SERS-activity of the SiO2/GNPs or GNSs, 5 μM Nile blue A sulfate (NBA) was chosen as Raman probe molecule. The higher the SERS intensity, the stronger the SERS-activity of the GNSs. Fig. 3a shows the SERS spectra of gold nanoshell solutions that were produced by different concentrations of H2O2. The spectra present the characteristic Raman shifts of NBA at 592 cm−1 and 1638 cm−1, whose modes were formed by positively charged nitrogen.40 Because of the high specificity and the relative strong intensity in the spectrum, we took the 592 cm−1 mode of NBA as reference mode for quantitative analysis and the SERS intensity referred in this work meant the intensity of the 592 cm−1 mode unless specified. The plot of SERS intensity against the H2O2 concentration that was used to form GNSs is presented in Fig. 3b–c. As can be seen, the SERS intensity went up monotonically until it reached its peak at ∼42![[thin space (1/6-em)]](https://www.rsc.org/images/entities/char_2009.gif) 000 counts when 250 μM H2O2 was used. However, if the concentration of H2O2 increased further (400 μM), the SERS intensity would decrease contrarily. The results indicated that the SERS intensity of Raman probe molecule correlated well with the concentration of H2O2 used to form gold nanoshell substrates in the range of 0–250 μM. Remarkably, even a slight variation of H2O2 (less than 5 μM) was enough to lead to a distinguishable change of the SERS intensity. Compared with the conventional method for measuring H2O2, which is based on the intrinsic absorbance value of H2O2 at 230 nm,1,8,9 our SERS-based method was more sensitive. The effective test range for our method was 0–250 μM.
000 counts when 250 μM H2O2 was used. However, if the concentration of H2O2 increased further (400 μM), the SERS intensity would decrease contrarily. The results indicated that the SERS intensity of Raman probe molecule correlated well with the concentration of H2O2 used to form gold nanoshell substrates in the range of 0–250 μM. Remarkably, even a slight variation of H2O2 (less than 5 μM) was enough to lead to a distinguishable change of the SERS intensity. Compared with the conventional method for measuring H2O2, which is based on the intrinsic absorbance value of H2O2 at 230 nm,1,8,9 our SERS-based method was more sensitive. The effective test range for our method was 0–250 μM.
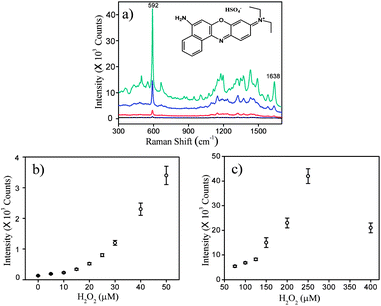 |
| | Fig. 3 a) SERS spectra of GNSs produced by different concentrations of H2O2: 25 μM; 50 μM; 150 μM and 250 μM from bottom upwards. b) and c): Plot of the SERS intensity of Nile blue A sulfate (NBA) against the concentration of H2O2. Each spectrum was averaged from 5 measurements. The samples were excited with a 785 nm laser and with 10 s exposure time. The concentration of the Raman probe molecule, NBA, was 5 μM. | |
3.3 Raman enhance effect of the gaps/interstices on the shell surface
Since the SERS phenomenon was discovered, many theories have been proposed for its explanation and two of them are currently used. One is called “electromagnetic enhancement” (EM) which was proposed by Albrecht and Creighton;36 the other is named “charge transfer enhancement” or “chemical enhancement” which was proposed by Jeanmaire and Van Duyne.37 From the point of view of EM theory, the SERS phenomenon depends intimately on the localized surface plasmons of metal nanostructures which are excited by the incident laser. The enhancement factor (EF) of GNSs with a core radius of r and an outer shell thickness of R can be approximatively estimated from the expression reported by Kerker et al.,21,41| | | G = | (1 + 2g0) (1 + 2g) |2, | (1) |
where g0 and g are polarizability factors of the nanoshell at the excitation frequency and the Raman scattering frequency, respectively; and g is given as:| | 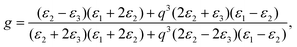 | (2) |
where ε1, ε2 and ε3 are dielectric constants of the core, the outer layer metallic shell and the surrounding medium, respectively; q = r/(r + R). The g0 has a similar expression. The calculated EFs of the GNSs were ca. 203, 185 and 145 (with 18 nm, 20 nm and 30 nm shell thickness on a 110 nm core, respectively). An experimental dielectric function of gold was used in the calculations.42 The excitation laser was 785 nm. The calculated EFs were for the 592 cm−1 scattering mode. If the enhancement was entirely due to the local electromagnetic field, the EFs should decrease by 8.9% and 28.6% when the metal shell grows from 18 nm to 20 nm and 30 nm, respectively. However, the EF we obtained in the experiment increased by 113.3% and 40% from 18 nm to 20 nm and 30 nm shell thickness. This was not a big surprise as the Kerker's expression was based on a model with an ideal smooth surface. We suggested that the “hot spots” in the gaps/interstices on the shell surface contributed a lot to the total SERS enhancement. During the growth process of GNSs, the effect of the gaps/interstices on the enhancement should first increase as they become narrower which was preferred for the amplification of the local electromagnetic fields, then decreased because these “hot spots” area was sealed off by the further deposition of Au. This may be the main reason for the tendency of the SERS-activity changes (first increase and then decrease) in the growth process of GNSs.
3.4
Detection of
H2O2 scavenging activity
After studying the correlation between the SERS-activity of GNSs and the concentration of H2O2 used, we determined the H2O2 scavenging activity of two antioxidants, tannic acid and L-apple acid, by restraining the H2O2-mediated formation of GNSs from SiO2/GNPs. Briefly, the H2O2 used to form GNSs, with a final concentration of 250 μM, was first mixed with a certain amount of antioxidant before the forming process (Scheme 2a). Since the H2O2 was scavenged by the antioxidant, the growth of the SiO2/GNPs would be inhibited, leading to a drop of the SERS-activity (Scheme 2b). By studying the change of the SERS-activity, we can estimate the H2O2 scavenging activity (SAHP) of antioxidants. Briefly, in order to get the SAHP value, the obtained SERS intensity was first presented as the percentage of SERS inhibition IS–A by applying the following equation: IS–A = ΔI/I0 (%), I0 was the difference of SERS intensities of the Raman probe molecule by applying the SiO2/GNPs and the GNSs produced with 250 μM H2O2 as SERS substrates; ΔI was the difference of SERS intensities of Raman probe molecule by applying the GNSs produced with and without antioxidants as SERS substrates (Scheme 2b). The amount (concentration) of antioxidant to provoke 50% reduction in SERS-activity (SERS intensity here) was named IC50 (when IS–A = 50%). By plotting IS–A against the concentration of antioxidant and then fitting it with an appropriate equation, we could get the IC50 of the antioxidant approximately. Finally, the H2O2 scavenging activity, defined as SAHP = 1/IC50 and expressed as μM−1, could be obtained.
![a) Schematic diagram of the methodology for detecting H2O2 scavenging activity: GNSs produced with [GNSs (I)] or without antioxidant [GNSs (II)]. b) SERS spectra of the Raman probe molecule by applying different substrates: SiO2/GNPs, GNSs (I) and GNSs (II) from bottom upwards.](/image/article/2011/AY/c0ay00629g/c0ay00629g-s2.gif) |
| | Scheme 2 a) Schematic diagram of the methodology for detecting H2O2 scavenging activity: GNSs produced with [GNSs (I)] or without antioxidant [GNSs (II)]. b) SERS spectra of the Raman probe molecule by applying different substrates: SiO2/GNPs, GNSs (I) and GNSs (II) from bottom upwards. | |
Fig. 4a shows the SERS spectra of different gold nanoshell solutions produced by 250 μM H2O2 together with different concentrations of L-apple acid. As can be seen, the SERS intensity decreased gradually as the concentration of L-apple acid increased, which indicated the inhibition of H2O2-mediated growth of GNSs. This was confirmed by Fig. 5, which shows the SEM images of GNSs produced by 250 μM H2O2 together with 50 μM (Fig. 5a) and 200 μM (Fig. 5b) L-apple acids. The relationship between the SERS intensity and the concentrations of L-apple acid is presented in Fig. 4b as triangular markers. A correlation between IS–A and L-apple acid concentration is plotted as dots in Fig. 4b. The solid curve was a fitting IS–A curve which can be done by many scientific softwares such as ORIGIN and MATHEMATICA (we found that the relationship between IS–A and L-apple acid concentration fitted well with the exponential associate function). From the fitting curve, one can obtain the IC50 value of the antioxidant and then the SAHP value. Based on the detection protocol described above, the effective test concentration range for L-apple acid was 5–500 μM, the IC50 value was 150 μM and the SAHP value was 6.67 × 10⁻³ μM−1. By the same token, we detected the H2O2 scavenging activity of tannic acid and we got the effective test concentration range for tannic acid as 5–200 μM, the IC50 value as 8.2 μM and the SAHP value as 122 × 10−3 μM−1 (Fig. 3c and 3d; interestingly, the exponential associate function was also the best fitting function for IS–A).
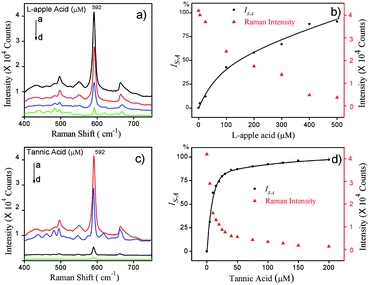 |
| | Fig. 4 a) and c): SERS spectra of GNSs produced by using 250 μM H2O2 together with a different concentration of antioxidants: a) L-apple acid: 0 μM, 50 μM, 300 μM, 500 μM from a to d, and c) tannic acid: 0 μM, 5 μM, 50 μM, 200 μM from a to d. b) and d): The SERS intensity of NBA (triangular marker) and IS–A (dots) against the concentration of b) L-apple acid and d) tannic acid. The solid curves in b) and d) were the fitting curves. The concentration of the Raman probe molecule was 5 μM. | |
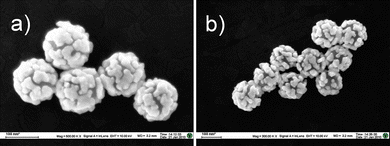 |
| | Fig. 5
SEM images of the GNSs restrained by a) 50 μM and b) 200 μM L-apple acid. | |
The results shown here indicated that tannic acid expressed superior H2O2 scavenging activity than L-apple acid. That was not a big surprise, because it has been reported that the H2O2 scavenging activity may have a relationship with the chemical structures and in particular the number of hydroxyl group.7,43,44Fig. 6 shows the chemical structure of tannic acid and L-apple acid. Tannic acid has much more hydroxyl groups than that of L-apple acid. Both of them are naturally occurring antioxidants and have been universally used in daily foodstuff. Tannic acid is found in seeds and/or barks of many plants and L-apple acid is found in lots of vegetables and fruits. Ingestion of these antioxidants may keep the balance between antioxidants and oxidants in living organisms, and lower the probability of cardiovascular disease and cancer.45 Frankel and Meyer have pointed out that a single assay is insufficient for the accurate assessment of multifunctional antioxidants and more than one method is needed to provide adequate information on evaluation, as different antioxidants respond with variable behavior in tests performed under different conditions.46 Thus, the method reported here may serve as an additional means for assessing the activities of multifunctional antioxidants.
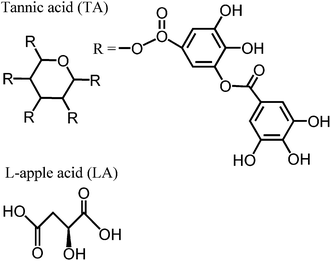 |
| | Fig. 6 Chemical structures of tannic acid and L-apple acid. | |
4. Conclusion
In conclusion, we have introduced the Raman spectroscopy technique to detect the H2O2 and H2O2 scavenging activity by applying SiO2/GNPs as SERS nanoprobes. The H2O2 scavenging activities of tannic acid and L-apple acid were tested in our study. The results showed that tannic acid expressed superior H2O2 scavenging activity than L-apple acid. The sensitivity of the SERS-based method was less than 5 μM; furthermore, our method embraced the advantages of SERS which were extremely desirable for biological sample analysis. Additionally, we emphasized that the gaps/interstices on the GNSs surface played an important role in the SERS enhancement. Another purpose is to attract attention to the importance and the potential applications of SERS-activity change in the SERS probes/sensors design.
5. Acknowledgement
We gratefully acknowledge support from the National Natural Science Foundation of China (Grant 90923010), Ministry of Science & Technology of China (Grants 2007AA022007 and 2008DFA51180) and Specialized Research Fund for the Doctoral Program of Higher Education of China (Grant 20090092110026).
Notes and references
- L. M. Magalhaes, M. A. Segundo, S. Reis and J. L. Lima, Anal. Chim. Acta, 2008, 613, 1–19 CrossRef CAS.
- L. G. Wood, P. G. Gibson and M. L. Garg, J. Sci. Food Agric., 2006, 86, 2057–2066 CrossRef CAS.
- N. Delanty and M. A. Dichter, Acta Neurol Scand., 1998, 98, 145–153 CrossRef CAS.
- H. Esterbauer, R. Schmidt and M. Hayn, Adv. Pharmacol., 1997, 38, 425–455 Search PubMed.
-
K. H. Cheeseman, Lipid peroxidation and cancer. In: DNA and Free Radicals, (ed.: B. Halliwell and O. I. Aruoma), New York and London: Ellis Horwood, 1993, pp 109–144 Search PubMed.
- M. Pazdzioch-Czochra and A. Widenska, Anal. Chim. Acta, 2002, 452, 177–184 CrossRef CAS.
- A. Arnous, C. Petrakis, D. P. Makris and P. Kefalas, J. Pharmacol. Toxicol. Methods, 2002, 48, 171–177 CrossRef CAS.
- R. F. Beers and I. W. Sizer, J. Biol. Chem., 1952, 195, 133–140 CAS.
- R. J. Ruch, S. J. Cheng and J. E. Klaunig, Carcinogenesis, 1989, 10, 1003–1008 CrossRef CAS.
- H. Jiang and H. X. Ju, Anal. Chem., 2007, 79, 6690–6696 CrossRef CAS.
- H. K. Lee, K. Lee, I. K. Kim and T. G. Park, Adv. Funct. Mater., 2009, 19, 1–7.
- J. Wang, N. D. Zhou, Z. Q. Zhu, J. Y. Huang and G. X. Li, Anal. Bioanal. Chem., 2007, 388, 1199–1205 CrossRef CAS.
- S. H. Kim, B. Kim, V. K. Yadavalli and M. V. Pishko, Anal. Chem., 2005, 77, 6828–6833 CrossRef CAS.
- S. J. Oldenburg, R. D. Averitt, S. L. Westcott and N. J. Halas, Chem. Phys. Lett., 1998, 288, 243–247 CrossRef CAS.
- Y. Wang, W. P. Qian, Y. Tan and S. H. Ding, Biosens. Bioelectron., 2008, 23, 1166–1170 CrossRef CAS.
- S. H. Ding, W. P. Qian, Y. Tan and Y. Wang, Langmuir, 2006, 22, 7105–7108 CrossRef CAS.
- L. R. Hirsch, J. B. Jackson, A. Lee, N. J. Halas and J. L. West, Anal. Chem., 2003, 75, 2377–2381 CrossRef CAS.
- S. R. Sershen, S. L. Westcott, N. J. Halas and J. L. West, J. Biomed. Mater. Res., 2000, 51, 293–298 CrossRef CAS.
- D. P. O'Neal, L. R. Hirsch, N. J. Halas, J. D. Payne and J. L. West, Cancer Lett., 2004, 209, 171–176 CrossRef CAS.
- L. R. Hirsch, R. J. Stafford, J. A. Bankson, S. R. Sershen, B. Rivera, R. E. Price, J. D. Hazle, N. J. Halas and J. L. West, Proc. Natl. Acad. Sci. USA, 2003, 100, 13549–13554 CrossRef CAS.
- M. Kerker and C. G. Blatchford, Phys. Rev. B, 1982, 26, 4052–4063 CrossRef CAS.
- C. E. Talley, J. B. Jackson, C. Oubre, N. Grady, T. Huser, C. Hollars, S. Lane, P. Nordlander and N. J. Halas, Nano Lett., 2005, 5, 1569–1574 CrossRef CAS.
- S. Nie and S. R. Emory, Science, 1997, 275, 1102–1106 CrossRef CAS.
- K. Kneipp, H. Kneipp, I. Itzkan, R. R. Dasari and M. S. Feld, Chem. Rev., 1999, 99, 2957–2976 CrossRef CAS.
- C. McDonagh, C. S. Burke and D. D. MacCraith, Chem. Rev., 2008, 108, 400–422 CrossRef CAS.
- N. P. W. Pieczonka, G. Moula and R. F. Aroca, Langmuir, 2009, 19, 11261–11264 CrossRef.
- R. S. Golightly, W. E. Doering and M. J. Natan, ACS Nano, 2009, 3, 2859–2869 CrossRef CAS.
- M. Lin, L. He, J. Awika, L. Yang, D. R. Ledoux, H. Li and A. Mustapha, J. Food Sci., 2008, 73, 129–134.
- X. Qian, X. H. Peng, D. O. Ansari, Q. Yin-Geon, G. Z. Chen, D. M. Shin, L. Yang, A. N. Young, M. D. Wang and S. Nie, Nat. Biotechnol., 2008, 26, 83–90 CrossRef CAS.
- M. Culha, D. Stokes, L. R. Allain and T. Vo-Dinh, Anal. Chem., 2003, 75, 6196–6201 CrossRef CAS.
- K. E. Shafer-Peltier, C. L. Haynes, M. R. Gluksberg and R. P. Van Duyne, J. Am. Chem. Soc., 2003, 125, 588–593 CrossRef CAS.
- R. J. Dijkstra, W. J. J. M. Scheenen, N. Dam, E. W. Roubos and J. J. Ter Meulen, J. Neurosci. Methods, 2007, 159, 43–50 CrossRef CAS.
- C. S. Levin, B. G. Janesko, R. Bardhan, G. E. Scuseria, J. D. Hartgerink and N. J. Halas, Nano Lett., 2006, 6, 2617–2621 CrossRef CAS.
- K. Hyunhyub, S. Singamaneni and V. V. Tsukruk, Small, 2008, 4, 1576–1599 CrossRef CAS.
- M. Fleischmann, P. J. Hendra and A. J. McQuillan, Chem. Phys. Lett., 1974, 26, 163–166 CrossRef CAS.
- M. G. Albrecht and J. A. Creighton, J. Am. Chem. Soc., 1977, 99, 5215–5217 CrossRef CAS.
- D. L. Jeanmaire and R. P. Van Duyne, J. Electroanal. Chem., 1977, 84, 1–20 CrossRef CAS.
- F. Kong, H. Liu, J. Dong and W. Qian, Biosens. Bioelectron., 2010 DOI:10.1016/j.bios.2010.03.029.
- B. E. Brinson, J. B. Lassiter, C. S. Levin, R. Bardhan, N. Mirin and N. J. Halas, Langmuir, 2008, 24, 14166–14171 CrossRef CAS.
- G. M. do Nascimento and M. L. A. Temperini, J. Raman Spectrosc., 2008, 39, 772–778 CrossRef.
- M. Kerker, Acc. Chem. Res., 1984, 17, 271–277 CrossRef.
- P. B. Johnson and R. W. Christy, Phys. Rev. B, 1972, 6, 4370–4379 CrossRef CAS.
- R. Pulido, L. Bravo and F. Saura-Calixto, J. Agric. Food Chem., 2000, 48, 3396–3402 CrossRef CAS.
- R. Scherer and H. T. Godoy, Food Chem., 2009, 112, 654–658 CrossRef CAS.
- R. L. Prior, X. L. Wu and K. Schaich, J. Agric. Food Chem., 2005, 53, 4290–4302 CrossRef CAS.
- E. N. Frankel and A. S. Meyer, J. Sci. Food Agric., 2000, 80, 1925–1941 CrossRef CAS.
|
| This journal is © The Royal Society of Chemistry 2011 |
Click here to see how this site uses Cookies. View our privacy policy here.