High-precision GC-TCD for verification of gravimetrically prepared primary gas standards of oxygen in nitrogen
Takuya
Shimosaka
*,
Nobuhiro
Matsumoto
and
Kenji
Kato
National Metrology Institute of Japan, National Institute of Advanced Industrial Science and Technology, 1-1-1 Umezono, Tsukuba, Ibaraki 305-8563, Japan. E-mail: t-shimosaka@aist.go.jp
First published on 1st December 2010
Abstract
Gravimetric preparation method is one of the most precise and accurate methods for preparing primary standard gas mixtures (PSMs). Although the principle and execution of the gravimetric method are not complicated, the uncertainty of the gravimetric method is so small that a seemingly minor error can result in an incorrect amount fraction of the PSM. Therefore, verifying the amount fraction of the PSMs is a necessary step. We perform a high-precision comparison between the PSMs of oxygen in nitrogen (∼100 µmol per mol) using a well-stabilized gas chromatograph with a thermal conductivity detector (GC-TCD) system in conjunction with high-precision pressure monitoring for sample amount correction and a quality-control cylinder technique in which the PSMs were analyzed against a reference cylinder, which leads to the cancellation of the drift in the sensitivity of the GC-TCD. After optimization of the measurement conditions, the relative expanded uncertainty reaches 0.022% (coverage factor k = 2), which is equivalent to the uncertainty of the PSMs. The Consultative Committee for Amount of Substance of the Comité International des Poids et Mesures performed a key comparison CCQM-K53, in which one of the PSMs used in this work was compared and agreed well with PSMs prepared by other National Metrology Institutes. These results show that the GC-TCD system developed in this work is sufficiently reliable, precise and accurate to verify PSMs.
Introduction
Most gas analysis instruments such as gas chromatographs, non-dispersive infrared sensors (NDIR) and Fourier-transform infrared spectrometers (FT-IR) are calibrated with standard gases. Highly precise analysis, such as that for greenhouse gas concentrations, requires calibrations by standard gases with high accuracy as well as gas measuring systems with high precision and stability.1 In the report of 13thWMO/IAEA meeting of experts, inter-laboratory comparability, which is defined as the mean difference between two sets of measurements, is recommended to be less than 0.1 µmol per mol for carbon dioxide standard gases and to be less than 4.8 µmol per mol for oxygen standard gases.2 The standard gases play a key role in achieving a reliable comparison. To prepare the primary standard gas mixtures (PSMs), the gravimetric method in accordance with ISO/IEC 6142 (2001) is often used because it is one of the most precise and accurate methods available.3In the gravimetric method, PSMs are prepared by diluting parent gases with high purity gases (matrix gases) such as nitrogen, helium, or air into high-pressure cylinders. The amount fraction of the PSM is evaluated by weighing the parent and matrix gases, the amount fraction of each constituent of the parent gases and the molar mass of the constituents, as shown in Fig. 1. The purity analysis of the matrix gases is another contributor to the calculation of the amount fraction of each species in the mixture. The uncertainty in the weighing, which is a dominant factor in the uncertainty within the gravimetric preparation method, is typically several mg and the relative uncertainty of the PSMs is typically 0.05–0.005%.4,5 For example, to prepare a 100 µmol per mol PSM, two or three steps of the gravimetric dilution processes are necessary. Because of the law of propagation of uncertainty, the uncertainty in the 100 µmol per mol PSM increases approximately by a factor of the square root of a number of steps, so the precision of the gas is still more precise than that of the usual gas-analysis instruments.
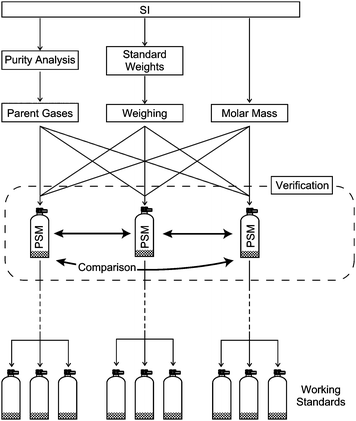 | ||
| Fig. 1 Diagram of metrological traceability hierarchy. Uncertainty of the PSM results from the amount fraction of the parent gases including purity analysis of the pure gases, molar mass, weighing the filled gases and verification of the PSMs with the high-precision method. Working standards are traceable directly or via transfer standards to the PSMs. | ||
When the components are unstable, the verification of the amount fraction of the PSM is required because it is supposed that the components tend to react with other components and to adsorb on the inner wall of the cylinder. Though the components are unreactive and non-adsorptive, it becomes necessary to verify the amount fraction of the PSM because the amount fraction calculated from weighing the filled gases is occasionally incorrect because of accidents in the preparation of the PSMs.3 While a working standard gas is verified or calibrated by a superior standard gas, the PSM cannot be verified by the other standard gases because they are the most superior gases available within the metrological traceability system. One of the ways to verify PSMs is to compare three or more independently prepared PSMs with each other using a high-precision analytical method, as shown in Fig. 1.6 If the ratio between the signal intensity and the amount fractions of the PSMs is constant with an uncertainty smaller than the uncertainty in the amount fractions and measurement, the amount fractions calculated from the preparation method are considered to be valid.
For a conservative estimation, the uncertainty in PSMs often includes the uncertainty in the verification method as well as the uncertainty in the preparation method.7 When the uncertainty in the verification method is large, the uncertainty of the PSM becomes large although the preparation method is very precise. To exploit the advantages of the gravimetric preparation method, the uncertainty of the verification method must be smaller than that of the preparation, which makes a high-precision verification method a key to developing the PSMs.
The most promising analyzer for the precise verification method is a gas chromatograph with a thermal conductivity detector (GC-TCD), which was used to compare the PSMs under the auspices of the Consultative Committee for Amount of Substance (CCQM) of the Comité International des Poids et Mesures.8–10 Although TCDs are less sensitive than other detectors for gas chromatography, it offers important advantages for verifying PSMs: namely, the availability of well-established equipment with good stability and non-selectivity for many gas species. A TCD is also insensitive to the isotope ratio, especially 13C/12C, which often affects the result of CO and CO2 analyses by NDIR.11 Therefore, GC-TCD is a proper verification method for PSMs, which explains why it was used for the international comparisons between the National Metrology Institutes.
In this article, we report on the development of a high-precision GC-TCD system to verify the amount fraction of PSMs. We also discuss the conditions required to minimize the uncertainty inherent in the GC-TCD system. The uncertainty of the GC-TCD system is evaluated, following which five primary oxygen standard gas mixtures with an amount fraction of 100 µmol per mol (prepared by the gravimetric method) are compared with each other using the GC-TCD system to verify these amount fractions calculated from the results of the weighing.
Experimental
GC-TCD
A schematic diagram of the gas chromatographic system, which comprised of a gas chromatograph with a well-stabilized TCD (GC2014-super, Shimadzu, Japan) and a mass flow controller (Horiba-STEC, SEC-V110DM, 1 SLM), is shown in Fig. 2. Two columns (molecular sieves 5 Å, 60/80 mesh, 2 m) separate oxygen from the matrix gas (nitrogen). Six-way and 10-way valves and a sample loop (5 ml) are in the GC oven whose temperature was set to 45 °C. Automatic pressure controllers (APC) ensured a constant flow of the helium carrier gas (Alpha 2, Japan Air Gases, Japan), whose flow rate was about 35 ml min−1 when APC1 was set to 300 kPa. The sample gas flow rate was controlled by the mass flow controller. The needle valve at the exit of the sample loop restricted the sample flow to increase the sample amount and decrease the variance in the amount due to the change in atmospheric pressure. The TCD current was set at 180 mA unless otherwise specified, and its temperature was set at 80 °C. | ||
| Fig. 2 Schematic illustration of the high-precision GC-TCD system. APC: pressure controller and MFC: mass flow controller. The two main columns (MC) are molecular sieves 5 Å columns (60/80 mesh, 2 m), which are represented as meshed rectangles. | ||
Primary standard gas mixtures
The five PSMs (S1–S5) in Table 1, which are nominally 100 µmol per mol oxygen in nitrogen, were independently prepared by one of two people using the gravimetric preparation method, as shown in Fig. 3. The source gases for S1–S5 were highly pure oxygen (10 l high-pressure cylinder, >99.99995% mol per mol, G1 grade, Japan Fine Products, Japan) and nitrogen (47 l high-pressure cylinder, >99.99995% mol per mol, G1 grade, Japan Fine Products, Japan) gases. Using the gravimetric method, the oxygen gas was diluted with the nitrogen gas to prepare the five 46![[thin space (1/6-em)]](https://www.rsc.org/images/entities/char_2009.gif) 000 µmol per mol oxygen gases in nitrogen, which were parent gases of each 2100 µmol per mol oxygen gas in nitrogen in the next dilution. The 100 µmol per mol oxygen gases were prepared by dilution of the 2100 µmol per mol oxygen gases with the pure nitrogen gas. The amount fraction and its uncertainty of the 100 µmol per mol oxygen standard gases were calculated from the weighing, the amount fraction of the parent gases, the molar mass of nitrogen and oxygen, and impurities in the nitrogen and oxygen gases and their uncertainties.12 The impurities, Ar, N2, CO2, CO, CH4, and water in the oxygen gas, were determined using GC-TCD, FT-IR with a White cell (optical path length = 10 m) and a capacitance hygrometer, as were the impurities, Ar, CO2, CO, CH4, and water in the nitrogen gas. Oxygen in the nitrogen gas was determined to be (3.1 ± 0.3) nmol per mol by a coulometric sensor (Delta F, NANO Trace II), where the value following the plus–minus symbol is the expanded uncertainty (k = 2). The amount fractions of the other impurities in the nitrogen and oxygen gases were below 1 µmol per mol, which were sufficiently small to be negligible in the determination of the amount-fraction uncertainty of the 100 µmol per mol oxygen standard gases. The amount fraction and its uncertainty for gases S1–S5 are shown in Table 1. The relative expanded uncertainty (k = 2) of the amount fraction is 0.024%.
000 µmol per mol oxygen gases in nitrogen, which were parent gases of each 2100 µmol per mol oxygen gas in nitrogen in the next dilution. The 100 µmol per mol oxygen gases were prepared by dilution of the 2100 µmol per mol oxygen gases with the pure nitrogen gas. The amount fraction and its uncertainty of the 100 µmol per mol oxygen standard gases were calculated from the weighing, the amount fraction of the parent gases, the molar mass of nitrogen and oxygen, and impurities in the nitrogen and oxygen gases and their uncertainties.12 The impurities, Ar, N2, CO2, CO, CH4, and water in the oxygen gas, were determined using GC-TCD, FT-IR with a White cell (optical path length = 10 m) and a capacitance hygrometer, as were the impurities, Ar, CO2, CO, CH4, and water in the nitrogen gas. Oxygen in the nitrogen gas was determined to be (3.1 ± 0.3) nmol per mol by a coulometric sensor (Delta F, NANO Trace II), where the value following the plus–minus symbol is the expanded uncertainty (k = 2). The amount fractions of the other impurities in the nitrogen and oxygen gases were below 1 µmol per mol, which were sufficiently small to be negligible in the determination of the amount-fraction uncertainty of the 100 µmol per mol oxygen standard gases. The amount fraction and its uncertainty for gases S1–S5 are shown in Table 1. The relative expanded uncertainty (k = 2) of the amount fraction is 0.024%.
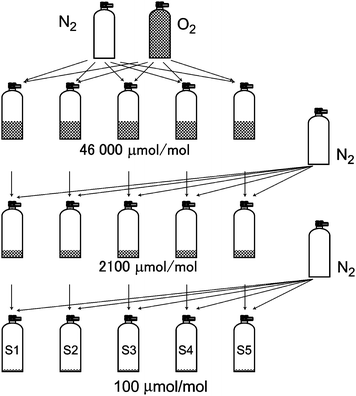 | ||
| Fig. 3 Preparation procedure for the 100 µmol per mol PSMs S1–S5. The oxygen gas was independently diluted by the nitrogen gas three times. | ||
We participated in a key comparison on the gravimetric preparation of gas at a level of 100 µmol per mol of oxygen in nitrogen (CCQM-K53).10,13 The PSM S4 was shipped and compared with other PSMs prepared by the National Metrology Institutes, and it was in agreement with the key comparison reference value (KCRV) whose relative standard uncertainty was 0.06%.
An oxygen standard gas of 95 µmol per mol (R1) was prepared using two-step dilution of oxygen with nitrogenvia the gravimetric method. The oxygen standard gas R1 was used for the repeatability test of the GC-TCD system and for a reference gas in a type of external standard methods, as mentioned below. The amount fraction and its uncertainty of the R1 gas are also listed in Table 1, and its uncertainty is larger than those of gases S1–S5.
Results and discussion
When PSMs are measured by the GC-TCD system, factors that cause variance in the peak area are the amount of the sample gas injected into the separation column, fluctuation of the chromatogram baseline, sensitivity drift of the TCD, noise from the TCD, variations in atmospheric pressure and temperature. In addition, the atmospheric pressure affects the carrier gas flow rate and the amount of the sample in the sample loop. The TCD is sensitive to the amount fraction of analytes, and not to its absolute amount; as a result, the peak area becomes larger with a decreasing flow of carrier gas. Therefore, carrier gas flow rate also influences the variance of the peak area. We discuss these factors below and try to reduce the repeatability down to the uncertainties of S1–S5 listed in Table 1. Data processing to obtain peak areas and the number of measurements are also discussed. The uncertainty in the average value is inversely proportional to the square root of the number of measurements; the number of measurements and the measuring time are also important in improving repeatability.Calculation method of peak area
The oxygen standard gas R1 was measured 10 times successively by the GC-TCD. Fig. 4 shows a typical chromatogram for R1, which shows a clear oxygen peak between 4 and 5 min. The pressure controllers i.e.APC1, APC2 and APC3 were set to 200 kPa, 100 kPa, and 200 kPa, respectively, and the exit of the sample loop was open to atmosphere. The sample gas flow rate was about 50 ml min−1. The peak area for each chromatogram was calculated using a Shimadzu GC workstation (Shimadzu GC Solution) in which the baseline start and end points of each peak were derived automatically from factors such as slope and minimum peak height. The open squares in Fig. 5 represent the result of the 10 times repeatability and the results are plotted as relative peak areas (i.e. peak areas divided by their average value). Because the peak area for the first run of successive measurements often resulted in an outlier value (Fig. 8 is a typical example), we exclude the peak area of the first run from the evaluation of the repeatability. The following results in this article were also evaluated without the first chromatogram.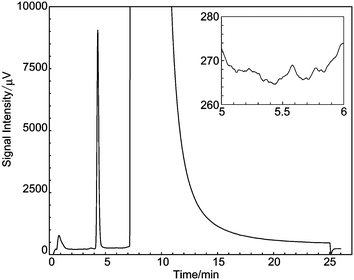 | ||
| Fig. 4 Typical chromatogram of ∼100 µmol per mol oxygen gas in nitrogen. The peak near 4 min is an oxygen peak. The chromatogram around 5.5 min is enlarged in the inset to clearly show the noise intensity. | ||
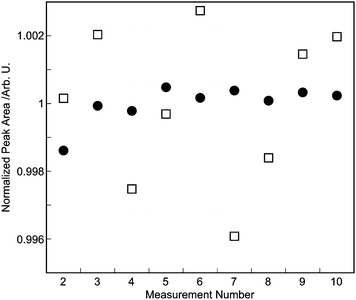 | ||
| Fig. 5 Repeatability in measurement of R1 gas by the GC-TCD. Two methods to obtain the peak areas are compared. Open squares represent peak areas calculated using the GC workstation in which the start and end points of the baseline were derived from slope and peak intensity of the chromatograms. Solid circles represent peak areas calculated using the other method in which the start and end points of the baseline were set at tr − t1 and tr + t2, respectively, where tr is retention time of the oxygen in each chromatogram. Both results were normalized by the average of the nine peak areas. The peak area for the first chromatogram is not shown. | ||
As the chromatogram forms appear smooth and mutually similar, they do not pose a problem in determining the peak area when using this ‘slope-decision’ method on the Shimadzu GC workstation. However, the relative standard deviation of the peak areas was 0.23%, which is insufficient for the verification of the PSMs.
The goal for repeatability is ∼0.01% for the verification of PSMs and a slight change in the start and end points may make a significant and advantageous change in the repeatability. Therefore, we find it necessary to calculate the peak area for a set of chromatograms using a common and objective rule so that there is no arbitrariness in the assignment of the start and end points.
To address this problem and to improve the repeatability, we define a rule in which the start and end points were fixed at tr − t1 and tr + t2, respectively, where tr is the retention time of the oxygen in each chromatograms. The times t1 and t2 are the start and end points, respectively, and they are common to all of the chromatograms in successive measurements. The result of the repeatability calculated by this common-start-end-point method is represented as solid circles in Fig. 5. The times t1 and t2 are set to 0.2 and 0.3 min, respectively. The repeatability was improved by a factor of about four by the common-start-end-point method (relative standard deviation = 0.057%), and this method is simple and effective in reducing the repeatability.
Temperature stability of GC sample loop
The temperature of the sample loop influences the sample amount injected into the GC. The temperature of the GC oven was more stable than the room temperature, so the sample loop was set in the GC oven. The GC oven temperature was set to 45 °C and the temperature was monitored at 1 second intervals. The standard deviation of the temperature was 0.014 °C, which corresponded to 0.004% relative variation of the sample amount injected into the GC. The actual variation of the sample amount is expected to be smaller because of the heat capacitance of the sample loop, so the oven temperature is sufficiently stable to verify the PSMs.Pressurizing sample gas for relative reduction of baseline fluctuation
Fluctuation of the baseline of the chromatograms is another factor that contributes to the variance of the peak areas. The fluctuation is caused by such things as the electronic noise of the detector and fluctuation of carrier gas flow rate. To reduce fluctuations in the flow rate, large buffer vessels are occasionally used to dampen the change in the atmospheric pressure.1 In the present work, to simplify the instrumental setup, the sample gas in the sample loop was pressurized instead of the buffer vessels so that the sample amount increased, which resulted in a relative reduction in the electronic noise. A needle valve was connected to the exit of the sample loop to restrict the flow of sample gas and to increase the sample amount.There is an additional benefit to pressurizing the sample gas in the loop. Oxygen in the atmosphere is a major source of contamination for the determination of oxygen. Because the pressure in the tube from the cylinder to the sample loop is higher than the atmospheric pressure, oxygen cannot diffuse into the tube from the tube connectors.
Stabilization of pressure in sample loop using mass flow controller
Two measures are taken when comparing PSMs with each other in order to take the sample amount in the loop into consideration; the pressure in the sample loop is set to be the same between the samples, and that the pressure is precisely monitored to normalize the peak areas. To realize the latter measure, an absolute manometer with accuracy below 0.01% is necessary, but they are not commercially available, or very expensive even if available. For the former measure, a gas-supplying system is necessary that makes the pressure at the outlet constant with an uncertainty smaller than that of the gravimetric preparation of the PSMs.Mechanical pressure regulators are widely used to supply gas at a constant pressure. The pressure at the outlet is controlled by the balance between the pressure at the inlet and outlet, atmospheric pressure and force of a spring on a diaphragm which is adjusted by a screw. The mechanical pressure regulators cannot precisely control the pressure at outlet and it is impossible to adjust the pressure of each sample within the required tolerance. Even during measurement of a sample, mechanical pressure regulators are problematic because the pressure at the outlet may change slightly because of a change in pressure at the inlet and the atmospheric pressure.
To realize the constant pressure, we used the mass flow controller to achieve a constant flow rate of the gas sample. Because the mass flow controller ideally controls not the volume of the gas but its mass, the ‘mass’ flow rate does not depend on the pressure at the inlet of the controller, so it gives a constant pressure in the sample loop even if the pressure at the regulator is different.
Fig. 6 shows a typical chromatogram of R1 when the pressure at the sample loop is set at 280 kPa gauge pressure. The sample flow rate was 100 ml min−1 in standard conditions (0 °C, 1 atm). The pressure in the sample loop was monitored roughly by a Bourdon gauge. The pressure of APC1, APC2 and APC3 was set to 350 kPa, 140 kPa and 350 kPa gauge pressure, respectively. As shown in Fig. 6, the noise intensity, or standard deviation of the chromatogram from the baseline, is approximately the same as that in Fig. 4, whereas the peak height in Fig. 6 is about three times that in Fig. 4. This pressurized sampling is an effective way to improve the signal-to-noise ratio. To reduce the measuring time, or to increase the measurement frequency, the pressure of APC1 and APC3 was set at a higher value than that in Fig. 4. A long tailing of the huge nitrogen peak is one of the hindrances preventing a reduction in the measuring time because the tailing makes the baseline of the next chromatogram to decline if it is shorter than the time during which nitrogen goes out of the column. The long tail was cut off using the 6-way valve and the nitrogen was removed more rapidly from the column. The measuring time was 6 min, which is about four times faster than that in Fig. 4.
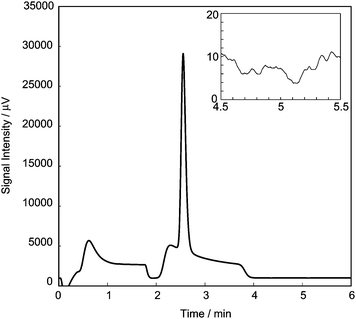 | ||
| Fig. 6 A typical chromatogram when the sample is pressurized to 280 kPa gauge pressure. The chromatogram around 5 min is enlarged in the inset to clearly show the noise intensity. | ||
The result of the repeated measurements of R1 is shown in Fig. 7. The relative standard deviation in the repeatability was 0.13%, which is double the result obtained in Fig. 5. As shown in Fig. 7, the peak area decreases whenever R1 is measured, and the uncertainty is mainly due to this decrease. There was mechanical play between a screw and a set screw of the needle valve, so the needle might have moved as a result of small vibrations or a sudden pressure change when the air-actuated 10-way valves in the GC rotated. We consider that this pressure change in the loop causes the decrease in the peak area in Fig. 7.
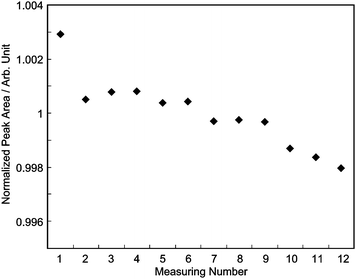 | ||
| Fig. 7 Repeated measurements with the sample at 280 kPa gauge pressure. The peak area evaluated from the first run of chromatograms is not plotted and was not considered in evaluating the standard deviation in the repeat measurement. | ||
To address this problem, we tapped the needle valve before the measurement and monitored the pressure at the exit of the sample loop. Tapping the needle valve reduces the mechanical play between the screw and the set screw, and it is not expected to change the sample pressure.
For the repeatability test, the two standard gases, S5 and R1, were measured, and the results are shown in Fig. 8. In a series of the measurements, a standard gas was successively measured five times with a series of measurements performed alternatively on S5 or R1. The pressure controllers APC1 and APC3 were set to 400 kPa gauge pressure and the measurement time was 5 min. The pressure in the sample loop was 390 kPa absolute pressure and the sample gas flow rate was 100 ml min−1 in the standard conditions.
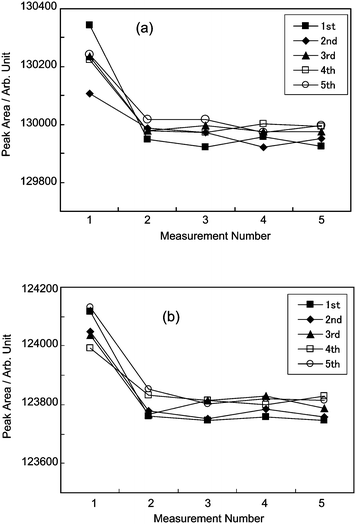 | ||
| Fig. 8 Results of repeated measurements of S5 (a) and R1 (b). The PSM S5 was successively measured five times and then the other gas R1 was successively measured five times. Successive measurements were alternated between S5 and R1. As shown in this figure, the peak area obtained from the first chromatogram is obviously different from the others, thus it is eliminated from consideration in evaluating the standard deviation in this study. | ||
Table 2 shows the results of the repeated measurements. The relative standard uncertainties in a series ranged from 0.005% to 0.023%, and the average of the relative standard uncertainties was 0.015%, which is equivalent to the relative standard uncertainty of the PSMs. This result demonstrates the ability to verify the amount fraction of the PSMs. The average of the relative standard uncertainties was almost equivalent to that in the PSMs, and tapping the valve works well to keep the pressure constant in a series of measurements.
| PSM | Series # | Average | u | RU (%) |
|---|---|---|---|---|
| S5 | 1 | 129![[thin space (1/6-em)]](https://www.rsc.org/images/entities/char_2009.gif) 865.8 865.8 |
20.0 | 0.015 |
| 2 | 129![[thin space (1/6-em)]](https://www.rsc.org/images/entities/char_2009.gif) 943.9 943.9 |
27.2 | 0.021 | |
| 3 | 129![[thin space (1/6-em)]](https://www.rsc.org/images/entities/char_2009.gif) 977.4 977.4 |
6.8 | 0.005 | |
| 4 | 129![[thin space (1/6-em)]](https://www.rsc.org/images/entities/char_2009.gif) 978.7 978.7 |
14.7 | 0.011 | |
| 5 | 130![[thin space (1/6-em)]](https://www.rsc.org/images/entities/char_2009.gif) 035.8 035.8 |
19.9 | 0.015 | |
| R1 | 1 | 123![[thin space (1/6-em)]](https://www.rsc.org/images/entities/char_2009.gif) 634.8 634.8 |
4.4 | 0.004 |
| 2 | 123![[thin space (1/6-em)]](https://www.rsc.org/images/entities/char_2009.gif) 725.5 725.5 |
14.8 | 0.012 | |
| 3 | 123![[thin space (1/6-em)]](https://www.rsc.org/images/entities/char_2009.gif) 778.3 778.3 |
28.4 | 0.023 | |
| 4 | 123![[thin space (1/6-em)]](https://www.rsc.org/images/entities/char_2009.gif) 804.2 804.2 |
16.8 | 0.014 | |
| 5 | 123![[thin space (1/6-em)]](https://www.rsc.org/images/entities/char_2009.gif) 888.9 888.9 |
21.6 | 0.017 |
The average values for S5 in Table 2 are represented as solid squares in Fig. 9 in which the error bars correspond to the expanded uncertainty (k = 2). Although the average values should ideally coincide with each other, the average values for S5 and R1 increase and do not coincide with an uncertainty smaller than their expanded uncertainties.
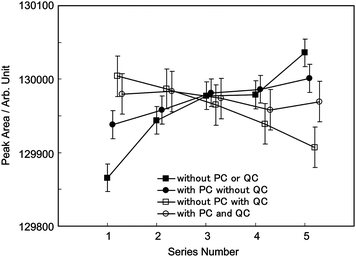 | ||
| Fig. 9 Repeatability test with and without the pressure correction technique and the QC-cylinder technique. Each datum is an average of four chromatograms and the error bars represents 2u(AN). The abbreviations of PC and QC refer to the compensation with the pressure correction technique and the QC-cylinder technique, respectively. | ||
Pressure correction technique
A slight change in the pressure in the sample loop is a probable cause of the discordance of the averages in the repeated measurements of S5 and R1. To correct the pressure change in the sample loop, the pressure was monitored by a highly accurate absolute manometer, which comprised a highly accurate pressure transducer (MKS Baratron, 690ARBTRB, full scale: 0–2 MPa in absolute pressure, precision: 0.08% of reading) and a highly accurate signal transducer (MKS Baratron, 670B, precision 0.02% of its full scale). Although the manometer uncertainty is at least 0.1%, which is larger than the uncertainty in the amount fraction of the PSMs, we tried to calibrate the sample amount by the manometer. The range of the sample pressure is very narrow because the pressure is almost constant (because of the mass flow controller), and linearity within a narrow range is the key capability of the manometer for calibrating the sample amount by pressure.Table 3 shows the results of the repeated measurements with the pressure correction technique. The average of the relative standard uncertainties (urep) was the same as that without the pressure correction technique, and it was used in the following results as a pooled relative standard uncertainty for repeatability (urep = 0.015%).
| PSM | Series # | Average | u | RU (%) |
|---|---|---|---|---|
| S5 | 1 | 129![[thin space (1/6-em)]](https://www.rsc.org/images/entities/char_2009.gif) 938.0 938.0 |
18.0 | 0.014 |
| 2 | 129![[thin space (1/6-em)]](https://www.rsc.org/images/entities/char_2009.gif) 958.0 958.0 |
27.9 | 0.022 | |
| 3 | 129![[thin space (1/6-em)]](https://www.rsc.org/images/entities/char_2009.gif) 981.5 981.5 |
10.0 | 0.008 | |
| 4 | 129![[thin space (1/6-em)]](https://www.rsc.org/images/entities/char_2009.gif) 986.2 986.2 |
14.0 | 0.011 | |
| 5 | 130![[thin space (1/6-em)]](https://www.rsc.org/images/entities/char_2009.gif) 000.9 000.9 |
20.5 | 0.016 | |
| R1 | 1 | 123![[thin space (1/6-em)]](https://www.rsc.org/images/entities/char_2009.gif) 752.5 752.5 |
6.8 | 0.005 |
| 2 | 123![[thin space (1/6-em)]](https://www.rsc.org/images/entities/char_2009.gif) 768.2 768.2 |
15.3 | 0.012 | |
| 3 | 123![[thin space (1/6-em)]](https://www.rsc.org/images/entities/char_2009.gif) 799.6 799.6 |
28.4 | 0.023 | |
| 4 | 123![[thin space (1/6-em)]](https://www.rsc.org/images/entities/char_2009.gif) 819.2 819.2 |
14.6 | 0.012 | |
| 5 | 123![[thin space (1/6-em)]](https://www.rsc.org/images/entities/char_2009.gif) 822.4 822.4 |
21.8 | 0.018 |
The average values for S5 in Table 3 are represented as solid circles in Fig. 9 in which the error bars correspond to the expanded uncertainty (k = 2). The increase in the average values with the pressure correction technique is smaller than that without, but these data also do not coincide with an uncertainty smaller than their expanded uncertainties. We consider there are some factors, besides the pressure in the sample loop that may be responsible for the drift in the peak area.
Internal standard method to cancel drift in the peak area
The peak area is dependent on many factors, such as the sensitivity of the TCD, carrier gas flow rate, separation power of the GC, temperature of the column oven. We monitored the pressure in the loop and the temperature of the oven, and they are sufficiently stable and well monitored for the correction of the sensitivity, as mentioned above. It is unclear as to what significantly influences the change in peak area, and it is difficult to identify and monitor all of these factors. Therefore, it is necessary to use a normalization method such as for an internal standard method to the comprehensively correct for the unknown factors.The relative uncertainty of the amount fraction of the nitrogen matrix component of the PSMs is smaller than that of the oxygen component, and nitrogen was used as an internal standard component. As the amount fraction of nitrogen is 10![[thin space (1/6-em)]](https://www.rsc.org/images/entities/char_2009.gif) 000 times higher than that of oxygen, the sensitivity of the TCD had to be decreased to avoid the saturation of the sensitivity, and the TCD current was set at 100 mA. The standard gas R1 was successively measured 16 times, and the relative repeatability for the nitrogen was 0.026%, while that for the oxygen was 0.11% because of the decrease in the sensitivity. As a result, the nitrogen did not work well as an internal standard. Moreover, a longer measuring time is required to exactly measure the peak area of the nitrogen, which is also disadvantageous in reducing the uncertainty in the comparison.
000 times higher than that of oxygen, the sensitivity of the TCD had to be decreased to avoid the saturation of the sensitivity, and the TCD current was set at 100 mA. The standard gas R1 was successively measured 16 times, and the relative repeatability for the nitrogen was 0.026%, while that for the oxygen was 0.11% because of the decrease in the sensitivity. As a result, the nitrogen did not work well as an internal standard. Moreover, a longer measuring time is required to exactly measure the peak area of the nitrogen, which is also disadvantageous in reducing the uncertainty in the comparison.
Quality-control cylinder technique to cancel drift in the peak area
Instead of the internal standard method we used the quality-control (QC) cylinder technique in which a measurement of the sample S5 was followed by a measurement of the control cylinder R1 to correct for the drift of the peak area.8 The average peak area AS in a series of measurements of the PSMs was corrected by the average peak area AR in a series of measurements of the QC cylinder. The corrected value AN is equal to , where
  is an average for all AR. The standard uncertainty in AN was calculated according to uncertainty propagation theory as follows:
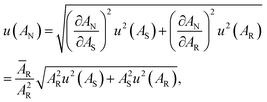 | (1) |
 and
and  , respectively, where n is the effective number of the replications in a series (n = 4).
The results with the QC-cylinder technique are shown as open squares and circles in Fig. 9 and are summarized in Table 4. The error bars correspond to the expanded uncertainty of AN [i.e. 2u(AN)]. The open squares show the results without the pressure correction technique in the sample loop and indicate a monotonic decrease. Furthermore, the difference between the average peak areas of series #1 and # 5 is greater than their expanded uncertainty. The open circles in Fig. 9 represent the result of the correction with the pressure in the sample loop. These data coincide with each other within their expanded uncertainties, and the QC-cylinder technique and pressure monitoring work well to correct the sensitivity drift. The relative expanded uncertainty of AN is 0.011%, which is equivalent to the relative standard uncertainty of the PSMs.
| Series # | Without pressure correction | With pressure correction | ||||
|---|---|---|---|---|---|---|
| Average | u | RU (%) | Average | u | RU (%) | |
| 1 | 130![[thin space (1/6-em)]](https://www.rsc.org/images/entities/char_2009.gif) 004 004 |
13.76 | 0.011 | 129![[thin space (1/6-em)]](https://www.rsc.org/images/entities/char_2009.gif) 980 980 |
13.76 | 0.011 |
| 2 | 129![[thin space (1/6-em)]](https://www.rsc.org/images/entities/char_2009.gif) 987 987 |
13.75 | 0.011 | 129![[thin space (1/6-em)]](https://www.rsc.org/images/entities/char_2009.gif) 983 983 |
13.76 | 0.011 |
| 3 | 129![[thin space (1/6-em)]](https://www.rsc.org/images/entities/char_2009.gif) 965 965 |
13.74 | 0.011 | 129![[thin space (1/6-em)]](https://www.rsc.org/images/entities/char_2009.gif) 974 974 |
13.75 | 0.011 |
| 4 | 129![[thin space (1/6-em)]](https://www.rsc.org/images/entities/char_2009.gif) 939 939 |
13.73 | 0.011 | 129![[thin space (1/6-em)]](https://www.rsc.org/images/entities/char_2009.gif) 958 958 |
13.75 | 0.011 |
| 5 | 129![[thin space (1/6-em)]](https://www.rsc.org/images/entities/char_2009.gif) 907 907 |
13.72 | 0.011 | 129![[thin space (1/6-em)]](https://www.rsc.org/images/entities/char_2009.gif) 969 969 |
13.75 | 0.011 |
Comparison between five PSMs
The five PSMs, i.e. S1 to S5, were compared with each other using the QC-cylinder technique and pressure monitoring. We did five measurements in a series for the sample and control gases, and the chromatograms except for the first chromatogram were used for the determination as mentioned above. The measuring condition was the same as for the data of Fig. 9, and the peak areas were corrected by , with the result of the comparison shown in Fig. 10. The result of S3 is obviously an outlier, which indicates that an error occurred in preparing S3. The errors may be contamination from air, faulty weighing, adsorption or desorption of oxygen from the inner wall of the cylinder, or other unknown factors. This incorrect result demonstrates the importance of verifying the amount fraction of PSMs.
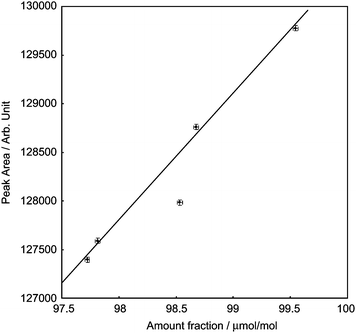 | ||
| Fig. 10 Comparison between the five PSMs, S1–S5. The straight line is a calibration line obtained by the Deming's least squares method with the model y = ax. The error bars correspond to the expanded uncertainty (k = 2). | ||
The horizontal and vertical error bars in Fig. 10 represent the expanded uncertainty (k = 2) of the gravimetric preparation of the PSMs and the measuring uncertainty [u(AN)], respectively. The relative expanded uncertainty of the preparation was 0.023–0.024%, whereas the relative expanded measuring uncertainty was 0.022%. These uncertainties are almost equivalent, so the high-precision GC-TCD system may be used to verify PSMs whose amount fraction is 100 µmol per mol or higher.
The uncertainty of the PSMs is due to the preparation and the verification method, as mentioned above. If the uncertainty in the verification is half of the uncertainty in the preparation, the increase of the uncertainty due to verification is about 10% of the uncertainty of the PSMs because the combined uncertainty is the square root of the sum of squares of each uncertainty. Therefore, to not significantly increase the uncertainty of the PSMs, the uncertainty due to the verification must be at least half that due to the preparation. One tactic to decrease the uncertainty due to the verification is to increase the number of measurements. When we used 16 measurements in a series for the sample and control gases, the measuring time was about 12 hours for the five PSMs. Although this measuring time is not insignificant, it is possible if the GC-TCD system is equipped with an automatic sample selector.
The calibration line in Fig. 10 was obtained using Deming's least squares method in which the uncertainty of both the x and y values of each data point is evaluated to determine the calibration line and the sum of the weighted squared x and y residuals are minimized.6,14 The results, shown in Fig. 10 except for that of S3, were used for the calculation. Deming's least squares method uses a goodness-of-fit parameter Γ instead of correlation coefficients as for the usual least squares method. The parameter Γ is defined as:
| Γ = max(|rx,i|/ux,i, |ry,i|/uy,i); (i = 1–5), | (2) |
Conclusion
This study concludes that the GC-TCD system can verify the amount fraction of the standard gas at a relative expanded uncertainty (k = 2) of 0.02%. Such a system should prove helpful in understanding the cause of errors in the preparation, such as effects of physical and chemical adsorption and desorption from the inner wall of the cylinder and chemical reactions with other components in the cylinder. The sensitivity of the TCD to most gases is not significantly different because the heat conductivity of gases is not very different. If the gas chromatograph has a sufficient separation power, the GC-TCD system is applicable to other binary mixtures with different components and to more complex multi-component mixtures. For example, we believe that the GC-TCD system is applicable for verifying standard gases whose relative uncertainty is recommended to be lower than 0.025% for inter-laboratory compatibility, such as carbon dioxide standard gases for atmospheric monitoring.References
- Y. Tohjima, J. Geophys. Res., [Atmos.], 2000, 105, 14575–14584 CrossRef CAS.
- World Meteorological Organization, GAW Research and Monitoring Reports, 2005, No. 168, http://www.wmo.int/pages/prog/arep/gaw/gaw-reports.html Search PubMed.
- ISO 6142, Gas Analysis—Preparation of Calibration Gas Mixtures—Gravimetric Method, 2nd edn, 2001 Search PubMed.
- M. J. T. Milton, P. T. Woods and P. E. Holland, Metrologia, 2002, 39, 97–99 CrossRef.
- A. Alink and A. M. H. van der Veen, Metrologia, 2000, 37, 641–650 CrossRef.
- ISO 6143, Gas Analysis—Comparison Methods for Determining and Checking the Composition of Calibration Gas Mixtures, 2nd edn, 2001 Search PubMed.
- L. A. Konopel'ko, A. V. Kolobova, D. N. Selyukov and A.É. Fridman, Meas. Tech., 2007, 50, 149–154 CrossRef CAS.
- M. J. T. Milton, F. Guenther, W. R. Miller and A. S. Brown, Metrologia, 2006, 43, L7–L10 CrossRef.
- A. Alink, Metrologia, 2000, 37, 35–49 CrossRef.
- List of Key Comparisons in the BIPM Key Comparison Database, http://kcdb.bipm.org/AppendixD/default.asp.
- G. Nieuwenkamp and A.M. H. van der Veen, Accredit. Qual. Assur., 2006, 10, 506–509 CrossRef CAS.
- N. Matsumoto, T. Watanabe, M. Maruyama, Y. Horimoto, T. Maeda and K. Kato, Metrologia, 2004, 41, 178–188 CrossRef.
- J. Lee, et al., Metrologia, 2010, 47, 08005 CrossRef , Tech. Suppl.
- W. E. Deming, Statistical Adjustment of Data, Wiley, New York, 1943 Search PubMed.
| This journal is © The Royal Society of Chemistry 2011 |
