Liquid chromatographic profiling of monosaccharide concentrations in complex cell-culture media and fermentation broths†
Hassan
Alwael
b,
Damian
Connolly
ab and
Brett
Paull
*ab
aIrish Separation Science Cluster, National Centre for Sensor Research, Dublin City University, Glasnevin, Dublin, 9, Ireland. E-mail: brett.paull@dcu.ie; Fax: +353 1 7005503; Tel: +353 1 7005060
bCentre for Bioanalytical Sciences, National Centre for Sensor Research, Dublin City University, Glasnevin, Dublin, 9, Ireland
First published on 25th November 2010
Abstract
A solid phase extraction, liquid chromatography and fluorescence (SPE-RPLC-FL) based protocol for the determination of free monosaccharides in highly complex raw material powders and formulated fermentation feedstocks and broths has been developed. Monosaccharides within sample extracts were derivatised pre-column with anthranilic acid and the derivatives separated using reversed-phase LC with fluorescence detection. Using a 2.1 mm × 50 mm 1.8 µm Zorbax Eclipse XDB-C18 column, a flow rate of 0.4 mL min−1 and an acetonitrile gradient in a sodium acetate buffer (pH 4.3; 50 mmol L−1) the baseline resolution of glucosamine, mannosamine, galactosamine, galactose, mannose, glucose, ribose, xylose, fucose and sialic acid within 20 minutes was achieved. Pre-column derivatisation involved combining a 30 mg mL−1 solution of anthranilic acid in a 1![[thin space (1/6-em)]](https://www.rsc.org/images/entities/char_2009.gif) :1 ratio with an aqueous standard prior to injection. Standard analytical performance criteria were used for evaluation purposes, with the method found to exhibit LOD's as low as 10 fmol, and be linear and precise (%RSD < 2.2% (n = 7). The method was applied to the analysis of a range of highly complex biopharmaceutical production samples, including yeastolate powders, chemically defined media and in-process fermentation broth samples. Sample preparation involved passing an aqueous sample through a C18 solid phase extraction cartridge to trap hydrophobic peptides and vitamins, with recovery of all test sugars exceeding 90%. Finally, standard statistical analysis was performed on samples taken from different lots in order to estimate lot-to-lot variability.
:1 ratio with an aqueous standard prior to injection. Standard analytical performance criteria were used for evaluation purposes, with the method found to exhibit LOD's as low as 10 fmol, and be linear and precise (%RSD < 2.2% (n = 7). The method was applied to the analysis of a range of highly complex biopharmaceutical production samples, including yeastolate powders, chemically defined media and in-process fermentation broth samples. Sample preparation involved passing an aqueous sample through a C18 solid phase extraction cartridge to trap hydrophobic peptides and vitamins, with recovery of all test sugars exceeding 90%. Finally, standard statistical analysis was performed on samples taken from different lots in order to estimate lot-to-lot variability.
Introduction
Within the biopharmaceutical industry the concept of Quality by Design (QbD) is a framework which ensures better understanding of biofermentation processes and the various parameters which affect product quality and process consistency.1 Manufacturers who submit New Drug Applications (NDA) for novel biotherapeutics now have an obligation to clearly demonstrate the application of the QbD approach, which is defined as: “a systematic approach to development that begins with predefined objectives and emphasises product and process understanding and process control, based on sound science and quality risk management”.2–4The QbD approach involves identifying critical quality attributes (CQA's), which are defined as: “a physical, chemical, biological or microbiological property or characteristic that should be within an appropriate limit, range, or distribution to ensure the desired product quality”.2 For example, CQA's for biotherapeutics include the extent of protein phosphorylation, truncation, misfolding and glycosylation. Glycosylation is a post-translational modification which has a crucial effect upon correct protein folding, protein solubility and immunogenicity, with the majority of biotherapeutics on the market today being glycosylated. The extent to which all potential glycan attachment sites are actually glycosylated (N-linked or O-linked glycosylation), as well as the variation in structure of the attached glycan, is dependent on a large number of factors, not least the concentration of critical monosaccharides in cell growth media and by extension, the corresponding raw materials. As a crucial component in the entire glycoprotein production cycle, reliable and robust assays are urgently required for the range of monosaccharides likely to be present in such complex media.
Raw materials used in biofermentation processes tend to be complex in nature due to the complex growth requirements of the eukaryotic cell lines used, such as Chinese hamster ovary (CHO) cells. A typical raw material used for mammalian cell cultures is yeastolate powder5–7 which is well suited as a supplement, as it is inexpensive, provides much of the nutritional requirements for growing CHO cells including amino acids, peptides, carbohydrates and some micronutrients, and has shown to have a significant positive influence on cell growth.8 Yeastolate is manufactured via the cultivation and subsequent thermal lysis of Saccharomyces cerevisiae yeast cells followed by proteolytic digestion.7 Unfortunately, yeastolate and other cell hydrosylates exhibit significant lot-to-lot variability or variability between different vendors,9–11 a variability which may potentially have a significant impact on CHO cell growth and final product quality.
However, yeastolate powders do not provide all of the nutrient requirements and thus prior to inoculation with CHO cells, basal media are typically formulated by dissolving an appropriate concentration of yeastolate and supplementing it with additional key nutrients, such as glucose. Depletion of key components such as glucose and glutamine has been shown to slow the glycosylation process.12,13 Indeed, since the extent of glycosylation has been shown to decrease over time in a batch culture,14 fed-batch strategies have been designed to ensure that the levels of key nutrients (in this case, monosaccharides) in the bioreactor do not decrease to an extent where glycosylation (or indeed cell growth) is compromised.15 To monitor these processes fully, the development of robust quality control assays for key components in each stage of the production cycle, from yeastolate raw materials, to basal media formulations, to the actual in-process samples, is therefore absolutely critical.
Several analytical methods of varying degrees of complexity have been developed for the determination of monosaccharides in aqueous samples and sample extracts, including gas chromatography (GC),16 high performance anion exchange chromatography with pulsed amperometric detection (HPAEC-PAD),17–22capillary zone electrophoresis (CZE)23–27 and high performance reversed-phase liquid chromatography (RPLC).23,28–35 Methods developed specifically for the characterisation of biofermentation broth samples for monosaccharide profile are relatively few, and most are limited to 2–3 monosaccharides, present at relatively high concentrations.36–39
In RPLC, monosaccharides cannot be determined using direct UV absorbance or fluorescence detection, due to the lack of suitable chromophores and fluorophores. Some methods on complex media samples have been described using HPAEC-PAD,17 although this particular detection approach is prone to interference, especially with samples like yeastolates, which contain excess concentrations of undefined components. Alternative detection options, such as refractive index detection and related methods suffer from limited concentration sensitivity and lack of specificity.40 For these reasons, pre-column derivatisation of monosaccharides is crucial for highly sensitive and selective detection.41 There are a variety of reagents developed for this application, including 2-aminobenzoic acid (AA),23,29benzamidine,30FMOC-hydrazine (9-fluorenylmethyl chloroformate),31 and aminopyrazine32 for fluorescence detection, and p-aminobenzoic ethyl ester (ABEE)33,34 and 1-phenyl-3-methyl-5-pyrazolone (PMP)35 for UV absorbance detection. Of the above options, labelling monosaccharides with AA has several advantages, not least the high sensitivity compared to the others. Additionally, AA can be used for quantitation of both neutral and amino monosaccharides without N-acetylation, whereas using other labelling tags requires monosaccharides to be N-acetyled.42
The following paper presents a selective and robust RPLC-FL based method developed specifically for the profiling of up to 10 monosaccharides, with a chromatographic run-time of approx. 20 min, within a range of complex biological samples originating from within the biopharmaceutical fermentation process. Specifically, the assay was developed to allow selective quantification of glucosamine, mannosamine, galactosamine, galactose, mannose, glucose, ribose, xylose, fucose and sialic acid, without interferences from within the extracts of yeastolate feedstock, basal media preparations and fermentation process samples.
Experimental
Instrumentation
The chromatographic separation was performed using an Agilent 1200 Series RRLC system (Agilent Technologies, CA, USA) which comprised an on-line degasser, a binary pump, an autosampler with temperature control, a column oven and a UV-vis detector. The AA-monosaccharide derivatives were separated on a 2.1 mm × 50 mm, 1.8 µm ZORBAX Eclipse XDB-C18 column (Agilent Technologies, CA, USA) at a flow rate of 0.4 mL min−1 and a column temperature of 20 °C. Mobile phase A was 50 mmol L−1sodium acetate buffer (pH 4.3) and mobile phase B was acetonitrile. The gradient program was: 0 to 12 min (2% B), 12.1 to 17 min (10% B) and 17.1 to 25 min (2% B). The injection volume was 700 nL with fluorescence detection (Waters 470 fluorescence detector, Waters Corporation, MA, USA) at excitation: 360 nm and emission: 424 nm. Sample preparation prior to derivatisation was achieved with a C18 solid phase extraction cartridge (Phenomenex Strata C18-E, 55 µm, 70 Å, 50 mg per 1 mL, Phenomenex, Macclesfield, UK). A GFL water bath model 1013 (GFL, Burgwedel, Germany) was used for derivatisation and the balance used was a Sartorius Model ED124S (Sartorius, Goettingen, Germany). The pH meter used (Orion 2 Star) was purchased from Thermo Electron Corporation (Thermo, PA, USA).Reagents and materials
Galactose (Gal, 99%), glucose (Glc, 99.5%), mannose (Man, Sigma-ultra), glucosamine (GlcN, 99%), galactosamine (GalN, 98%), ribose (Rib, 99%), fucose (Fuc, 98%), sodium cyanoborohydride (95%) sodium acetate (99%), boric acid (99.5%) and diethyl ether were purchased from Sigma-Aldrich (Dublin, Ireland). Xylose (Xyl, 99%), mannosamine (ManN, 98%), and anthranilic acid (AA, 98%) were purchased from Fluka (Buchs, Switzerland). Methanol and acetonitrile were of HPLC grade from Labscan (Dublin, Ireland). Acetic acid (96%) was from Riedel-de-Haen (Seelze, Germany). All chemicals were used as received, without any further purification.Real samples preparation
The samples analysed originate from an actual industrial scale biofermentation process facility for a commercial biotherapeutic.All samples were dissolved and diluted using GlcN as an internal standard. A number of representative samples had previously been tested and found to contain no detectable levels of GlcN. Therefore, for yeastolate analysis (received as dry powders) 15 mg of yeastolate was dissolved in 1 mL of 150 µM GlcN. For the analysis of basal media samples, 50 µL of the sample was diluted by a factor of 5 using spiking solution (175 µM GlcN). For the determination of Glc levels in these samples, 20 µL of the above diluted sample was further diluted by a factor of 80 using spiking solution. Note: in the work described in this paper “basal media” comprises diluted yeastolate powder in water, supplemented with additional Glc for optimum cell growth and provided from the biopharma industry immediately prior to inoculation with Chinese hamster ovary (CHO) cells. In-process samples were collected at specific time-points during a commercial biofermentation process and were provided after removal of CHO cells by centrifugation. These samples were diluted by a factor of 5 using spiking solution (175 µM GlcN). A further dilution for the diluted sample was carried out by a factor of 20, 50 or 60 depending on the relative levels of Gal and Glc which were present at high levels in many of these samples.
Sample cleanup by solid phase extraction (SPE)
A C18SPE cartridge was conditioned with 1 mL of methanol followed by 1 mL of water. A volume of diluted sample (200 µL) was passed through the cartridge and collected in a clean polypropylene centrifuge tube, followed by a further 100 µL water wash; the unretained hydrophilic monosaccharides were subsequently derivatised as described below.Fluorescent labelling of monosaccharides
Results and discussion
Optimisation of chromatographic conditions
The method described here has its origin within the pioneering paper on the separation of AA monosaccharide derivatives by RPLC-FL initially reported by Anumula.29 However, the chromatographic method developed by Anumula utilising a 5 µm 0.46 × 25 cm C18 Bakerbond column was only capable of the separation of 6–7 monosaccharides in a run-time of approx. 50 min, with a large tailed reagent peak masking the elution window from 20 to 35 min, and thus limiting the practical application of the method. In an effort to simultaneously reduce chromatographic run-time, mobile phase consumption and increase peak capacity to allow the separation of a larger suite of monosaccharides (including sialic acid), the method described herein utilised a short (2.1 mm × 50 mm) 1.8 µm, C18 column (ZORBAX Eclipse XDB), which under optimised conditions allowed the separation of all 10 target AA-monosaccharide derivatives within 20 minutes, as illustrated in Fig. 1. In addition, the method used considerably less solvent while running at lower flow rates (in this instance 0.4 mL min−1).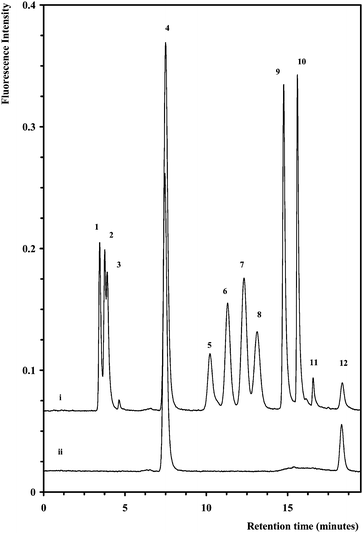 | ||
| Fig. 1 Separation of ten AA-monosaccharide derivatives (i) overlaid with a blank (ii). Column: 2.1 mm × 50 mm, 1.8 µm Zorbax Eclipse XDB-C18. Mobile phase A: 50 mmol L−1sodium acetate pH 4.3, mobile phase B: 100% acetonitrile. Gradient program: 0–12 min (2%), 12.1–17 min (10%), 17.1–25 min (2%). Flow rate: 0.4 mL min−1. Injection volume: 700 nL. Column temperature: 20 °C. Detection: excitation @ 360 nm and emission @ 425 nm. Peak assignment: 1—GlcN, 2—ManN, 3—GalN, 4—excess AA, 5—Gal, 6—Man, 7—Glc, 8—Rib, 9—Xyl, 10—Fuc, 11—sialic acid, and 12—blank peak. Monosaccharide concentrations: 20 µmol L−1, except sialic acid, 50 µmol L−1. | ||
The influence of the mobile phase pH was investigated in detail over two different pH range windows. Window 1 was from pH 3.6 to pH 5.2 at 0.4 unit intervals. The retention time of the last eluting peak decreased by about 50% when the pH was increased from 3.6 to 5.2, however, the overall resolution of the analyte peaks was almost lost at this pH (5.2). Therefore, a further investigation over a narrower range from pH 4.0 to pH 4.5 at 0.1 unit intervals (window 2) was carried out. There was no significant effect upon retention times across this window, as they only increased by approximately 7%, when the pH was decreased from 4.5 to 4.0, whereas a greater effect was seen on the resolution between Man, Glc and Rib peaks. For example, at pH 4.0 the resolution of the Man/Glc pair was 1.9 and 0.92 for Glc/Rib, whereas at pH 4.5 Man/Glc resolution was 0.96 and Glc/Rib 1.55. However, at pH 4.3 these were 1.5 and 1.4, respectively, whilst retention times remained relatively stable (the resolution between Glc and Rib was the highest at pH 4.8, although at this pH co-elution of Man/Glc and ManN/GalN peak pairs was also observed, with lower resolution between sialic acid and a late eluting system peak). Therefore, it was concluded that the optimum working pH, and most robust in terms of retention and resolution was pH 4.3.
The effect of column temperature upon the separation of the derivatives was also examined, with lower temperatures generally leading to improved resolution. However, column temperatures <20 °C lead to broadened peaks and increased retention times and so 20 °C was selected for all sample analyses.
Effect of the derivatisation time
The reaction time required for formation of the AA-monosaccharide derivatives was investigated. The optimum time for the derivatisation reaction was 80 minutes. Peak areas for AA-monosaccharides derivatives were increased by 11.2% for GlcN, 5.5% for ManN, 4.2% for GalN, 1.9% for Gal, 3.8% for Man, 4.0% for Glc, 2.9% for Rib, 3.1% for Xyl, 3.3% for Fuc and 33.3% for sialic acid compared to the original assay29 in which the derivatisation was carried out for 60 minutes in the oven.Liquid–liquid extraction of the excess derivatisation reagent
The concentration of AA reagent used for the derivatisation of samples as first reported by Anumula29 produced an unacceptable large tailed reagent peak within the centre of the chromatogram which interfered with the accurate determination of Gal. Within the sample set under investigation, monosaccharide concentrations varied greatly, particularly for basal media samples and in-process samples, which both had been supplemented with additional Glc. Therefore, for practical application a method to reduce the excessive reagent concentration within the prepared sample was necessary. Since the intention of this study was to develop a single derivatisation protocol for all three sample types, no attempt was made to reduce the reagent peak size by optimising the concentration of AA (30 mg mL−1) for each individual sample type. Instead the excess reagent could be readily extracted into diethyl ether without adversely affecting either the separation or the recovery of monosaccharides. Fig. 2 shows standard chromatograms of AA-monosaccharide derivatives before and after diethyl ether extraction. The peak area for the AA peak(s) (including peak 12) was selectively reduced by a factor of ten, while the extraction recovery for all monosaccharides was not adversely affected as detailed in Table 1.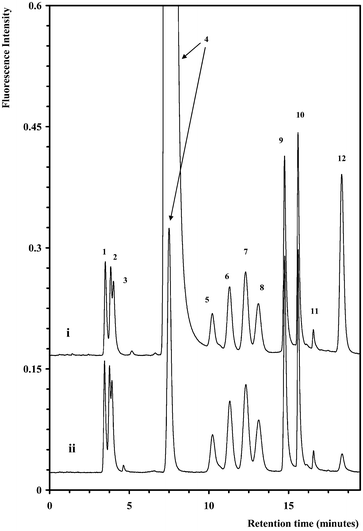 | ||
| Fig. 2 Separation of ten AA-monosaccharide derivatives before (i) and after (ii) diethyl ether extraction of excess AA. The chromatographic conditions and peak assignment are as described in Fig. 1. | ||
| Monosaccharide | Solid phase extraction recovery (standards) | Solid phase extraction recovery (spiked sample) | Diethyl ether extraction recovery | Average recovery (combined SPE and solvent extraction, n = 6 inj.) |
|---|---|---|---|---|
| a Individual recovery data based upon duplicate injections for all monosaccharides. | ||||
| GlcN | 100 | 112 | 114 | 108 |
| ManN | 98 | 102 | 111 | 104 |
| GalN | 98 | 105 | 118 | 107 |
| Gal | 102 | 103 | 122 | 109 |
| Man | 100 | 91 | 115 | 102 |
| Glc | 97 | 102 | 117 | 105 |
| Rib | 98 | 90 | 110 | 99 |
| Xyl | 101 | 91 | 113 | 102 |
| Fuc | 97 | 94 | 104 | 98 |
| Sialic acid | 102 | 122 | 109 | 111 |
Method validation
The recovery of a known concentration of monosaccharides spiked into a yeastolate sample prior to SPE and derivatisation was also examined and results are also detailed in Table 1. For all monosaccharides the spike recovery was >90%.
| Monosaccharide | Area precision % RSD (n = 7) | RT precision % RSD (n = 7) | LOD µM/fmola | Linear range/µM | Linearity (n = 5) |
|---|---|---|---|---|---|
| a Based on a 700 nl injection. | |||||
| GlcN | 0.7 | 0.4 | 0.56 (39) | 4.2–83.3 | 0.999 |
| ManN | 0.7 | 0.4 | 0.19 (13) | 1.4–41.7 | 0.999 |
| GalN | 0.7 | 0.3 | 0.37 (26) | 1.9–55.6 | 0.999 |
| Gal | 0.8 | 0.2 | 0.37 (26) | 1.9–55.6 | 0.999 |
| Man | 0.8 | 0.2 | 0.37 (26) | 2.8–83.3 | 0.999 |
| Glc | 1.2 | 0.1 | 0.37 (26) | 2.8–55.6 | 0.999 |
| Rib | 2.2 | 0.1 | 0.37 (26) | 1.9–55.6 | 0.999 |
| Xyl | 0.6 | 0.1 | 0.14 (10) | 1.4–41.7 | 0.999 |
| Fuc | 1.0 | 0.1 | 0.14 (10) | 1.4–27.8 | 0.999 |
| Sialic acid | 1.3 | 0.1 | 0.50 (35) | 5–500 | 0.999 |
Monosaccharide profile of yeastolate, basal media and in-process samples
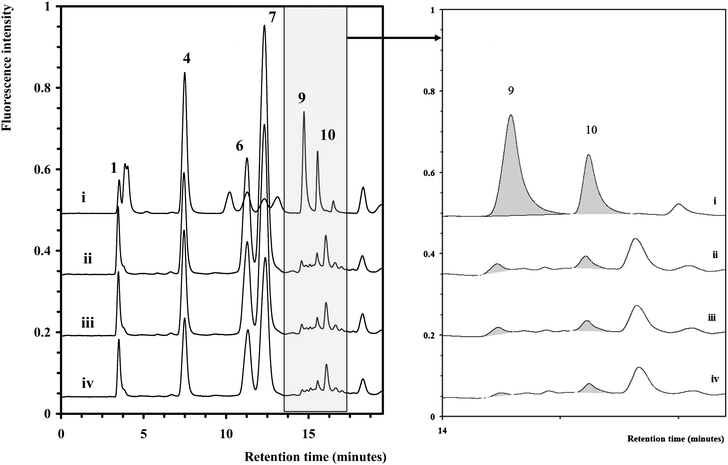 | ||
| Fig. 3 Chromatograms of selected yeastolate samples (ii–iv) overlaid with a chromatogram of a monosaccharide standard (i). The chromatographic conditions and peak assignment are as described in Fig. 1. Inset shows expanded region (14–17 min). | ||
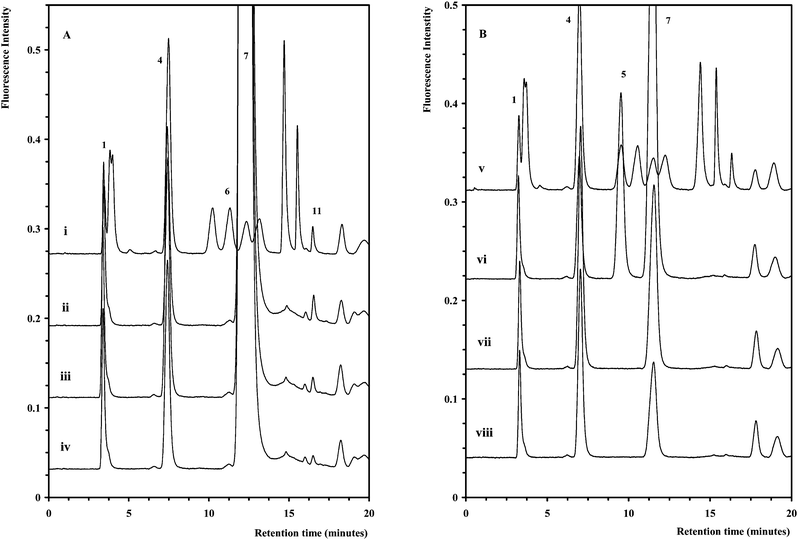 | ||
| Fig. 4 (A) Chromatograms for selected basal media samples diluted 1/5 (ii–iv) overlaid with a standard (i). (B) Chromatograms for selected basal media samples diluted 1/400 (vi–viii) overlaid with a standard (v). The chromatographic conditions and peak assignment are as described in Fig. 1. | ||
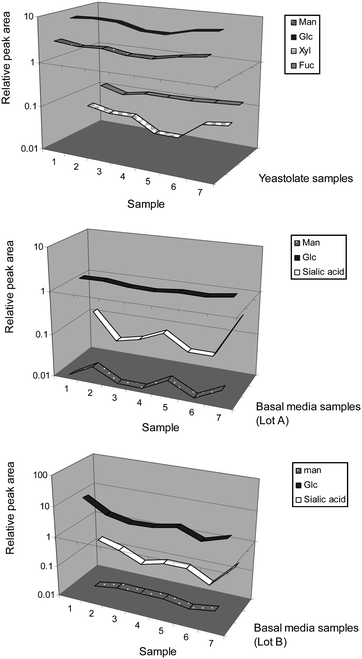 | ||
| Fig. 5 Monosaccharide profiles for yeastolate and basal media samples from the biopharmaceutical industry. | ||
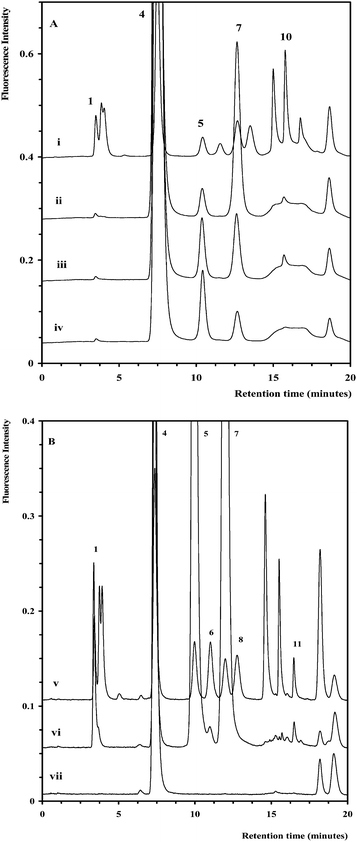 | ||
| Fig. 6 (A) Chromatograms for selected in-process samples diluted 1/100 (ii–iv) overlaid with a standard (i). (B) Chromatogram for selected in-process sample diluted 1/5 (vi) overlaid with a standard (v) and blank (vii). The chromatographic conditions and peak assignment are as described in Fig. 1. | ||
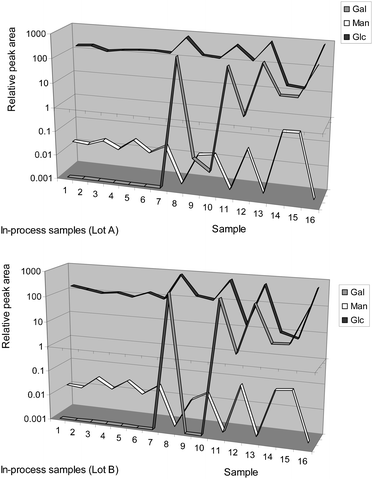 | ||
| Fig. 7 Monosaccharide profiles for two lots of biofermentation in-process broth samples. | ||
Conclusions
A relatively rapid, robust RPLC-FL based method was developed for the determination (both qualitative and quantitative) of up to 10 monosaccharides (glucosamine, mannosamine, galactosamine, galactose, mannose, glucose, ribose, xylose, fucose and sialic acid) in a range of complex samples originating from within the biofermentation production process within the biopharmaceutical industry. Standard analytical performance criteria were used for evaluation purposes, with the method having been found to be both linear and precise, and with LODs meeting the requirements for routine and potentially process monitoring of these important solutes, for both process optimisation and quality control. This paper demonstrates for the first time a single chromatographic method directly applicable to analysis of all three sample matrices and provides the ever increasing biopharmaceutical industry with a new assay to investigate both material quality and complex in-process biochemical processes and interactions, currently not fully understood.Acknowledgements
The authors would like to acknowledge Science Foundation Ireland (grant number 08/SRC/B1412) for research funding under the Strategic Research Cluster programme. We also acknowledge Bristol-Myers Squibb Company for the provision of samples.References
- A. S. Rathore, Trends Biotechnol., 2009, 27, 546 CrossRef CAS.
- International Conference of Harmonisation (ICH), Harmonised Tripartite Guideline: Q8(R2) Pharmaceutical Development,2008 http://www.ich.org/LOB/media/MEDIA4986.pdf, accessed 30th July 2010.
- International Conference of Harmonisation (ICH), Harmonised Tripartite Guideline: Q9 Quality Risk Management, 2005, http://www.ich.org/LOB/media/MEDIA1957.pdf, accessed 30th July 2010.
- International Conference of Harmonisation (ICH), Harmonised Tripartite Guideline: Q10 Pharmaceutical Quality Systems, 2008 http://www.ich.org/LOB/media/MEDIA3917.pdf, accessed 30th July 2010.
- L. W. Dick, Jr, J. A. Kakaley, D. Mahon, D. Qiu and K. Cheng, Biotechnol. Prog., 2009, 25, 570 CrossRef.
- V. P. Hanko and J. S. Rohrer, Anal. Biochem., 2000, 283, 192 CrossRef CAS.
- BD Bionutrients Technical Manual, Advanced Bioprocessing, Becton Dickinson, Franklin Lakes, NJ, 3rd edn, 2006, http://www.bdbiosciences.com/documents/bionutrients_tech_manual.pdf, accessed 12th Nov 2009 Search PubMed.
- M. S. Donaldson and L. Shuler, Biotechnol. Prog., 1998, 14, 573 CrossRef CAS.
- T. M. Larson, M. Gawlitzek, H. Evans, U. Albers and J. Cacia, Biotechnol. Bioeng., 2002, 77, 253.
- A. O. Kirdar, K. D. Green and A. S. Rathore, Biotechnol. Prog., 2008, 24, 720 CrossRef CAS.
- R. Fike, B. Dadey, R. Hassett, R. Radominski, D. Jayme and D. Cady, Cytotechnology, 2001, 36, 33 CrossRef CAS.
- P. M. Hayter, E. M. A. Curling, A. J. Baines, N. Jenkins, I. Salmon, P. G. Strange, J. M. Tong and A. T. Bull, Biotechnol. Bioeng., 1992, 39, 327 CrossRef CAS.
- G. B. Nyberg, R. R. Balcarcel, B. D. Follstad, G. Stephanopoulos and D. I. Wang, Biotechnol. Bioeng., 1999, 62, 336 CrossRef CAS.
- M. Curling, P. M. Hayter, A. J. Baines, A. T. Bull, K. Gull, P. G. Strange and N. Jenkins, Biochem. J., 1990, 272, 333.
- L. Xie and D. I. Wang, Trends Biotechnol., 1997, 15, 109 CrossRef CAS.
- C. Rumpel and M. Dignac, Soil Biol. Biochem., 2006, 38, 1478 CrossRef CAS.
- V. P. Hanko and J. S. Rohrer, Anal. Biochem., 2000, 283, 192 CrossRef CAS.
- R. Andersen and A. Sørensen, J. Chromatogr., A, 2000, 897, 195 CrossRef CAS.
- P. Kerhervé, B. Charrière and F. Gadel, J. Chromatogr., A, 1995, 718, 283 CrossRef CAS.
- L. Liang, P. Zhang, Y. Cai and S. Mou, Chin. J. Anal. Chem., 2006, 34, 1371 CAS.
- C. Panagiotopoulos, R. Sempéré, R. Lafont and P. Kerhervé, J. Chromatogr., A, 2001, 920, 13 CrossRef CAS.
- A. Meyer, H. Fischer, Y. Kuzyakov and K. Fischer, J. Plant Nutr. Soil Sci., 2008, 171, 917 CrossRef CAS.
- K. Račaitytė, S. Kiessig and F. K. álmán, J. Chromatogr., A, 2005, 1079, 354 CrossRef CAS.
- S. Santos, A. Duarte and V. Esteves, Talanta, 2007, 72, 165 CrossRef CAS.
- S. Rovio, J. Yli-Kauhaluoma and H. Siren, Electrophoresis, 2007, 28, 3129 CrossRef CAS.
- S. Rovio, H. Simolin, K. Koljonen and H. Siren, J. Chromatogr., A, 2008, 1185, 139 CrossRef CAS.
- A. Jarmeus and A. Emmer, Chromatographia, 2008, 67, 151 CrossRef CAS.
- Z. Ying, H. Lin-Juan and W. Zhong-Fu, Chin. J. Chem., 2007, 25, 1522 CrossRef.
- K. Anumula, Anal. Biochem., 1994, 220, 275 CrossRef CAS.
- H. Kakita, H. Kamishima, K. Komiya and Y. Kato, J. Chromatogr., A, 2002, 961, 77 CrossRef CAS.
- Y. Yuh, J. Chen and C. Chiang, J. Pharm. Biomed. Anal., 1998, 16, 1059 CrossRef CAS.
- W. Wu, K. Hamase, M. Kiguchi, K. Yamamoto and K. Zaitsu, Anal. Sci., 2000, 16, 919 CAS.
- D. Gomis, D. Tamayo and J. Alonso, Anal. Chim. Acta, 2001, 436, 173 CrossRef.
- H. Kwon and J. Kim, Anal. Biochem., 1993, 215, 243 CrossRef CAS.
- X. Yang, Y. Zhao, Q. Wang, H. Wang and Q. Mei, Anal. Sci., 2005, 21, 1177 CrossRef CAS.
- W. J. Schmidt, W. Kuhlmann and K. Schugerl, Biotechnology, 1985, 21, 78 CAS.
- G. A. Marko-Varga, Anal. Chem., 1989, 61, 831 CrossRef CAS.
- G. Marko-Varga, E. Dominguez, B. Hahn-Hagerdal, L. Gorton, H. Irth, G. J. De Long, R. W. Frei and U. A. Th. Brinkman, J. Chromatogr., A, 1990, 523, 173 CrossRef CAS.
- H. Liden, T. Buttler, H. Jeppsson, G. Marko-Varga, J. Volc and L. Gorton, Chromatographia, 1998, 47, 501 CAS.
- Q. Wang and Y. Fang, J. Chromatogr., B: Anal. Technol. Biomed. Life Sci., 2004, 812, 309 CrossRef CAS.
- S. Honda, E. Akao, S. Suzuki, M. Okuda, K. Kakehi and J. Nakamura, Anal. Biochem., 1989, 180, 351 CAS.
- K. Anumula, Anal. Biochem., 2000, 283, 17 CrossRef CAS.
Footnote |
| † Electronic supplementary information (ESI) available: Concentration data for monosaccharides found in biofermentation samples. See DOI: 10.1039/c0ay00516a |
| This journal is © The Royal Society of Chemistry 2011 |