A one-step sensitive dynamic light scattering method for adenosine detection using split aptamer fragments†
Xiaohai
Yang
,
Jiahao
Huang
,
Qing
Wang
,
Kemin
Wang
*,
Lijuan
Yang
and
Xiqin
Huo
State Key Laboratory of Chemo/Biosensing and Chemometrics, College of Chemistry and Chemical Engineering, Key Laboratory for Bio- Nanotechnology and Molecular Engineering of Hunan Province, Hunan University, Changsha, 410082, China. E-mail: kmwang@hnu.cn.; Fax: +86 731 88821566; Tel: +86 731 88821566
First published on 9th December 2010
Abstract
A one-step sensitive method using dynamic light scattering (DLS) was introduced for direct detection of adenosine with high selectivity. For the first time, DLS was used to detect small molecules directly and quantitatively.
Gold nanoparticles (AuNPs) have become very attractive optical probes because of their high extinction coefficients and strongly distance-dependent optical properties.1 Many molecules, such as protein,2,3DNA,4–6 small biomolecules7 and metal ions8 had been detected based on the aggregation of AuNPs. The aggregation of AuNPs was usually detected directly by observing the color change of the solution from red to purple or monitored by UV-visible absorption spectroscopy. However, the disadvantage of this method was its low sensitivity. For example, the limitation of detection (LOD) of adenosine was about 0.25 mM with the colormetric method.9 In fact, because of the strong light scattering property of AuNPs,10light scattering assays, such as resonance light scattering11–14 and hyper-Rayleigh scattering,15–17 were usually utilized for biomolecular detection. The change of scattered light intensity rather than the change of nanopartilce size was monitored in those works for the detection of biomolecules.
Dynamic light scattering (DLS), which is based on the Brownian motion of particles, have recently been found to be of use for high-sensitivity detection of many targets, such as proteins,18,19DNA20 and metal ions.21 In these works, a sandwich-format assay was usually utilized for the aggregation of AuNPs, and the average particle size change could be monitored using DLS measurements. However, to our surprise, DLS has not been used in conjunction with AuNPs for the detection of small molecules. The possible reason was that the sandwich-format assay was seldom used for the detection of small molecules. There were at least two main factors to hinder “the sandwich-format” assays for detecting small molecules. One was steric hindrance which prevented a small molecule from binding to two antibodies simultaneously.22 On the other hand, a small molecule represented only one epitope or even only part of one epitope, which was not enough for simultaneous binding to two antibodies.23 Therefore, a breakthrough was required in order to achieve “direct” sandwich-format assays for the detection of small molecules. Recently, the “sandwich-format” was used in many methods for the detection of small molecules based on split aptamer fragments, such as the colorimetric method,9,24electrochemical detection25–28 and fluorescence method.29
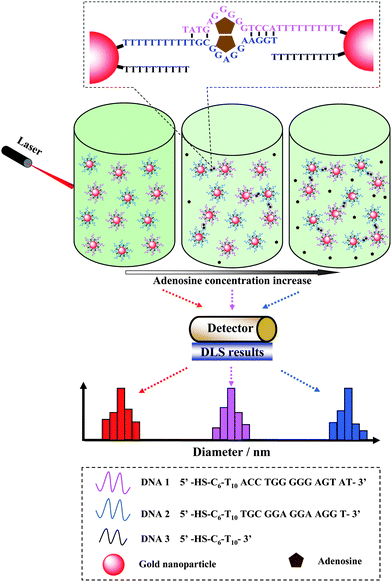
Here, a one-step sandwich-format sensitive method using dynamic light scattering was introduced for direct detection of adenosine with high selectivity based on split aptamer fragments. In this method, the adenosine aptamer was split into two flexible ssDNA fragments. They were modified on the different AuNPs, respectively. In the presence of target adenosine, two kinds of ssDNA fragments modified AuNPs were aggregated due to the formation of adenosine-aptamer complex, and then this procedure could be monitored by dynamic light scattering. The sensitivity was also satisfactory and the limitation of detection (LOD) of this method was ca. 5 orders of magnitude lower than that of the colormetric method.
The principle of dynamic light scattering for detecting adenosine is shown in Scheme 1. The adenosine aptamer was first cut into two flexible ssDNA pieces according to the literature,9DNA1 and DNA2. Then, DNA1 and DNA2 were modified on the surface of different AuNPs, respectively. DNA1 and DNA2 could not form stable intermolecular duplexes in the absence of adenosine. In the presence of adenosine, two ssDNA pieces were reassembled into the intact aptamer structure and the adenosine-aptamer complex was formed. Then the formation of adenosine-aptamer complex led to the aggregation of AuNPs. The AuNPs aggregation could increase the average diameter of the whole nanoparticle population, which was detected by DLS. The concentration of adenosine could be correlated quantitatively by the increase of the average diameter of the nanoparticles.
 | ||
| Scheme 1 Schematic illustration of adenosine detection based on dynamic light scattering. | ||
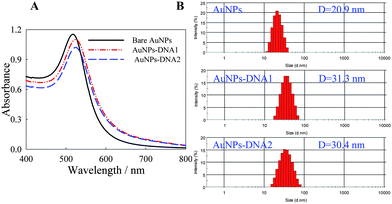
As shown in Fig. 1A, the maximum UV-visible absorption peak of unmodified AuNPs, AuNPs-DNA1 and AuNPs-DNA2 in solution were 518.0 ± 0.5 nm, 525.0 ± 0.5 nm and 525.0 ± 0.5 nm, respectively. DLS measurement was used to monitor the size change of AuNPs before and after modifying with DNA1 and DNA2. As shown in Fig. 2B, the hydrodynamic diameter of the nanoparticles increased slightly from 20.9 ± 0.1 nm to 31.3 ± 0.2 nm for AuNPs-DNA1, and 30.4 ± 0.1 nm for AuNPs-DNA2. It meant that DNA was modified on the surface of AuNPs. In addition, it was demonstrated that DNA modification did not influence the narrow size distribution of AuNPs, and DNA modified AuNPs remained to be individually dispersed in the solution.
 | ||
| Fig. 1 UV-visible absorption spectra (A) and size distribution (B) of AuNPs before and after DNA modification. | ||
 | ||
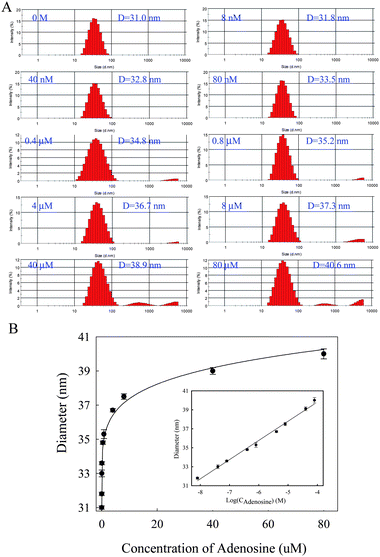
| Fig. 2 Detection of adenosine using DLS. (A) DLS analysis data of DNA-AuNP probes in the presence of different concentrations of adenosine (0 M, 8 nM, 40 nM, 80 nM, 0.4 μM, 0.8 μM, 4 μM, 8 μM, 40 μM and 80 μM). (B) The average diameters of AuNPs as determined from DLS measurement and plotted against the concentration of adenosine. | ||
The detection of different concentrations of adenosine by DLS measurements was demonstrated. As shown in Fig. 2 the average size of AuNPs in the control solution without adenosine was about 31.0 nm. As the concentration of adenosine increased, the average size of AuNPs in the solution increased accordingly, due to the increased quantity of nanoparticle aggregates which were caused by the formation of adenosine-aptamer complex. By analyzing the change of average diameters of AuNPs with the concentration of adenosine, the limitation of detection (LOD) was estimated to be ca. 7 nM (shown in Fig. 2) according to the 3σ rule. This sensitivity is comparable to or better than that of reported detection method for adenosine listed in Table S1 (ESI†). Particularly, it was ca. 5 order of magnitude lower than that of colormetric methods, as reported previously.9 This assay exhibited excellent reproducibility, due to the small standard deviation of each concentration (p < 0.01). According to TEM, when adenosine was added to the mixture of AuNPs-DNA1 and AuNPs-DNA2, dimers, trimers, and larger aggregates are formed (Fig. S1A–C†), depending on the adenosine concentration. Such results also demonstrated that the quantity of nanoparticle aggregates increased when the concentration of adenosine increased.
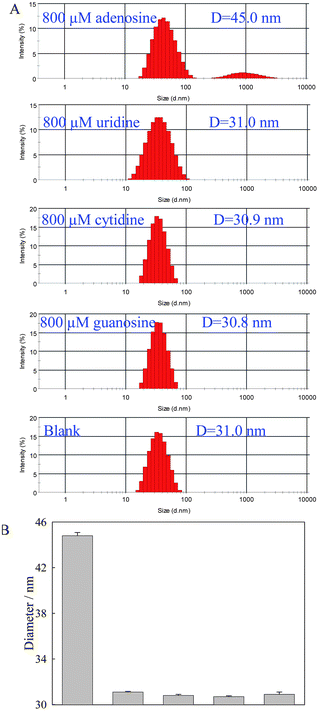
The selectivity is one of the important parameters for the detection assay. DLS analysis data of 800 μM adenosine, uridine, cytidine, and guanosine were compared to investigate the selectivity of this assay. As shown in Fig. 3, for three adenosine analogues, the average size of AuNPs in the solution was about 31.0 nm, which was the same as the average size of AuNPs in the control solution without adenosine. Even the concentration of adenosine was only 8 nM, the difference between adenosine and its analogues were also significant (Fig. S2†). It implied that the split aptamer fragments retained their high selectivity toward adenosine and such an assay showed good selectivity.
 | ||
| Fig. 3 DLS analysis data (A) and the change of size (B) of AuNPs-DNA probes in the presence of 800 μM adenosine and its analogues. | ||
In conclusion, this was the first time that a one-step homogeneous sandwich format assay was introduced for the detection of small molecules using DLS. This assay was extremely easy to conduct and provided a much higher sensitivity compared to colormetric methods, due to the large scattering cross section of AuNPs and the high sensitivity of DLS measurements. The detection limit of such an assay may be improved through some possible approaches such as using nanoparticles with larger scattering cross sections30 or more sensitive DLS detection methods.
This work was supported by the National Natural Science Foundation of China (90606003, 20805012), Chinese 863 High Tech Project (2007AA022007), International Science & Technology Cooperation Program of China (2010DFB30300), Program for New Century Excellent Talents in University (NCET-09-0338), and Hunan Provincial Natural Science Foundation of China (08JJ1002).
Notes and references
- S. Link and M. A. El-Sayed, Int. Rev. Phys. Chem., 2000, 19, 409–453 CrossRef CAS.
- X. Y. Xu, M. S. Han and C. A. Mirkin, Angew. Chem., Int. Ed., 2007, 46, 3468–3470 CrossRef CAS.
- A. Laromaine, L. Koh, M. Murugesan, R. V. Ulijn and M. M. Stevens, J. Am. Chem. Soc., 2007, 129, 4156–4157 CrossRef CAS.
- C. A. Mirkin, R. L. Letsinger, R. C. Mucic and J. J. Storhoff, Nature, 1996, 382, 607–609 CrossRef CAS.
- I. H. Lee, K. A. Yang, J. H. Lee, J. Y. Park, Y. G. Chai, J. H. Lee and B. T. Zhang, Nanotechnology, 2008, 19, 395103 CrossRef.
- F. Mckenzie, K. Faulds and D. Graham, Chem. Commun., 2008, 2367–2369 RSC.
- J. W. Liu and Y. Lu, Angew. Chem., Int. Ed., 2006, 45, 90–94 CrossRef CAS.
- J. W. Liu and Y. Lu, Chem. Commun., 2007, 4872–4874 RSC.
- F. Li, J. Zhang, X. Cao, L. H. Wang, D. Li, S. P. Song, B. C. Ye and C. H. Fan, Analyst, 2009, 134, 1355–1360 RSC.
- P. K. Jain, K. S. Lee, I. H. El-Sayed and M. A. El-Sayed, J. Phys. Chem. B, 2006, 110, 7238–7248 CrossRef CAS.
- J. Q. Zhang, Y. S. Wang, Y. He, T. Jiang, H. M. Yang, X. Tan, R. H. Kang, Y. K. Yuan and L. F. Shi, Anal. Biochem., 2010, 397, 212–217 CrossRef CAS.
- H. H. Cai, P. H. Yang, J. Feng and J. Y. Cai, Sens. Actuators, B, 2009, 135, 603–609 CrossRef.
- C. Xie, F. Xu, X. Huang, C. Dong and J. Ren, J. Am. Chem. Soc., 2009, 131, 12763–12770 CrossRef CAS.
- Z. Jiang, Y. Fan, M. Chen, A. Liang, X. Liao, G. Wen, X. Shen, X. He, H. Pan and H. Jiang, Anal. Chem., 2009, 81, 5439–5445 CrossRef CAS.
- G. K. Darbha, U. S. Rai, A. K. Singh and P. C. Ray, Chem.–Eur. J., 2008, 14, 3896–3903 CrossRef CAS.
- J. Griffin, A. K. Singh, D. Senapati, E. Lee, K. Gaylor, J. J. Boone and P. C. Ray, Small, 2009, 5, 839–845 CrossRef CAS.
- P. C. Ray, Angew. Chem., Int. Ed., 2006, 45, 1151–1154 CrossRef CAS.
- H. Jans, X. Liu, L. Austin, G. Maes and Q. Huo, Anal. Chem., 2009, 81, 9425–9432 CrossRef CAS.
- X. Liu, Q. Dai, L. Austin, J. Coutts, G. Knowles, J. Zou, H. Chen and Q. Huo, J. Am. Chem. Soc., 2008, 130, 2780–2782 CrossRef CAS.
- Q. Dai, X. Liu, J. Coutts, L. Austin and Q. Huo, J. Am. Chem. Soc., 2008, 130, 8138–8139 CrossRef CAS.
- J. R. Kalluri, T. Arbneshi, S. A. Khan, A. Neely, P. Candice, B. Varisli, M. Washington, S. McAfee, B. Robinson, S. Banerjee, A. K. Singh, D. Senapati and P. C. Ray, Angew. Chem. Int. Ed., 2009, 48, 9668–9671 CAS.
- X. L. Zuo, Y. Xiao and K. W. Plaxco, J. Am. Chem. Soc., 2009, 131, 6944–6945 CrossRef CAS.
- N. Kobayashi, H. Oyama, I. Suzuki, Y. Kato, T. Umemura and J. Goto, Anal. Chem., 2010, 82, 4333–4336 CrossRef CAS.
- J. Zhang, L. H. Wang, D. Pan, S. P. Song, F. Y. C. Boey, H. Zhang and C. H. Fan, Small, 2008, 4, 1196–1200 CrossRef CAS.
- E. Golub, G. Pelossof, R. Freeman, H. Zhang and I. Willner, Anal. Chem., 2009, 81, 9291–9298 CrossRef CAS.
- X. L. Zuo, Y. Xiao and K. W. Plaxco, J. Am. Chem. Soc., 2009, 131, 6944–6945 CrossRef CAS.
- R. Freeman, Y. Li, R. Tel-Vered, E. Sharon, J. Elbaz and I. Willner, Analyst, 2009, 134, 653–656 RSC.
- Y. Du, C. G. Chen, J. Y. Yin, B. L. Li, M. Zhou, S. J. Dong and E. K. Wang, Anal. Chem., 2010, 82, 1556–1563 CrossRef CAS.
- Z. A. Xu, Y. Sato, S. Nishizawa and N. Teramae, Chem.–Eur. J., 2009, 15, 10375–10378 CrossRef CAS.
- J. Yguerabide and E. E. Yguerabide, Anal. Biochem., 1998, 262, 137–156 CrossRef CAS.
Footnote |
| † Electronic supplementary information (ESI) available: Experimental section. See DOI: 10.1039/c0ay00709a |
| This journal is © The Royal Society of Chemistry 2011 |
