Container-less polymerization in acoustically levitated droplets: an analytical study by GPC and MALDI-TOF mass spectrometry
Jork
Leiterer
a,
Ulrich
Panne
ab,
Andreas F.
Thünemann
a and
Steffen M.
Weidner
*a
aBAM Bundesanstalt für Materialforschung und -prüfung, Richard-Willstätter-Str. 11, 12489, Berlin, Germany. E-mail: steffen.weidner@bam.de
bHumboldt-Universitaet zu Berlin, Department of Chemistry, Brook-Taylor-Strasse 2, 12489, Berlin, Germany
First published on 12th November 2010
Abstract
Molecular masses and end groups of polystyrene (PS) formed in a novel container-less polymerization strategy, based on levitated droplets in an acoustic trap, were determined by Gel Permeation Chromatography (GPC) and Matrix-assisted Laser Desorption/Ionization Time of Flight Mass spectrometry (MALDI-TOF MS).
Introduction
Well-defined polymers can be pivotal in many applications in analytical chemistry e.g. as polymer monoliths for the ion exchange chromatography,1 for novel chemical sensors for rapid bioanalysis2 and for molecularly templated materials.3 For a wide range of materials, functionality can be achieved using controlled polymerization techniques. The polymerization process can be influenced by interactions with the sample container. Wall effects were supposed to be responsible for initiating the polymerization of vinylacetate.4 Ohsaka et al. found that undercooling of liquid samples can be suppressed by the prevention of heterogeneous nucleation initiated by the sample container.5 Levitated droplets offer a unique way to exclude any interaction of reacting systems with solid container walls. Several studies have been performed applying optical and electrodynamic levitation in synthesis.6,7 Optical levitation is based on the use of focused laser beams, where their radiation is well known to initiate an unwanted photochemical polymerization of monomers. The electrodynamic levitation is characterized by a high energy deposit used for the continuous reversion of the surface polarity of the droplet. Moreover, high charge densities generated in the droplets can affect the evaporation rate of the solvent and may even lead to instability of the droplets (Coulomb explosion).8 In contrast to these principles, acoustically levitated droplets limit possible interactions. In addition, the droplet volume can be significantly larger compared to preceding levitation techniques. Recently an ultrasonic trap was used to monitor the polymerization of acrylic acid by Raman spectroscopy. The amount of residual monomer was determined by HPLC.9 Earlier work reported in situmass spectrometry of levitated droplets by means of charge assisted laser desorption/ionization (CALDI).10,11 The objective of this work was to demonstrate the suitability of performing a polymerization in a levitated droplet. Here, the results of the investigation of such in stillo (in drop) polymerization of styrene by means of gel permeation chromatography (GPC) and matrix-assisted laser desorption ionization-mass spectrometry (MALDI-TOF-MS) are presented.Experimental
Styrene (H5C6–CH![[double bond, length as m-dash]](https://www.rsc.org/images/entities/char_e001.gif) CH2) represents an uncolored liquid with a boiling point of 145 °C. It is typically used in industry for the production of polystyrene (PS) as well as synthetic butadiene rubber (SBR), acrylonitril butadiene styrene (ABS), and styrene acrylonitrile (SAN).
CH2) represents an uncolored liquid with a boiling point of 145 °C. It is typically used in industry for the production of polystyrene (PS) as well as synthetic butadiene rubber (SBR), acrylonitril butadiene styrene (ABS), and styrene acrylonitrile (SAN).
Ultrasonic trap
In our approach a typical volume of 4 µL styrene was directly injected in the acoustic levitator (Tec5, Oberursel, Germany) using a common Eppendorf pipette (size 0.5–10 µL, Eppendorf, Germany). An ultrasonic wave with a frequency of 58 kHz emitted by a sonotrode is reflected by a concave acoustic mirror to generate a standing acoustic wave with a defined number of local nodes (typically three to five). In each node of the standing sound wave a sample can be placed and held in a stable position. During levitation the size and shape of levitated droplets were monitored continuously. The distinct shadow graph of the droplet obtained by illumination with a telecentric infra-red flash light allows a precise calculation of the droplet volume by the cross-sectional area.12 The experimental set-up of the acoustic levitator was described in detail earlier.13Fig. 1 displays a droplet of styrene being hovered in the central node of the standing wave in the acoustic levitator (trap). The axis of this trap is vertically aligned and causes the flattening of the droplet to a nearly oblate rotational ellipsoid. The droplet was illuminated by a blue laser beam (Ar-ion at λ = 488 nm) which is mainly scattered at the equator of the droplet.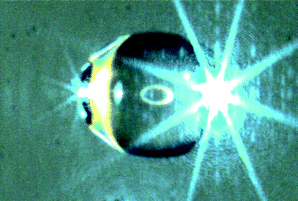 | ||
| Fig. 1 Levitated droplet of styrene illuminated with blue laser beam. The horizontal directed light is mainly scattered at the equator of the droplet. An additional ring illumination is reflected on the center of the droplet surface. | ||
Polymerization
The polymerization was performed at ambient temperature. Since the laser irradiation (10 mW) was not sufficient for initiating a radical mechanism of polymerization, trifluoromethanesulfonic acid (TFMS) was applied for starting the reaction. For this purpose, 5 mL TFMS in a glass pipette was placed in close vicinity of the droplet to initiate the reaction through the gas phase. An immediate reaction, an instantly white to milky dyeing of the droplet, was observed. During polymerization the droplet undergoes a simultaneous evaporation of styrene, which could be determined by monitoring the droplet volume. After the sample volume remains at a constant value during certain minutes the reaction was considered as terminated. Finally, the solid reaction product (soft sphere) was manually removed from the levitator and directly dissolved in tetrahydrofuran (THF) to stop any further polymerization.Gel permeation chromatography (GPC)
GPC was performed to analyze the molecular mass distribution of the samples. A PL 220 high-temperature chromatograph (Polymer Laboratories—PL, UK) running with THF as solvent at a temperature of 35 °C was used. The flow rate was 1 mL min−1. The separation was performed using three linear GPC columns (Polymer Laboratories, UK, 5 µm) with a size of 300 mm × 8 mm. For detection, a refractive index detector (ERC 7510, ERMA Inc.) was used. The synthesized samples (each 0.1–0.5 mg) were dissolved in 2 mL of THF. These solutions were filtrated before injection using PTFE syringe filters with an average pore size of 0.2 µm. A volume of 200 µL was injected for a single run. The calibration was performed in a range from 375 to 3![[thin space (1/6-em)]](https://www.rsc.org/images/entities/char_2009.gif) 400000 g mol−1 with commercially available polystyrene standards (Polymer Standards Service—PSS, Mainz, Germany) using the WinGPC unity software (PSS).
400000 g mol−1 with commercially available polystyrene standards (Polymer Standards Service—PSS, Mainz, Germany) using the WinGPC unity software (PSS).
Matrix-assisted laser desorption/ionization time-of flight mass spectrometry (MALDI-TOF MS)
A Bruker ReflexIIImass spectrometer (Bruker-Daltonik, Germany), operating at an acceleration voltage of 20 kV, was used. For ionization/desorption, a nitrogen UV laser (337 nm, pulse width 3 ns) was applied. Typically, 100–200 transients were accumulated for one spectrum. Retinoic acid was used as matrix for the preparation of matrix-sample spots. Matrix solutions with a concentration of 10 mg mL−1 (in THF) were pre-mixed (2:1, v/v) with polymer solutions (1 mg mL−1). In addition, 1 µL of a solution of silver trifluoroacetate (0.1 mol L−1 in THF) was added to this mixture to enable the ionization of the comparatively non-polar polystyrene in the MALDI process.14 The mass spectrometer was calibrated with different standard peptides, as well as by self-calibrating methods using polymers.
Results and discussion
The molecular mass distributions of two different polymerizations in a droplet determined by GPC are presented in Fig. 2. Obviously, both curves look very similar. They are characterized by three peaks at approximately 400, 800 and 10000 g mol−1. Additionally, a small shoulder near 1600 g mol−1 can be observed in each curve.
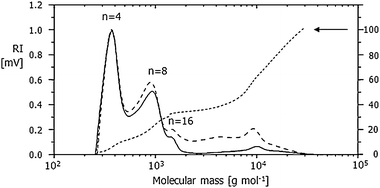 | ||
| Fig. 2 Typical molecular mass distribution of two polystyrene samples (solid and dashed line) derived from GPC chromatograms (normalized to the intensity at the first maximum) and integral distribution (dotted line). | ||
In contradiction to the general assumption of an initiation of a cationic polymerization of styrene with TFMS, kinetic and conductometric measurements performed by Chmelir et al.15 proved that the initiating step does not proceed by a simple addition of the proton to the double bound of the monomer. In addition to the expected chain propagation, a bimolecular reaction of two propagating molecules was reported.16 This could be one possible reason for the formation of even-numbered (marked in Fig. 2, n = 4, 8, 16) species. In literature several investigations of low-molecular reaction products (trimers, tetramers, etc.) and cyclic intermediates by NMR, conductivity measurements, and GPC have been reported.17–19 Especially the formation of tetramers could be confirmed by our GPC results. Another reason can be seen in the specific reaction conditions (polymerization in bulk) applied here. Internal flows of the liquid droplet induced by the external acoustic sound field are well known.20 During polymerization, the viscosity of the liquid obviously increased until the droplet became solid. Additionally, the polymerization starts simultaneously at various places of the levitated droplet taking the high surface–volume ratio of the small droplet into account. Although these influences are not yet fully understood, they are supposed to contribute to this rather non-typical molecular mass distribution, compared to other mechanisms of polymerization. As revealed by the integral in Fig. 2, at least half of the polymer consists of macromolecules with masses larger than 9500 g mol−1. This corresponds to average chain lengths of 90 repeating units.
In order to determine the chemical structure of the formed polystyrene these samples were additionally analyzed by means of MALDI-TOF mass spectrometry. In Fig. 3 a MALDI-TOF mass spectrum of one polystyrene sample is exemplarily shown. Since the polymer polydispersity revealed by GPC was larger than 1.2, MALDI-TOF-MS was not able to provide a correct molecular mass distribution. Nevertheless, MALDI-TOF data could be used for an accurate end group determination. Up to m/z 8000 clear signals showing typical peak-to-peak distances of m/z 104 (mass of a polystyrene repeating unit) were obtained. The residual mass of m/z 2 can be explained by the formation of two hydrogen terminal-groups, which very well corresponds to the proposed bimolecular termination of two polymer chains or to a chain transfer reaction with water (moisture).15,17,21 The inset of Fig. 3 shows a mass region between m/z 2800 and 3000. In this region a second polymer distribution with a peak-to-peak distance of m/z 104 is visible. The residual mass of m/z 58 can be attributed to a hydrogen/tertiary butyl end group combination. The attachment of a tertiary butyl group can be easily explained. Due to the latent formation of unstable organic peroxides in tetrahydrofuran, this solvent has to be stabilized with 2,6-di-tert-butyl-4 methylphenol (butylhydroxytoluene, BHT) which acts as a scavenger for radicals. The dissolving of the droplet in THF causes the termination of polymerization. In contrast to the predominant bimolecular termination of two polymer radicals, the average molecular mass of polymers formed in this side reaction has to be much lower. This could be confirmed by our findings (∼3900 g mol−1). This termination reaction according to a radical mechanism very well corresponds to the findings of Mahmoud et al. They reported a deprotonation of the styrene dimer by proton transfer to water (moisture) and the formation of a dimer radical that may continue to propagate upon the addition of further styrene molecules via the radical mechanism.22 The proposed mechanism for the initiation, chain propagation and termination is shown in Fig. 4.
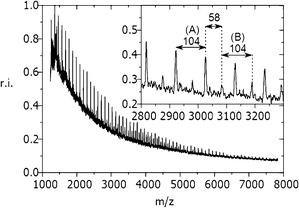 | ||
| Fig. 3 Typical MALDI-TOF mass spectrum of a broadly distributed polymer. Peak-to-peak distances of m/z 104 represent the mass of polystyrene repeating units of structure (A). Additionally, a second mass distribution (B) with the same repeating unit distance shifted by m/z +58 can be found between m/z 2800 and 5200. | ||
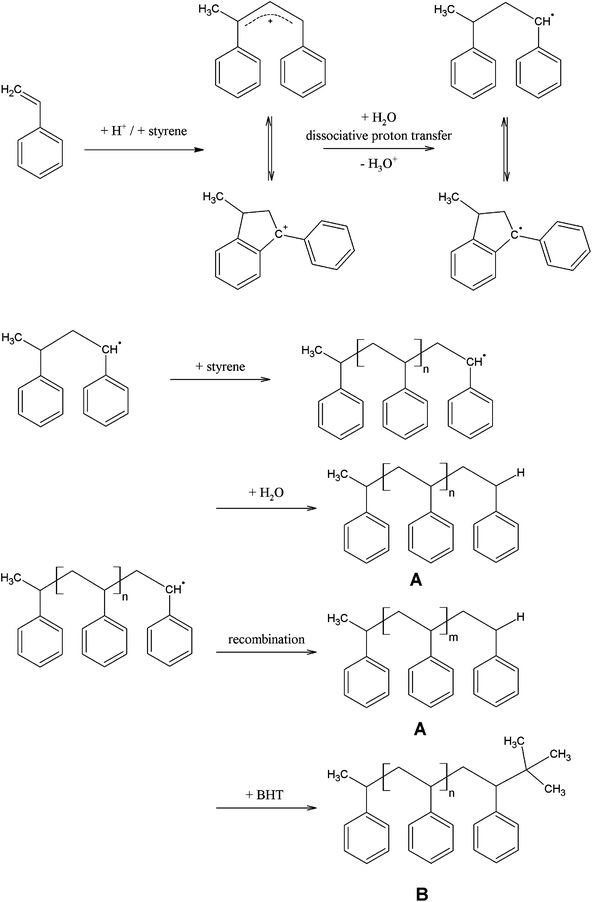 | ||
| Fig. 4 Proposed mechanism for the initiation, chain propagation and termination of trifluoromethanesulfonic acid (TFMS) initiated polymerization of styrene determined by MALDI-TOF mass spectrometry. | ||
Conclusion
For the first time MALDI-TOF MS and GPC were used to investigate polymers synthesized in a container-less polymerization with the special conditions of an ultrasonic trap. Using polystyrene it could be exemplarily shown that the obtained GPC mass distribution shows reproducible but non-uniform curves. By means of MALDI-TOF mass spectrometry end group identification could be achieved, which is in accordance with the proposed mechanism of trifluoromethanesulfonic acid (TFMS) initiated styrene polymerization. Although today the molar mass distribution is not predictable, the ultrasonic trap can be used as a tool to archive specific mass distributions.Acknowledgements
The authors would like to thank the Federal Institute for Materials Research and Testing (BAM) for technical support and V. Neyen, D. Berners, and D. Ehrhardt for chromatographic analysis and excellent experimental support.References
- A. Nordborg and E. F. Hilder, Anal. Bioanal. Chem., 2009, 394, 71–84 CrossRef CAS.
- P. A. Lieberzeit and F. L. Dickert, Anal. Bioanal. Chem., 2008, 391, 1629–1639 CrossRef CAS.
- E. L. Holthoff and F. V. Bright, Anal. Chim. Acta, 2007, 594, 147–161 CrossRef CAS.
- J. Breitenbach and H. Kauffmann, Makromol. Chem., 1974, 175, 2597–2604 CrossRef CAS.
- K. Ohsaka, E. H. Trinh and M. E. Glicksman, J. Cryst. Growth, 1990, 106, 191–196 CrossRef CAS.
- J. Musick, J. Popp, M. Trunk and W. Kiefer, Appl. Spectrosc., 1998, 52, 692–701 CrossRef CAS.
- R. Gussgard, T. Lindmo and I. Brevik, J. Opt. Soc. Am. B, 1992, 9, 1922–1930 CrossRef.
- T. Achtzehn, R. Muller, D. Duft and T. Leisner, Eur. Phys. J. D, 2005, 34, 311–313 CrossRef CAS.
- S. Biedasek, M. Abboud, H. U. Moritz and A. Stammer, Macromol. Symp., 2007, 259, 390–396 CrossRef CAS.
- K. Jorabchi and L. M. Smith, Anal. Chem., 2009, 81, 9682–9688 CrossRef CAS.
- M. S. Westphall, K. Jorabchi and L. M. Smith, Anal. Chem., 2008, 80, 5847–5853 CrossRef CAS.
- J. Leiterer, F. Emmerling, A. F. Thünemann and U. Panne, Z. Anorg. Allg. Chem., 2006, 632, 2132 CrossRef.
- J. Leiterer, F. Delißen, F. Emmerling, A. Thünemann and U. Panne, Anal. Bioanal. Chem., 2008, 391, 1221–1228 CrossRef CAS.
- M. S. Kahr and C. L. Wilkins, J. Am. Soc. Mass Spectrom., 1993, 4, 453–460 CrossRef CAS.
- M. Chmelir, N. Cardona and G. V. Schulz, Makromol. Chem., 1977, 178, 169–185 CrossRef CAS.
- A. Gandini and P. H. Plesch, Eur. Polym. J., 1968, 4, 55–74 CrossRef CAS.
- B. Charleux, A. Rives, J. P. Vairon and K. Matyjaszewski, Macromolecules, 1996, 29, 5777–5783 CrossRef CAS.
- M. Sawamoto and T. Higashimura, Macromolecules, 1981, 14, 467–471 CrossRef CAS.
- M. Villesange, A. Rives, C. Bunel, J. P. Vairon, M. Froeyen, M. Vanbeylen and A. Persoons, Makromol. Chem., Macromol. Symp., 1991, 47, 271–275 Search PubMed.
- S. K. Chung and E. H. Trinh, J. Cryst. Growth, 1998, 194, 384–397 CrossRef CAS.
- B. Charleux, A. Rives, J. P. Vairon and K. Matyjaszewski, Macromolecules, 1998, 31, 2403–2408 CrossRef CAS.
- H. Mahmoud, I. N. Germanenko, D. Wright and M. S. El-Shall, J. Phys. Chem. A, 2005, 109, 4474–4483 CrossRef CAS.
| This journal is © The Royal Society of Chemistry 2011 |