Rapid speciation analysis of mercury by short column capillary electrophoresis on-line coupled with inductively coupled plasma mass spectrometry
Bao-Hui
Li
*
College of Environmental Science & Engineering, North China Electric Power University, 619 Yonghua North Street, Baoding City, 071003, China. E-mail: bhlli@mail.nankai.edu.cn; Tel: +86 312 7522243
First published on 12th November 2010
Abstract
A method for mercury high throughput rapid speciation analysis was developed by short column capillary electrophoresis (SC-CE) coupled with inductively coupled plasma mass spectrometry (ICP-MS). A MicroMist nebulizer was employed to increase the nebulization efficiency and a laboratory-made removable SC-CE-ICP-MS interface on the basis of cross design was applied to alleviate buffer contamination of ICP-MS. In less than 60 s, methylmercury (MeHg(I)) and inorganic mercury (Hg(II)) were separated in a 16 × 75 μm i.d. short fused-silica capillary at 21 kV, while a mixture of 30 mmol L−1boric acid + 5% (v/v) CH3OH (pH = 8.60) acted as running electrolyte. The precisions (RSD, n = 5) of migration time and peak area for MeHg(I) and Hg(II) were in the range of 1.4–2.6% and 3.3–3.4%, respectively. The limits of detection (3σ) mercury species were 9.7 μg L−1 and 12.0 μg L−1, respectively. The recoveries for Hg(II) and MeHg(I) were in the range of 96–107% and 99–105%.
Introduction
Mercury is an environmentally and toxicologically important element and is one of the most widely studied heavy metals because of the toxicological and biogeochemical behavior of its organic and inorganic compounds.1 It is well known that the toxicity of mercury is highly dependent on its chemical form. As the most toxic species of mercury found in environmental and biological materials, MeHg(I) is of particular concern to people because it can be accumulated through the food chain.2 Generally, the concentration of mercury species in environmental or biological samples is very low. Therefore, it is essential to both determine mercury species rapidly and sensitively for the interpretation of their biochemical behavior or the assessment of the potential danger to organisms.In all kinds of developed analytical techniques for mercury speciation studies, hybrid approaches are predominant. Generally, the methodologies mainly involve a chromatographic technique such as gas chromatography (GC)3,4 and high performance liquid chromatography (HPLC)5–7 coupled with a highly sensitive element-specific detector, such as atomic absorption spectrometry (AAS),8,9atomic fluorescence spectrometry (AFS),10 inductively coupled plasma-mass spectrometry (ICP-MS),11 microwave induced plasma-atomic emission spectroscopy,12inductively coupled plasma atomic emission spectrometry (ICP-AES),13etc.
The application of capillary electrophoresis (CE) to speciation studies has been growing rapidly in the past few decades. CE is a separation technique where the analytes are separated based on their different apparent mobilities under an electric field. Theoretically, since the interaction that exists between the analytes and the solid phase in the chromatographic column is avoided, the analytes can be separated with only a minor disturbance to the existing equilibrium.14 At the same time, CE has many advantages, such as high resolving power, rapid and efficient separations, minimal sample and reagent consumption, etc. Therefore, speciation separation employing CE is feasible,15–17 and CE has been employed in mercury speciation analysis successfully.18–21
Currently, different instruments have been employed as on-line element-specific detectors for mercury elemental speciation in CE separation, such as amperometry,22 flame-AAS,23AFS,24ICP-MS,25etc. The coupling of CE with ICP-MS or ICP-AES provides a very sensitive, element specific detection method in conjunction with high separation efficiency. Different ICP-MS modes have been employed as mercury speciation analysis approaches successfully, such as CE-volatile species generation (VSG)-ICP-MS,26 CE-micro concentric nebulizer (MCN)-ICP-MS,27 CE-double focus (DF)-ICP-MS,28etc.
Compared with HPLC-ICP-MS, CE-ICP-MS takes less time because of the quicker separation speed of CE, therefore the utilization efficiency of hyphenation instruments, especially ICP-MS, has been improved remarkably. However, conventional CE separation typically takes 3–5 min or even longer per an analysis. It means that the ICP-MS instrument is mostly idle during the whole analytical time and the comprehensive efficiency of the hyphenated instruments is decreased. Obviously, considerably shortening this idle time is one of the best approaches for increasing the efficiency of the hyphenated instruments. This can be achieved either by a higher separation voltage or a shorter column separation system.29 Because of the limitation of the maximum voltage of the instrument and the Joule heating effect, shorter column separation systems, such as microfabricated analytical systems and short column CE (SC-CE) are preferred.
Microfabricated analytical systems whose separation mechanism depends on electrophoresis have reduced separation time since the separation channel is thinner and shorter than that of CE. Microchip capillary electrophoresis (Chip-CE) coupled with ICP-MS has been used to separate chromium species successfully.30 SC-CE is an attractive alternative method to Chip-CE owing to the following advantages: (i) easy availability and sufficient utilization of existing CE instrument, which means that the purchase of new apparatus is unnecessary; (ii) easy operation of SC-CE in comparison with Chip-CE; (iii) less jam of rounded capillary than trapezoid chip-CE channels.
Herein, we report a hyphenation technique for high throughput rapid speciation analysis of trace mercury by interfacing SC-CE to ICP-MSvia laboratory-made removable interface. Because of the reduction of the capillary length, SC-CE dramatically reduced the separation time. The advantages of the hyphenation technique included its simplicity, easy operation, high sensitivity, and rapid analysis.
Experimental
Instrumental
An X Series quadrupole ICP-MS (Winsford, Cheshire, UK) with a MicroMist nebulizer (MM, GE, Australia) was used for determination. Prior to hyphenation, the operation conditions were optimized and the optimum result is shown in Table 1.| ICP-MS instrument | Thermo Elemental X Series ICP-MS |
|---|---|
| Plasma RF power/W | 1200 |
| Plasma gas flow rate/(l min−1) | 14 |
| Auxiliary gas flow rate/(l min−1) | 0.77 |
| Nebulizer gas flow rate/(l min−1) | 0.89 |
| Nebulizer | MicroMist |
| Sampler (Ni)/mm | 1.14 |
| Skimmer (Ni)/mm | 0.89 |
| Sampling depth/step | 70 |
| Resolution | Normal |
| Isotope monitored | Hg202 |
All separation operations were carried out on a TH-2000 CE system with a constant voltage separation mode (Baoding Tianhui separation science institute, China). The separation capillary was a 75 μm i.d. fused-silica capillary (Yongnian Optical Fiber Co. Ltd., Hebei Province, China).
New capillary was conditioned by flushing with methanol for 20 min, 0.5 M HCl for 5 min, H2O for 2 min and 0.5 mol L−1NaOH for 20 min. Between two separations, the capillary was flushed with buffer for 1 min. The capillary was reconditioned daily by flushing with methanol, 0.5 mol L−1HCl, 0.5 mol L−1NaOH and H2O for 3 min, respectively. Between two separations, the capillary was flushed with buffer for 1 min. Samples were injected into the capillary with hydrodynamic pressure at 12 kPa for 6 s.
Reagents
All chemicals were at least of the analytical grade and used without further purification. Doubly deionized water (DDW, 18.2 mΩ cm) obtained form a waterPro water system (Labconco Corporation, Kansas, MO, USA) was used throughout. Prior to use, all glassware was immersed in 10% (v/v) HNO3 solution for at least 24 h and rinsed with DDW.Boric acid (Beijing Chemicals Co., Beijing, China) and methanol (Taixing Chemicals Co., Tianjin, China) were used to prepare the electrolyte buffer solution. The pH of buffer solution was adjusted with 0.1 mol L−1 mol L−1NaOH (Taixing Chemicals Co., Tianjin, China). The buffer was filtered through a 0.45 μm filter prior to use.
The stock solutions of MeHg(I) of 1000 mg L−1 (as Hg) were prepared by dissolving suitable amounts of methylmercury chloride (Alfar Aesar) in methanol. Mercury chloride was dissolved in DDW directly to obtain the stock solution of Hg(II) of 1000 mg L−1. All stock solutions were stored at 4 °C in the dark. Working solutions were prepared by stepwise diluting the stock solutions in 0.05% (m/v) aqueous cysteine (Sigma) solution just before use.
CE-ICP-MS interface
The homemade CE-ICP-MS interface used in this work is shown in Fig. 1, as described in detail elsewhere.31 Briefly, a 1/16-inch polyetheretherketone (PEEK) cross fitting was employed to connect the make-up solution delivery tubing, the Pt electrode, the CE capillary and the polytetrafluoroethylene (PTFE) tubing (to the ICP-MS system). The PTFE tubing was connected with the tail tubing of MicroMist by an elastic pumping tubing (1.0 cm × 0.5 mm i.d.). One end of the pumping tubing was fixed to the PTFE tubing, the other end and the tail tubing of MicroMist could be connected together and disconnected conveniently dependant on the elasticity of pumping tubing. During the rinse, the tail tubing of MicroMist was disconnected from the pumping tubing so as to prevent rinse solution from the ICP-MS and alleviate buffer contamination. To reduce the diffusion of sample zone, the capillary was inserted through the PEEK cross to the end of the PTFE tubing. The CE capillary outlet was grounded through a Pt electrode and the sheath flow of the make-up solution (0.5% (v/v) HNO3) was supplied by a peristaltic pump of the X Series ICP-MS instrument. The mixture of CE effluent and HNO3 solution was atomized, and introduced into the ICP-MS by an argon carrier.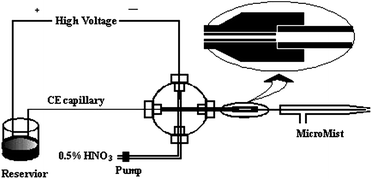 | ||
| Fig. 1 Schematic diagram of the CE-ICP-MS (not to scale). | ||
Sample preparation
At first all water samples were filtrated with ashless filter paper, then filtered through a 0.45 μm filter. After filtering, the water samples were analysed by CE. The spiked water samples were prepared by adding Hg(II) and MeHg(I) standard solution into water samples.Results and discussion
Matching sample uptake flow rate with make-up solution flow rate
Whether the sample uptake flow rate caused by the self-aspiration effect of MicroMist matches the make-up solution flow rate is the key to success. For the experiment, since a 16 cm short column was employed, the effect of sample uptake and make-up solution mismatch was remarkable. If the make-up solution flow rate is greater than the sample uptake flow rate, the migration time will be prolonged because of the pressure caused by the make-up solution, which is opposite to the direction of electroosmotic flow (EOF). On the contrary, if the make-up solution flow rate is less than the sample uptake flow rate, the separation efficiency of CE capillary may be deteriorated due to the appearance of laminar flow, which forms by the draw of sample uptake flow rate.On condition that the flow rate of make-up solution is invariable, not only rotate speed of pump but also the pulse of make-up solution is dependant on the inner diameter of pump tubing. Obviously, the thinner inner diameter of pump tubing is suitable for CE-ICP-MS since it provides more stable make-up solution. Two kinds of pump tubing whose inner diameter was 0.50 mm and 0.38 mm, respectively, were tested. In order to improve experimental reproducibility, the 0.38 mm pump tubing was chosen.
Theoretically, the flow rate of make-up solution should be equal to the sample uptake flow rate of MicroMist. In fact, it is difficult to acquire such perfect condition since the increase of make-up solution flow rate is discontinuous, which depends on the rotation speed of the pump. At the same time, choosing lower flow rate helped to shorten separation time on condition that Hg(II) and MeHg(I) were separated completely. Therefore, several different flow rates of make-up solution close to sample uptake flow rate (0.202 mL min−1) were examined (see Fig. 2). It could be seen that with the increase of flow rate of make-up solution, the resolution of Hg(II) and MeHg(I) improved gradually. A lower flow of make-up solution (0.174 mL min−1) could not separate Hg(II) and MeHg(I) completely due to a faster sample uptake flow rate than the flow rate of make-up solution. A faster flow rate of make-up solution (0.199 mL min−1) would lead to longer migration time. To obtain baseline separation of Hg(II) and MeHg(I) in the shortest migration, the 0.186 mL min−1 of make-up solution was chosen.
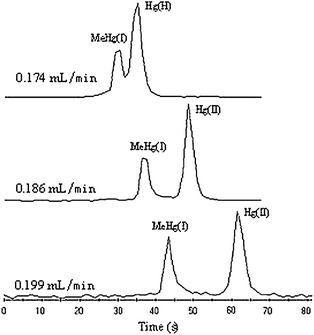 | ||
| Fig. 2 The effect of flow rate of make-up solution on resolution of Hg(II) and MeHg(I) (0.5 mg L−1 each). Electrophoresis conditions: buffer, 30 mmol L−1boric acid + 5% (v/v) methanol (pH = 8.60); capillary column, 16 cm × 75 μm i.d.; separation voltage, 21 kV; injection volume, 6 s × 8 kPa. ICP-MS conditions: HNO3 concentration, 0.5% (v/v); all the other ICP-MS conditions are the same as in Table 1. | ||
Effect of HNO3 concentration in make-up solution
The make-up solution serves multiple functions, such as closing electro-circuit, taking CE effluent into ICP-MS, washing out memory effect. Therefore, dilute HNO3 was used as make-up solution and the effect of HNO3 concentration on the intensities of Hg was investigated in a range of 0.1–5.0% (v/v) (see Fig. 3). The intensities of Hg(II) and MeHg(I) decreased with the increasing of HNO3 concentration. It is well known that the nebulization efficiency is in inverse proportion to the viscosity of HNO3 make-up solution, while viscosity depends on the concentration of HNO3 solution. So it is obvious that the lower concentration HNO3 solution can obtain higher signal intensities. At the same time, as washing solution, the concentration of HNO3 solution would be kept at an appropriate level, or the memory effect could not be removed efficiently. Accordingly, 0.5% (v/v) HNO3 solution was included in the make-up solution.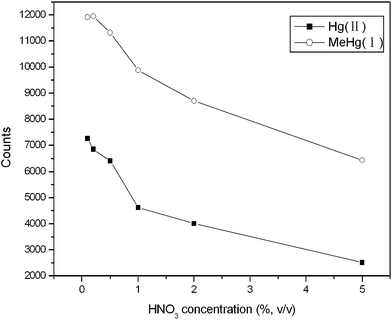 | ||
| Fig. 3 The effect of HNO3 concentration on the intensities of Hg(II) and MeHg(I) (0.5 mg L−1 each). The flow rate of make-up solution is 0.186 mL min−1. The other conditions are the same as Fig. 2. | ||
CE separation
The length of CE capillary is one of the important factors to effect the analytical time. While separation voltage was kept at 21 kV, the analytical time was in direct proportion to the length of capillary. For rapid analysis, it is necessary to shorten capillary length as soon as possible. The length of CE capillary was optimized with separation voltage at 21 kV and the result is shown in Fig. 4. Although Hg(II) and MeHg(I) could be separateed completely at all of the three lengths of CE capillary, considering the shorter analytical time, 16 cm-long capillary was chosen.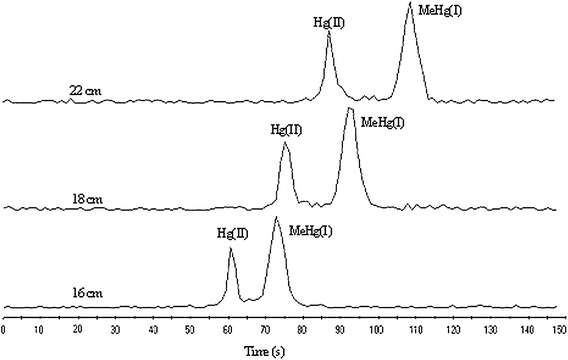 | ||
| Fig. 4 Short-column CE-ICP-MS electropherograms of Hg(II) and MeHg(I) (0.5 mg L−1 each) under different capillary lengths. The other conditions are the same as Fig. 2. | ||
The migration time and the resolution of Hg(II) and MeHg(I) were affected by separation voltage much more (Fig. 5). With increased separation voltage, the resolution of Hg(II) and MeHg(I) decreased. When separation voltage was increased to 25 kV, Hg(II) and MeHg(I) could not be separated completely. Too low a separation voltage would lead to not only a prolonged migration time but also deterioration of separation efficiency, i.e. broadening of Hg(II) and MeHg(I) electrophoresis peaks. Subsequently, 21 kV was used for subsequent experiments.
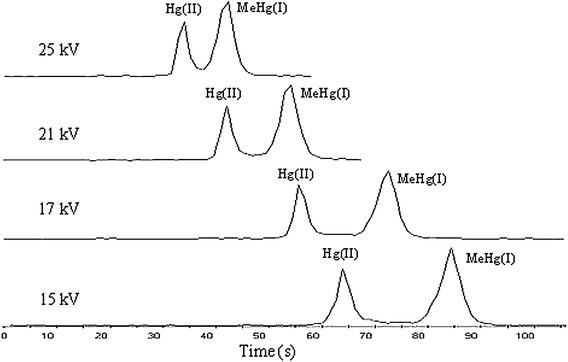 | ||
| Fig. 5 Short-column CE-ICP-MS electropherograms of Hg(II) and MeHg(I) (0.5 mg L−1 each) under different run voltages. The other conditions are the same as Fig. 2. | ||
The effect of concentration of boric acid on the separation was tested in the range of 10–50 mmol L−1 with a pH of 8.60 (see Fig. 6). As the concentration of boric acid was increased, the resolution of MeHg(I) and Hg(II) increased gradually. When boric acid concentration reached 30 mmol L−1, MeHg(I) and Hg(II) were separated completely; on the basis of this, the peak shapes of both MeHg(I) and Hg(II) would broaden with further increase of the boric acid concentration. At the same time, the migration time was prolonged at a higher concentration of boric acid. To obtain a shorter migration time, 30 mmol L−1boric acid was chosen for the experiment.
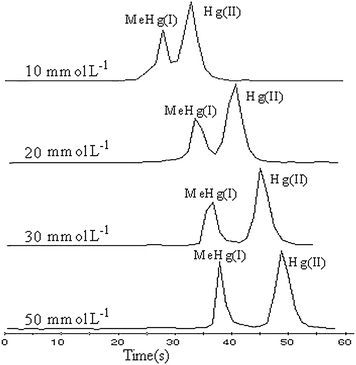 | ||
| Fig. 6 Short-column CE-ICP-MS electropherograms of Hg(II) and MeHg(I) (0.5 mg L−1 each) at different buffer concentrations. The other conditions are the same as Fig. 2. | ||
As one of the most important parameters of CE separation, the buffer pH influences not only the magnitude of EOF, but also the electrophoretic mobility of the analytes. In the experiment, the effect of pH on migration time of MeHg(I) and Hg(II) was examined in the pH range of 8.20–9.60 (Fig. 7). For both MeHg(I) and Hg(II), as the pH of the buffer was increased, the migration time was prolonged. At the same time, the resolution of MeHg(I) and Hg(II) improved gradually, too. When the pH reached 8.60, complete separation was gained for MeHg(I) and Hg(II). The higher pH would lead to longer analysis time. Giving attention to resolution and analysis time, pH 8.60 was chosen for subsequent experiments.
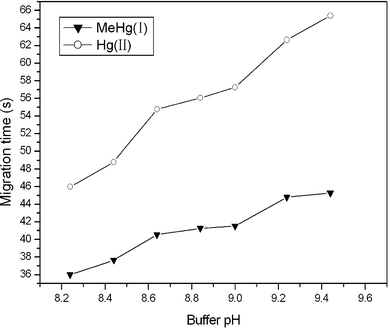 | ||
| Fig. 7 The influence of buffer pH on migration time of Hg(II) and MeHg(I) (0.5 mg L−1 each). The other conditions are the same as Fig. 2. | ||
As the commonly used organic modifier in CE, methanol can be employed to improve the resolution. The effect of the content of methanol in the buffer on the separation was tested in the range from 1% to 20% (v/v) (Fig. 8). It was shown that the signal intensity of both MeHg(I) and Hg(II) decreased with the increase of the content of methanol. At the same time, MeHg(I) and Hg(II) could not be separated completely when the content of methanol was below 5%. Thus, 5% (v/v) methanol content was chosen.
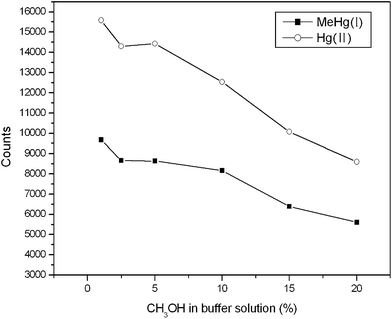 | ||
| Fig. 8 Effect of CH3OH concentration on the intensities of Hg(II) and MeHg(I) (0.5 mg L−1 each). The other conditions are the same as Fig. 2. | ||
Figures of merit
The analytical figures of merit of the present SC-CE-ICP-MS for mercury speciation analysis are summarized in Table 2. The precisions (RSD) of the migration time and peak area for five replicate injections of a mixture of 500 μg L−1 (as Hg) of two mercury species were in the ranges of 1.4–2.6%, 3.3–5.4%, respectively. The detection limits (3σ) of two mercury species were 9.7 μg L−1 and 12.0 μg L−1.| MeHg(I) | Hg(II) | |
|---|---|---|
| Precision (RSD, n = 5) at 500 μg L−1 level (as Hg) (%) | ||
| Migration time | 1.4 | 2.6 |
| Peak area | 3.3 | 3.4 |
| Detection limit (3σ, as Hg)/μg L−1 | 9.7 | 12.0 |
| Linearity/μg L−1 | 50∼5000 | 50∼5000 |
| Calibration function (A, peak area/Counts; C, Conc./μg L−1) | A = 118.2C + 406 | A = 190.5C + 1124 |
| Correlation coefficient | 0.9998 | 0.9991 |
A comparison of the analysis time obtained by several hyphenated techniques for mercury speciation is made in Table 3. It can be seen that, for mercury speciation analysis, the analysis time with the present method are less than the conventional CE or HPLC hyphenation technique. Besides, the analysis time is almost equal to the one gained with Chip-CE.
| Technique | Analytes | Analytical time/s | Ref. |
|---|---|---|---|
| This work | Hg(II), MeHg(I) | Less 60 | |
| CE-VSG-ICP-MS | Hg(II), MeHg(I) | 660 | 12 |
| HPLC-CV-AFS | Hg(II), MeHg(I), PhHg(I) | 1320 | 32 |
| HPLC-ICP-MS | Hg(II), MeHg(I), EtHg(I) | 960 | 33 |
| Chip-CE-AFS | Hg(II), MeHg(I) | 75 | 34 |
Application to river water
The proposed method was also employed for the determination of Hg(II) and MeHg(I) in two local natural river water samples. The analytical results obtained by the present method using a simple standard calibration technique are given in Table 4. The recoveries for Hg(II) and MeHg(I) spiked in the natural water samples studied were calculated to be in the range of 96–107% and 99–105%.| Water samples | Concentration (mean ± σ, n = 5)//μg L−1 | |||
|---|---|---|---|---|
| Proposed method | Nominal | |||
| MeHg(I) | Hg(II) | MeHg(I) | Hg(II) | |
| a Not detectable. | ||||
| Weijin River water | nda | nd | ||
| Xiaoyin River water | nd | nd | ||
| Spiked Weijin River water | 198.6 ± 6.5 | 203.1 ± 5.2 | 200.0 | 200.0 |
| Spiked Xiaoyin River water | 296.0 ± 4.7 | 303.3 ± 3.6 | 300.0 | 300.0 |
Conclusions
The results in the present work have demonstrated the feasibility of the developed SC-CE-ICP-MS hyphenation technique for mercury rapid speciation analysis. Compared with CE-ICP-MS technique, the SC-CE-ICP-MS hyphenation technique provides rapid and high throughput speciation analysis for mercury.Acknowledgements
This work was supported by the Chinese Universities Scientific Fund (09QL53).References
- W. L. Clevenger, B. W. Smith and J. D. Winefordner, Crit. Rev. Anal. Chem., 1997, 27, 1–26 CrossRef CAS.
- J. E. Sánchez Uría and A. Sanz-Medel, Talanta, 1998, 47, 509–524 CrossRef CAS.
- A. H. E. Louis, W. T. Crons, P. B. Stockwell, G. O'Conner, L. Ebdon and E. H. Evans, Anal. Chim. Acta, 1999, 390, 245–253 CrossRef.
- H. Hintelmann, R. D. Evans and J. Y. Villeneuve, J. Anal. At. Spectrom., 1995, 10, 619–624 RSC.
- J. Bettmer, K. Cammann and M. Robecke, J. Chromatogr., A, 1993, 654, 177–182 CrossRef CAS.
- C. F. Harrington, TrAC, Trends Anal. Chem., 2000, 19, 167–179 CrossRef CAS.
- C. C. Wan, C. S. Chen and S. J. Jiang, J. Anal. At. Spectrom., 1997, 12, 683–687 RSC.
- E. Munaf, H. Haraguchi, D. Ishii, T. Tokeuchi and M. Goto, Anal. Chim. Acta, 1990, 235, 399–404 CrossRef CAS.
- C. Sarazanini, G. Sacchero, M. Aceto, O. Abollino and E. Mentasti, Anal. Chim. Acta, 1994, 284, 661–667 CrossRef.
- R. Ritsema and O. F. X. Donard, Appl. Organomet. Chem., 1994, 8, 571–575 CrossRef CAS.
- A. Prange and E. Jantzen, J. Anal. At. Spectrom., 1995, 10, 105–109 RSC.
- J. Costa-Fernandez, F. Lunzer, R. Pereiro-Garcia, A. Sanz-Medel and N. Bordel-Garcia, J. Anal. At. Spectrom., 1995, 10, 1019–1025 RSC.
- B. Y. Deng and W. T. Chan, J. Chromatogr., A, 2000, 891, 139–148 CrossRef CAS.
- E. Debek-Zlotorzynska, E. P. C. Lai and A. R. Timerbaev, Anal. Chim. Acta, 1998, 359, 1–26 CrossRef CAS.
- A. R. Timerbaev, Electrophoresis, 2002, 23, 3884–3906 CrossRef CAS.
- Y. M. Liu and J. K. Cheng, Electrophoresis, 2003, 24, 1993–2012 CrossRef CAS.
- G. Alvarez-Llamas, M. D. de laCampa and A. Sanz-Medel, TrAC, Trends Anal. Chem., 2005, 24, 28–36 CrossRef CAS.
- S. Hardy and P. Jones, J. Chromatogr., A, 1997, 791, 333–338 CrossRef CAS.
- M. S. da Rpcha, A. B. Soldado, E. Blanco-Gonzalez and A. Sanz-Medel, J. Anal. At. Spectrom., 2000, 15, 513–518 RSC.
- A. Gaspar and C. Pager, Chromatographia, 2002, 56, S115–S120 CAS.
- B. G. Sun, M. Macka and P. R. Haddad, Int. J. Environ. Anal. Chem., 2001, 81, 161–205 CAS.
- E. P. C. Lai, W. G. Zhang, X. Trier, A. Georgi, S. Kowalski, S. Kennedy, T. MdMuslim and E. Dabek-Zlotorzynska, Anal. Chim. Acta, 1998, 364, 63–74 CrossRef CAS.
- Y. Li, Y. Jiang and X.-P. Yan, Electrophoresis, 2005, 26, 661–667 CrossRef CAS.
- X.-P. Yan, X. B. Yin, D. Q. Jiang and X. W. He, Anal. Chem., 2003, 75, 1726–1732 CrossRef CAS.
- A. L. Rosen and G. M. Hieftje, Spectrochim. Acta, Part B, 2004, 59, 135–146 CrossRef.
- M. S. da Rpcha, A. B. Soldado, E. Blanco and A. Sanz-Medel, J. Anal. At. Spectrom., 2001, 16, 951–956 RSC.
- T. H. Lee and S. J. Jiang, Anal. Chim. Acta, 2000, 413, 197–205 CrossRef CAS.
- Q. Tu, J. Qvarnström and W. Frech, Analyst, 2000, 125, 705–710 RSC.
- A. Manz, J. C. Fettinger, E. Verpoorte, H. Lűdi, H. M. Widmer and D. J. Harrison, TrAC, Trends Anal. Chem., 1991, 10, 144–149 CrossRef CAS.
- Q. J. Song, G. M. Greenway and T. McCreedy, J. Anal. At. Spectrom., 2003, 18, 1–3 RSC.
- B.-H. Li, Z. H. Wang, L. W. Liu and X.-P. Yan, Spectrosc. Spect. Anal., 2005, 25, 1336–1338 Search PubMed.
- P. Houserová, D. Matějíček, V. Kubáň, J. Pavlíčková and J. Komárek, J. Sep. Sci., 2006, 29, 248–255 CrossRef CAS.
- D. S. Bushee, Analyst, 1988, 113, 1167–1170 RSC.
- F. Li, D. D. Wang, X.-P. Yan, J. M. Lin and R. G. Su, Electrophoresis, 2005, 26, 2261–2268 CrossRef CAS.
| This journal is © The Royal Society of Chemistry 2011 |
