A validated UPLC method for the determination of process-related impurities in Azathioprine bulk drug
Prakash M.
Davadra
*a,
Vivek V.
Mepal
a,
Mukul R.
Jain
a,
Chhelshanker G.
Joshi
b and
Atul H.
Bapodra
b
aZydus Research Centre, Sarkhej-Bavla N. H. No. 8A, Moraiya, Ahmedabad, 382 210, Gujarat, India. E-mail: prakashdavadra@zyduscadila; Tel: +91 2717 250801-5(O), ZRC Communication No.: 311
bChemistry Department, M. D. Science College, Porbandar, 360 575, Gujarat, India
First published on 19th November 2010
Abstract
An UPLC method has been developed and subsequently validated for the determination of Azathioprine and its process-related impurities. Separation was achieved with Acquity UPLC BEH C18, 100 × 2.1 mm, 1.7 μm column and trifluoroacetic acid (0.05% in water)![[thin space (1/6-em)]](https://www.rsc.org/images/entities/char_2009.gif) :
:![[thin space (1/6-em)]](https://www.rsc.org/images/entities/char_2009.gif) acetonitrile as eluent in gradient mode. Flow rate was set at 0.35 mL min−1. UV detection was performed at 220 nm. The method has been validated with respect to specificity, accuracy, precision, linearity, robustness, limit of quantification and limit of detection. The accuracy of the method demonstrated at three levels in the range of 50–150% of the specification limit and the recovery of impurities were found to be in the range of 98 to 102%. The detection limits of the process related impurities ranged between 0.16 and 0.24 μg mL−1. The described method is simple, rapid, linear, precise and robust. The method is useful during process development and quality control of bulk manufacturing.
acetonitrile as eluent in gradient mode. Flow rate was set at 0.35 mL min−1. UV detection was performed at 220 nm. The method has been validated with respect to specificity, accuracy, precision, linearity, robustness, limit of quantification and limit of detection. The accuracy of the method demonstrated at three levels in the range of 50–150% of the specification limit and the recovery of impurities were found to be in the range of 98 to 102%. The detection limits of the process related impurities ranged between 0.16 and 0.24 μg mL−1. The described method is simple, rapid, linear, precise and robust. The method is useful during process development and quality control of bulk manufacturing.
1. Introduction
Azathioprine is a nitroimidazole derivative of 6-mercaptopurine (Table 1). It is an immunosuppressive agent widely used in renal transplant patients. It inhibits the T and B cell proliferation that are involved in kidney rejection mechanism. However, its use is limited due to associated high toxicity.1,2 The Azathioprine is a prodrug of 6-mercaptopurine (6-MP), these thiopurine drugs were introduced in the clinical practice more than 50 years ago.| Name of compound | Structure | Description |
|---|---|---|
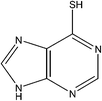
| Impurity-A |
|
IUPAC Name: 9H-Purine-6-thiol |
| Molecular Formula: C5H4N4S | ||
| Molecular Weight: 152.18 g mol−1 | ||
| HPLC Purity: 99.97% | ||
| Impurity-B |

|
IUPAC Name: 5-Chloro-1-methyl-4-nitro-1H-imidazole |
| Molecular Formula: C4H4ClN3O2 | ||
| Molecular Weight: 161.55 g mol−1 | ||
| HPLC Purity: 99.98% | ||
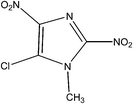
| Impurity-C |
|
IUPAC Name: 5-Chloro-1-methyl-2,4-dinitro-1H-imidazole |
| Molecular Formula: C4H3ClN4O4 | ||
| Molecular Weight: 206.54 g mol−1 | ||
| HPLC Purity: 95.40% | ||
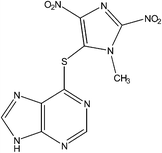
| Impurity-D |
|
IUPAC Name: 6-(3-Methyl-2,5-dinitro-3H-imidazol-4-ylsulfanyl)-9H-purine |
| Molecular Formula: C9H6N8O4S | ||
| Molecular Weight: 322.26 g mol−1 | ||
| HPLC Purity: 99.50% | ||
| Azathioprine |

|
IUPAC Name: 6-(3-Methyl-5-nitro-3H-imidazol-4-ylsulfanyl)-9H-purine |
| Molecular Formula: C9H7N7O2S | ||
| Molecular Weight: 277.26 g mol−1 | ||
| HPLC Purity: 99.91% |
Impurity profiling has now started receiving important critical attention from regulatory authorities. Organic impurities may arise during the manufacturing process and/or on storage of the drug substance. The major source of organic impurities is process related impurities. Starting materials, intermediates, precursors etc. are the most common impurities found in every API unless proper care is taken in every step involved throughout the multi-step synthesis. Sometimes, impurities of intermediates and precursors generate structurally related by-products during synthesis.
Azathioprine was synthesized as per Scheme 1.3 The process impurities related to this route of synthesis are shown in Table 1. During the synthesis of Azathioprine as described in Scheme 1, Impurity-A and Impurity-B may be present as an un-reacted precursor, while Impurity-C [5-chloro-1-methyl-2,4-dinitro-1H-imidazole] was arising by over reaction during synthesis of Impurity-B while Impurity-D was the byproduct of the coupling of Impurity-A and Impurity-C as per this route of synthesis. To the best of out knowledge, there is no toxicological data available for the impurities except Impurity-A.4 Therefore, impurities were monitored and controlled internally, and in-house specification limit of each impurity was fixed at not more than 0.2%.
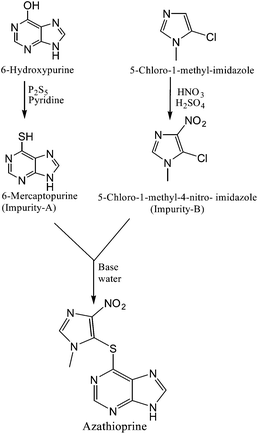 | ||
| Scheme 1 Synthetic scheme of Azathioprine | ||
Numerous HPLC methods have been developed for the determination of 6-MP and its metabolites in biological fluids.5,6,7,8,9,10 In the United State Pharmacopoeia monograph of Azathioprine API, thin layer chromatographic test is described for 6-mercaptopurine.11 Fazio et al. have reported HPLC method for the quantitative determination of Azathioprine residues for cleaning validation in production area.12 To the best of our knowledge there is no UPLC method for the determination of the process related impurities in the Azathioprine API.
In official compendia and in-house standard testing procedure for old drugs, most of the methods are in HPLC. Though HPLC is a well-established reliable technique used in controlling the quality and consistency of active pharmaceutical ingredients and dosage forms, it is often a slow technique because of complexity of some of the samples, it could still be improved. In the recent trend, most of the laboratories are being equipped with fast LC. Ultra performance liquid chromatography (UPLC) is a new category of separation technique based upon well-established principles of liquid chromatograph, which utilize sub-2 μm particles for stationary phase. The UPLC is about nine times faster, two times peak resolution and three times more sensitive than traditional HPLC. To accelerate process development and fast quality control of old drugs, chromatographic methods using advance technology are most welcomed. Therefore, our aim is to develop simple, rapid, precise and accurate chromatographic method for the determination of the process related impurities in Azathioprine bulk drug choosing UPLC directly as a technique instead of HPLC to gain advantage of speed, sensitivity and resolution.
The present work deals with method development, determination of the relative response factor for each impurity and validation of the method. In the method validation, specificity, precision, linearity, accuracy, and limit of quantification and detection have been evaluated for each impurity. The robustness and solution stability of the method were also examined. The developed method is recommended for routine monitoring of process development and quality control analysis.
2. Experimental
2.1 Chemicals
Process Research Department of Zydus Research Centre (Ahmedabad-India) kindly supplied samples of Azathioprine and its process-related impurities (Table 1). HPLC grade acetonitrile and trifluoroacetic acid were purchased from Merck (India). High purity water was obtained by Millipore Milli-Q water purification system. Solvents, mobile phase components and all required solutions were filtered through 0.2 μ syringe filter purchased from Millipore, India.2.2 Equipment
A Waters Acquity UPLC system equipped with binary solvent delivery pump, an auto sampler, a column oven and diode array detector was utilized for method development and validation. The output signal was monitored and processed using Empower software.2.3 Sample preparation
2.4 Chromatographic condition
An Acquity UPLC BEH C18 analytical column (100 mm × 2.1 mm, 1.7 μm) was used for analysis at 30 °C. The mobile phase consisted of 0.05% trifluoroacetic acid in water and acetonitrile in gradient mode and was pumped through the column at a flow rate of 0.35 mL min−1. The gradient program was Time (min)/% B: 0/3, 1/3, 3.5/60, 4/60, 4.1/3, 5/3. The sample injection volume was 1 μL. The wavelength was set at 220 nm for the detection.2.5 Method validation
Repeatability expresses the precision under the same operating conditions over a short interval of time. Repeatability of the method was studied by spiking impurities with Azathioprine at 100% specification level. The precision was examined by analyzing six replicates and the percentage relative standard deviation was calculated for the area and retention time of all the impurities and Azathioprine to demonstrate repeatability.
Reproducibility reveals the precision between laboratories. Reproducibility is normally expressed as the lack of the influence on the test results of operational and environmental variables of the analytical method. In order to demonstrate reproducibility of the method the precision experiment was repeated by using different laboratory, different instrument, and different column on another day. The percentage bias of result was calculated between original condition and changed condition.
2.6 Quantification of process related impurities
The relative response factors for process related impurities were determined from the solution containing Azathioprine and all the process related impurities in known amounts i.e. 5 μg mL−1. The accurate weight percentage of the impurity present in Azathioprine sample was calculated using its RRF value and peak response. The percentage area obtained from the area-normalized method was divided by corresponding RRF value to determine accurate amount of each impurity.3. Results and discussion
3.1 Method development
The present study is aimed at developing an UPLC system capable of eluting and resolving Azathioprine and its synthesis related impurities. Structure of impurities and Azathioprine are shown in Table 1. The selection of wavelength becomes a challenging task to detect all the compounds at single wavelength since the UV profile of all the compounds is different. UV spectra of all the compounds were studied by scanning them between 190 nm to 400 nm (Fig. 1). It can be seen that it is difficult to detect all the compounds at single wavelength with equal response. However, 210 or 220 nm wavelength can be selected as common wavelength for detection. During the experiments, it has been observed that baseline stability, mobile phase interference and noise level were more desirable at 220 nm than the 210 nm. Moreover, the adequate detection and quantification limit were found for all the impurities at 220 nm therefore, 220 nm was finalized as common wavelength for detection. Additionally, relative response factor of all the impurities was evaluated for accurate determination.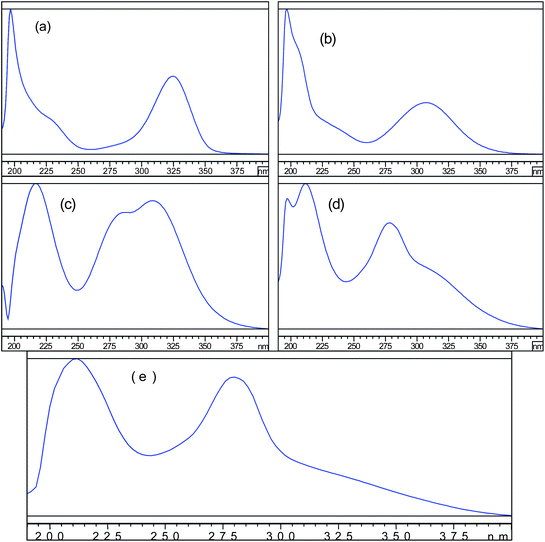 | ||
| Fig. 1 UV spectra in mobile phase of (a) Impurity-A (b) Impurity-B (c) Impurity-C (d) Impurity-D and (e) Azathioprine. | ||
The method development was initiated with water![[thin space (1/6-em)]](https://www.rsc.org/images/entities/char_2009.gif) :
:![[thin space (1/6-em)]](https://www.rsc.org/images/entities/char_2009.gif) acetonitrile or methanol (90
acetonitrile or methanol (90![[thin space (1/6-em)]](https://www.rsc.org/images/entities/char_2009.gif) :
:![[thin space (1/6-em)]](https://www.rsc.org/images/entities/char_2009.gif) 10 v/v) as a mobile phase in isocratic mode using Acuity UPLC BEH C18 (100 × 2.1 mm, 1.7 μm) column at 30 °C. Under this condition results were not satisfactory. Water was replaced by 0.05% trifluoroacetic acid in water, which improved peak shape and all the impurities were well separated. However, one impurity was eluted near dead volume, whereas second impurity was eluted at 8.5 min in acetonitrile and 12.0 min in methanol, which is too long for UPLC method. This much difference in the retention time is indicative of differences in the polarity of the each compound. Therefore, in such cases gradient elution is preferable over isocratic. To obtain efficient gradient elution pattern, small linear gradient was employed for development. Several, permutations and combination of water and 0.05% trifluoroacetic acid in water with acetonitrile and methanol have been scanned to finalize the components of mobile phase. It has been observed that 0.05% trifluoroacetic acid in water (A) and acetonitrile (B) gave better result than any other tested combinations. Subsequently, gradient program was optimized for the desirable separation within short run time. Finally, gradient program Time (min)/% B:0/3, 1/3, 3.5/60, 4/60, 4.1/3, 5/3, with flow rate of 0.35 mL min−1 was found to be optimal. The representative chromatogram is shown in Fig. 2 and resolution and selectivity data are summarized in Table 2. UPLC column HSS T3 C18 (100 × 2.1 mm, 1.8 μm) and different buffers were also tried but the results were not encouraging.
10 v/v) as a mobile phase in isocratic mode using Acuity UPLC BEH C18 (100 × 2.1 mm, 1.7 μm) column at 30 °C. Under this condition results were not satisfactory. Water was replaced by 0.05% trifluoroacetic acid in water, which improved peak shape and all the impurities were well separated. However, one impurity was eluted near dead volume, whereas second impurity was eluted at 8.5 min in acetonitrile and 12.0 min in methanol, which is too long for UPLC method. This much difference in the retention time is indicative of differences in the polarity of the each compound. Therefore, in such cases gradient elution is preferable over isocratic. To obtain efficient gradient elution pattern, small linear gradient was employed for development. Several, permutations and combination of water and 0.05% trifluoroacetic acid in water with acetonitrile and methanol have been scanned to finalize the components of mobile phase. It has been observed that 0.05% trifluoroacetic acid in water (A) and acetonitrile (B) gave better result than any other tested combinations. Subsequently, gradient program was optimized for the desirable separation within short run time. Finally, gradient program Time (min)/% B:0/3, 1/3, 3.5/60, 4/60, 4.1/3, 5/3, with flow rate of 0.35 mL min−1 was found to be optimal. The representative chromatogram is shown in Fig. 2 and resolution and selectivity data are summarized in Table 2. UPLC column HSS T3 C18 (100 × 2.1 mm, 1.8 μm) and different buffers were also tried but the results were not encouraging.
 | ||
| Fig. 2 HPLC chromatogram of finalized condition contains (1) Impurity-A (2) Azathioprine (3) Impurity-B (4) Impurity-D (5) Impurity-C. | ||
| Name | Retention time | Selectivity | Resolution |
|---|---|---|---|
| Impurity-A | 1.374 | — | — |
| API | 2.800 | 2.63 | 19.6 |
| Impurity-B | 2.994 | 1.08 | 4.88 |
| Impurity-D | 3.368 | 1.15 | 8.93 |
| Impurity-C | 3.526 | 1.06 | 3.45 |
3.2 Result of relative response factor
The relative response factor (RRF) of Impurity-A, Impurity-B, Impurity-C, and Impurity-D with respect to Azathioprine were found to be 0.94, 0.47, 0.80 and 0.94 respectively.3.3 Validation results of the method
Azathioprine and its related impurities were well resolved with no interference from the blank and mobile phase. In the precision study, the percentage relative standard deviation (RSD) of six replicates was found less than 0.1% for retention time and 2.0% for peak area of all the impurities and Azathioprine, indicating good repeatability of the method (Table 3).| Compound | Original condition | Different condition | % Bias | Original condition | Different condition | % Bias | ||||
|---|---|---|---|---|---|---|---|---|---|---|
| Average retention time | % RSD (n = 6) | Average retention time | % RSD (n = 6) | Average peak area | % RSD (n = 6) | Average peak area | % RSD (n = 6) | |||
| Impurity-A | 1.36 | 0.13 | 1.36 | 0.10 | 0.0 | 11984.6 | 0.89 | 12024.8 | 0.65 | 0.34 |
| Impurity-B | 3.01 | 0.02 | 3.02 | 0.18 | 0.33 | 3965.6 | 0.20 | 3966.6 | 0.97 | 0.03 |
| Impurity-C | 3.53 | 0.02 | 3.53 | 0.03 | 0.0 | 4954 | 0.95 | 4962 | 0.24 | 0.16 |
| Impurity-D | 3.38 | 0.02 | 3.39 | 0.09 | 0.30 | 11773.0 | 1.76 | 11805.6 | 0.79 | 0.28 |
| API | 2.81 | 0.04 | 2.82 | 0.10 | 0.36 | 5744323.8 | 0.90 | 5707314.2 | 0.19 | −0.64 |
The results of the reproducibility study under a different set of conditions are also in the same order of magnitude. The percentage bias between two different sets of conditions for retention time and peak area was within ±0.36 and ±0.64 respectively for all the impurities (Table 3), indicates that method is rugged for its intended use.
The described method was linear in the range of 0.3 μg mL−1 to 3 μg mL−1 (150% of specification level) of each impurity, which was demonstrated acceptability of the method for the quantitative determination in that range. The value of slope, intercept and correlation coefficient for each impurity are shown in Table 4.
| Parameter | Result | |||
|---|---|---|---|---|
| Impurity-A | Impurity-B | Impurity-C | Impurity-D | |
| Correlation coefficient | 0.999 | 0.998 | 0.999 | 0.999 |
| Y-Intercept | 302.04 | −374.09 | −165.57 | −78.68 |
| Slope | 6667.2 | 3318 | 4803.6 | 5809.1 |
| Residual standard deviation | 327.24 | 245.87 | 251.30 | 297.88 |
| LOD/μg mL−1 | 0.16 | 0.24 | 0.17 | 0.17 |
| LOQ/μg mL−1 | 0.49 | 0.74 | 0.52 | 0.51 |
The LOD and LOQ concentration were estimated for all the impurities and are in the range of 0.16 to 0.24 μg mL−1 and 0.49 to 0.74 μg mL−1 respectively (Table 4).
The method showed excellent recovery at three different studied concentrations, 50, 100 and 150% of specification level for all the impurities (Table 5). The mean recoveries of all the impurities were found to be in the range of 98 to 102%.
| Level (%) | Added/ng mL−1 | Recovered/ng mL−1 | % Recovery |
|---|---|---|---|
| Impurity-A (n = 3) | |||
| 50 | 1000 | 999.5 | 99.95 |
| 100 | 2000 | 1997 | 99.85 |
| 150 | 3000 | 3008.7 | 100.29 |
| Impurity-B (n = 3) | |||
| 50 | 1000 | 984.4 | 98.44 |
| 100 | 2000 | 1976.8 | 98.84 |
| 150 | 3000 | 2973.6 | 99.12 |
| Impurity-C (n = 3) | |||
| 50 | 1000 | 1001.9 | 100.19 |
| 100 | 2000 | 2000.2 | 100.01 |
| 150 | 3000 | 2985.9 | 99.53 |
| Impurity-D (n = 3) | |||
| 50 | 1000 | 1002.1 | 100.21 |
| 100 | 2000 | 1997 | 99.85 |
| 150 | 3000 | 3007.2 | 100.24 |
The chromatographic resolution between closest eluting impurity i.e. Impurity-B and Azathioprine was used to evaluate the method robustness under modified conditions. There was no significant change in resolution under all separation conditions tested (Table 6), demonstrating sufficient robustness.
| Parameter | Resolution between API and Impurity-B (n = 3) |
|---|---|
| Flow rate/mL min−1 | |
| 0.33 | 5.08 |
| 0.35 | 4.85 |
| 0.37 | 4.65 |
| Column T/°C | |
| 28 | 4.94 |
| 30 | 4.85 |
| 32 | 4.76 |
| Concentration of trifluoroacetic acid (%) | |
| 0.04 | 4.83 |
| 0.05 | 4.85 |
| 0.06 | 4.84 |
No significant change in the purity of Azathioprine was observed during solution stability experiments. Thus, Azathioprine test solution was found to be stable for at least 24 h.
3.4 Analysis of bulk drug
To demonstrate applicability of the developed method several different lots of Azathioprine bulk drug have been tested. Sample of Azathioprine was prepared at test concentration i. e. 1.0 mg mL−1 in diluent (0.1% ammonia in methanol) and injected in equilibrated UPLC system after two run of diluent. Area percentage of impurities was obtained by area normalized method and the actual percentage of each known impurity was calculated by dividing area percentage with its corresponding RRF value. The results of five representative lots of Azathioprine bulk drug are presented in Table 7.| Name | Content of impurities in different lots (%) | ||||
|---|---|---|---|---|---|
| AZA001 | AZA002 | AZA003 | AZA004 | AZA005 | |
| a BQL: Below Quantification Level | |||||
| Impurity-A | 0.12 | 0.17 | 0.11 | 0.09 | 0.19 |
| Impurity-B | BQL | 0.05 | BQL | BQL | BQL |
| Impurity-C | 0.04 | 0.07 | BQL | BQL | 0.04 |
| Impurity-D | 0.05 | 0.11 | 0.06 | BQL | 0.07 |
| Unknown impurity | — | 0.04 | — | — | 0.05 |
| Azathioprine | 99.79 | 99.56 | 99.83 | 99.91 | 99.65 |
4. Conclusion
A simple, rapid, suitable, precise and accurate UPLC method has been developed for the determination of the process related impurities in Azathioprine bulk drug. All the impurities were well resolved within 5 min and resolution of the closest eluting peaks was more than 4.8.The developed method was completely validated with respect to specificity, system suitability, linearity, limit of detection and quantitation, accuracy, precision, robustness and solution stability. The result of validation showed satisfactory data for all the parameters tested.
The developed method can be used for the determination of process related impurities (Impurity-A, Impurity-B, Impurity-C and Impurity-D) in Azathioprine in the bulk drug substance.
Acknowledgements
The authors wish to thank the management of Zydus Research Centre for providing us research facility and encouragement.References
- X. M. Muller, Ann. Thorac. Surg., 2004, 77, 354–362 CrossRef.
- T. Dervieux and R. Boulieu, Clin. Chem., 1998, 44, 551–555 CAS.
- G. H. Hitchings, Yonkers, and G. B. Elion, N. Y. Bronxville, US Pat., 3056785, 1962.
- M. Ligumsky, S. Badaan, H. Lewis and D. Meirow, Scand. J. Gastroenterol., 2005, 40, 444–449 CrossRef CAS.
- L. Lennard, J. Chromatogr., B: Biomed. Sci. Appl., 1987, 423, 169–178 CrossRef CAS.
- G. R. Erdmann, L. A. France, B. C. Bostrom and D. M. Canafax, Biomed. Chromatogr., 1990, 4, 47–51 CAS.
- C. W. Keuzenkamp-Jansen, R. A. De Abreu, J. P. Bokkerink and J. M. Trijbels, J. Chromatogr., B: Biomed. Sci. Appl, 1995, 672, 53–61 CrossRef CAS.
- T. Dervieux and R. Boulieu, Clin. Chem., 1998, 44, 551–555 CAS.
- T. Dervieux, G. Meyer, R. Barham, M. Matsutani, M. Barry, R. Boulieu, B. Neri and E. Seidman, Clin. Chem., 2005, 51, 2074–2084 CrossRef CAS.
- A. F. Hawwa, J. S. Millership, P. S. Collier and J. C. McElnay, J. Pharm. Biomed. Anal., 2009, 49, 401–409 CrossRef CAS.
- US Pharmacopoeia, USP 30, 2007, pp. 1471–1472.
- T. T. Fazio, A. K. Singh, E. R. Maria Kedor-Hackmann and M. I. Rocha Santoro, J. Pharm. Biomed. Anal., 2007, 43, 1495–1498 CrossRef CAS.
| This journal is © The Royal Society of Chemistry 2011 |
