Effects of pipette modulation and imaging distances on ion currents measured with Scanning Ion Conductance Microscopy (SICM)†
Chiao-Chen
Chen
and
Lane A.
Baker
*
Department of Chemistry, Indiana University, 800 E. Kirkwood Avenue, Bloomington, Indiana 47405, USA. E-mail: lanbaker@indiana.edu
First published on 23rd November 2010
Abstract
Local conductance variations can be estimated by measuring ion current magnitudes with scanning ion conductance microscopy (SICM). Factors which influence image quality and quantitation of ion currents measured with SICM have been evaluated. Specifically, effects of probe-sample separation and pipette modulation have been systematically studied for the case of imaging conductance variations at pores in a polymer membrane under transmembrane concentration gradients. The influence of probe-sample separation on ion current images was evaluated using distance-modulated (ac) feedback. Approach curves obtained using non-modulated (dc) feedback were also recorded to determine the relative influence of pipette-generated convection by comparison of ion currents measured with both ac and dc feedback modes. To better interpret results obtained, comparison to a model based on a disk-shaped geometry for nanopores in the membrane, as well as relevant position-dependent parameters of the experiment is described. These results advance our current understanding of conductance measurements with SICM.
Introduction
Scanning ion conductance microscopy (SICM) is a scanning probe microscopy (SPM) technique which is well-suited to topographic1–3 and chemical mapping4–8 of biological and physical interfaces. In SICM, a potential difference applied between an electrode inside an electrolyte-filled nanopipette and a second electrode outside the nanopipette results in a steady-state ion current. This ion current flowing through the pipette is strongly influenced by the relative position between the SICM probe and a sample of interest,9 providing a feedback signal to precisely control the position of the pipette.10 Position-dependent changes in system conductance enable SICM to measure both nanoscale features and physical properties of the sample under study.As the probe is rastered over a surface, the ion-current feedback of SICM allows non-contact imaging, which has proven highly beneficial for studies of fragile, adhesive or responsive surfaces. In particular, SICM has proven adept for nanoscale imaging of convoluted biological surface structures, for instance, neural networks and stereocilla of inner hair cells.11 Recently, SICM has been applied to investigate numerous biophysical systems including changes in plasma membrane morphology associated with endocytosis and exocytosis,12–14 dynamics of cellular surface assembly in living cells,15–17 localized conductance imaging of porous membranes,18 and suspended artificial membranes.19
Several models have been proposed to systemically investigate factors that affect image quality and resolution of SICM. Nitz et al. introduced a mathematical model which describes the relationship between probe-sample distances and ion currents when a pipette approaches a planar surface.20 Adenle and Fitzgerald proposed numerical methods to simulate imaging with SICM under different operating modes based on a steady-state model which describes the distribution of ion current density at the pipette opening.21 Rheinlaender and Schäffer investigated the image formation process and resolution in SICM with finite element modeling (FEM).22 Edward et al. also performed 2D and 3D simulations with FEM to study the effects of pipette geometry and substrate topography on the current response in SICM.23 All of the aforementioned models contribute to clarification of imaging mechanisms in SICM; however, most of these studies are based on simulation and lack significant complementary experimental data to support the validity of proposed models.
Herein, we examine, through experiments and models, normalized ion current profiles as well as effects of probe-sample separation and probe-induced convection on measured ion currents which reflect changes in local conductance. These studies further develop the ability to quantify the measurements of conductance at the nanometer scale with SICM.
Results/Discussion
A model with an ion source of disk-shaped geometry
We employ a geometric model for describing normalized ion currents.24,25 To minimize factors which might contribute to deviations not accounted for in the model, namely surface-charge and permselectivity of nanopores, pores of large diameters (>250 nm) and KCl solutions with higher concentrations (≥0.1 M) have been utilized, as effects of surface conductivity and permselectivity in nanoscale dimensions become significant and cannot be ignored when the pore dimension is small (e.g. ≤ 100 nm in diameter) or the electrolyte used has low ionic strength (e.g. ≤ 0.1 M KCl).26 Additionally, a disk-shaped source which more accurately represents the true pore geometry (as opposed to a hemispherical ion source described previously) was utilized in the model. For a disk-shaped source (Fig. 1b), a local ion concentration can be described by eqn (1)24 where Cs represents the concentration of electrolyte at the pore opening and C(r) is the concentration at a radial displacement of r from a pore opening of radius a, with a vertical displacement equal to d and a lateral displacement equal to x. With eqn (1),24 concentrations of ions which determine the magnitude of local conductance of a non-uniform electrolyte measured by the SICM probe at lateral distance, x, and probe-sample separation, d, from a disk-shaped ion source of radius, a, can be calculated. However, for experiments described here, a transmembrane concentration gradient is present (upper chamber with 0.1 M KCl; bottom chamber with KCl ranging from 0.1 M to 4.0 M) and thus Cs is determined by the gradient formed from solutions of different electrolyte concentrations on each side of the membrane. We estimate Cs under different concentration gradients applied in this study using finite element methods (FEM) modeling (see supporting information). In addition, eqn (1)24 requires additional modification to incorporate the contribution of electrolyte concentration in the upper chamber as described in eqn (3) where CUbulk represents the bulk electrolyte concentration in the upper chamber, which is maintained at 0.1 M in this study. | (1) |
 | (2) |
C![[hair space]](https://www.rsc.org/images/entities/char_200a.gif) ′(r) = α·(Cs − CUbulk) + CUbulk ′(r) = α·(Cs − CUbulk) + CUbulk | (3) |
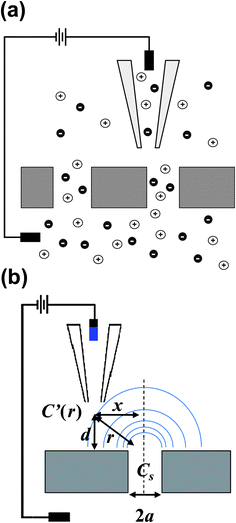 | ||
Fig. 1 (a) Experimental setup for measurements described. A nanoporous membrane separates two chambers (upper and lower) of a diffusion cell with unequal ion concentrations. Local conductance variations established by ions emanating from pores in the membrane are measured viascanning ion conductance microscopy (SICM). (b) Schematic diagram of a SICM probe over a nanopore at a radial displacement of r away from the pore center, with a vertical displacement equal to d and a lateral displacement equal to x. Cs represents the concentration of electrolyte at the pore opening of radius a and C![[thin space (1/6-em)]](https://www.rsc.org/images/entities/i_char_2009.gif) ′(r) represents the position dependent concentration at the radial displacement of r where the SICM probe is located. ′(r) represents the position dependent concentration at the radial displacement of r where the SICM probe is located. | ||
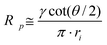
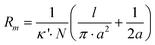
The magnitude of ion currents recorded with SICM is determined by the total resistance between the electrode inside the scanning pipette and the electrode placed on the opposite side of the porous membrane. The total resistance (RT) of our experimental setup is a combination of the pipette resistance (Rp), the access resistance (RAC) and the membrane resistance (Rm). Pipette resistance (Rp) determined by the geometry of a pipette can be described by eqn (4)27 in which γ is the specific resistance of the electrolyte filled in the pipette, θ is the cone angle of the pipette tip and ri is the radius of the pipette tip opening. Typical nanopipettes used in this study usually have an inner radius of about 60 nm with an cone angle of about 9.5° and thus give a pipette resistance of about 100 MΩ when filled with 0.1 M KCl (measured specific resistance, γ, 80.13 Ω·cm). The mathematical description of access resistance (RAC) is reported in eqn (5)20,23,28,29 which is determined by the outer radius, ro, and the inner radius, ri, of the pipette opening, the probe-sample separation, d, and the electrolyte conductivity, κ, within the probe-sample separation. The resistance of the membrane with N cylindrical pores in parallel is described with eqn (6)30 where l is the pore length (membrane thickness), κ′ is the electrolyte conductivity within the pore, a is the pore radius and N is the number of pores on the porous membrane. For the porous membranes used in this study with large N value calculated from the pore density of 106pore/cm2 and the exposed membrane area of ∼0.79 mm2, the membrane resistance (Rm) is negligible compared to the pipette resistance (Rp) and the access resistance (RAC). Therefore, the total resistance (RT) of our experimental setup is mainly determined by the pipette resistance (Rp) and the access resistance (RAC) as shown in eqn (7). When a nanopipette scans at a constant probe-sample separation over a pore on the membrane which separates two chambers (upper and lower) of a diffusion cell with unequal ion concentrations, Rp remains constant for a given pipette (∼100 MΩ for nanopipettes used in this study) but RAC is a function of the local conductivity determined by the ion concentration established by ion flux emanating from the pore, a disk-shape source, described with eqn (3). The magnitude of ion currents measured with SICM, which reflect the local conductance of a non-uniform electrolyte, can be estimated by dividing the applied potential (U) with the total system resistance (RT) as shown in eqn (8). However, since the ion current images recorded with SICM represent relative ion current changes within the mapping area instead of an absolute ion current magnitude, current values shown on the current images should be described with eqn (9). With eqn (9), by inserting experimental conditions used, ion current profiles recorded with SICM which reflect local conductance variation resulting from non-uniform electrolyte concentration around a pore can be estimated.
 | (4) |
 | (5) |
 | (6) |
| RT = Rp + RAC + Rm ≈ Rp + RAC ≈ 108Ω + f(C′(r)) | (7) |
 | (8) |
 | (9) |
Validation of the disk-shaped source model and the effects of probe-sample separation
A model described by eqn (9) was utilized to estimate ion current profiles over a pore measured with a nanopipette. Fig. 2 represents calculated ion current profiles when various transmembrane concentration gradients, pore sizes and probe-sample separations are examined. The Y axis of each diagram in Fig. 2 represents the ion current normalized to the peak current calculated for the transmembrane concentration gradient of 0.1–4.0 M. A probe-sample separation of 300 nm, typically used for glass pipettes in this study, is selected for the model to calculate ion current profiles over pores with two different diameters under various transmembrane concentration gradients, as shown in Fig. 2a and 2b. From these figures, the peak value of an ion current profile is observed to be proportional to the transmembrane concentration difference. Additionally, when a probe-sample separation of 300 nm is utilized, for the same transmembrane concentration gradient, ion current profiles for pores of a larger diameter (930 nm) show a wider full width of half maximum (FWHM), but retain a Lorentzian shape, as is observed for pores of a smaller diameter (273 nm).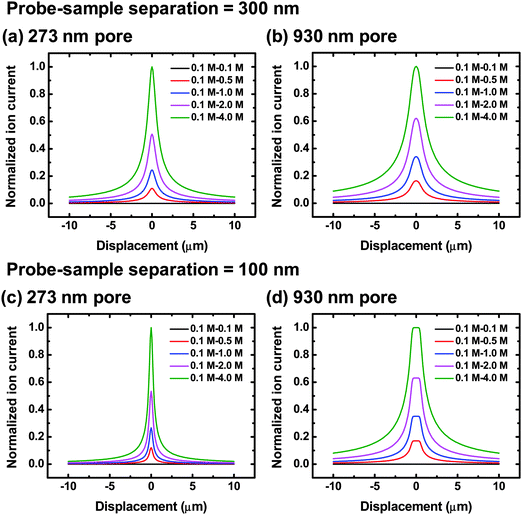 | ||
| Fig. 2 Ion current profiles calculated from the disk-shaped source model under various transmembrane concentration differences at a probe-sample separation equal to 300 nm (a and b) and 100 nm (c and d) for pores with 273 nm (a and c) and 930 nm (b and d) in diameter. To facilitate comparison, calculated ion currents in each diagram are normalized to the peak current calculated for the transmembrane concentration difference of 0.1 M (upper chamber) – 4.0 M (lower chamber). | ||
The model predicts that when a smaller probe-sample separation of 100 nm is used, differences in the ion current profiles over pores with different diameters become more pronounced (Fig. 2c and 2d). The widths of current profiles for the 273 nm diameter pore are much narrower than those for the 930 nm diameter pore and there is a plateau region shown on the current profiles obtained from the pore with a larger diameter (930 nm). In previous studies, which incorporate a hemispherical ion source, current profiles with plateau characteristics were not observed, implying that a disk-shaped source can more accurately describe concentration profiles established over a nanopore.
To experimentally validate the trend observed, ion current profiles measured with different sized nanopipettes operating at different probe-sample separations were recorded. Optimal probe-sample separation for SICM imaging relies on the size of the probe; a finer probe provides a closer working distance and thus allows imaging with a smaller probe-sample separation.31 Based on experimental results, typical glass pipettes employed provide an optimal probe-sample separation of ∼300 nm. To perform a scan closer to the membrane surface, quartz pipettes with an inner diameter of ∼30 nm, which provide a probe-sample separation of ∼100 nm (see supporting information, Figure S1), were utilized. Fig. 3 shows the experimental (Fig. 3a) and calculated (Fig. 3b) two-dimensional ion current profiles over pores with four different diameters (273, 535, 766 and 930 nm) under a transmembrane concentration difference of 0.1 M (upper chamber) – 2.0 M (lower chamber) when a probe-sample separation of ∼100 nm was used. To illustrate the plateau characteristics of these current profiles more clearly, all of the experimental and calculated ion currents have been normalized to the peak current of each profile. Insets of Fig. 3a and 3b show the peak regions of ion current profiles, which possess plateau characteristics when the pipette scans directly over the pore center, further demonstrating that the disk-shaped source model can describe the characteristics of current profiles over a nanopore accurately.
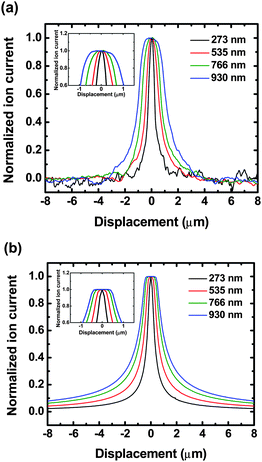 | ||
| Fig. 3 (a) Experimental ion current profiles obtained with SICM and (b) theoretical ion current profiles calculated from the disk-shaped source model at a probe-sample separation of 100 nm for pores with four different diameters at a transmembrane concentration difference equal to 0.1 M (upper chamber) – 2.0 M (lower chamber). Insets of Figure 3a and 3b show the plateau region of these ion current profiles. Ion currents calculated or measured for pores with different diameters were normalized for illustration. | ||
Fig. 4 displays two- and three-dimensional ion current images measured at different probe-sample separations, d, with SICM operated under ac feedback mode. The transmembrane concentration difference of 0.1 M (upper chamber) – 4.0 M (lower chamber) is used to obtain images shown in Fig. 4. These current images demonstrate the magnitude of ion currents measured increases when imaging with a smaller probe-sample separation. For probe-sample separations from ∼300 nm to ∼500 nm, a linear relationship is obtained from plotting the peak value of the ion current image as a function of the probe-sample separation at a transmembrane concentration difference of 0.1 M (upper chamber) – 4.0 M (lower chamber), as shown in Fig. 5a,  . Effects of the probe-sample separation on ion currents measured with ac feedback-controlled scans under transmembrane concentration gradients of 0.1 M (upper chamber) – 2.0 M (lower chamber) (Fig. 5a,
  ) and 0.1 M (upper chamber) – 1.0 M (lower chamber) (Fig. 5a,
  ) were examined as well, and also demonstrated linear relationships.
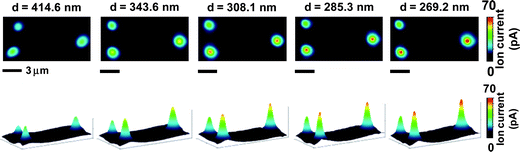 | ||
| Fig. 4 Two- and three-dimensional ion current images measured with SICM operated under ac feedback at different probe-sample separations, d, with a transmembrane concentration difference of 0.1 M (upper chamber) – 4.0 M (lower chamber). | ||
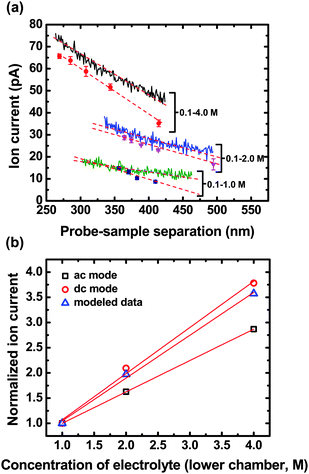 | ||
Fig. 5 (a) Dependence of the ion current on the probe-sample separation measured with SICM under ac feedback (shown as discontinuous points, i.e., , ) and dc feedback (shown as continuous lines, i.e. ) at three different transmembrane concentration gradients. (b) Normalized modeled ( ) at three different transmembrane concentration gradients. (b) Normalized modeled ( ) and experimental ( ) and experimental ( and □) ion currents obtained at the probe-sample separation of 300 nm are plotted as a function of the KCl concentration in the lower chamber. Ion currents of each series are normalized to the current values calculated for the smallest KCl transmembrane concentration difference used here (i.e. 0.1 M (upper chamber) – 1.0 M (lower chamber)). and □) ion currents obtained at the probe-sample separation of 300 nm are plotted as a function of the KCl concentration in the lower chamber. Ion currents of each series are normalized to the current values calculated for the smallest KCl transmembrane concentration difference used here (i.e. 0.1 M (upper chamber) – 1.0 M (lower chamber)). | ||
Additionally, widths of measured ion current profiles are affected by the probe-sample separation, as shown in Fig. 6. Here, a transmembrane concentration difference of 0.1 M (upper chamber) – 4.0 M (lower chamber) is utilized and the resulting current profile becomes narrower and sharper with a greater peak value at a smaller probe-sample separation (Fig. 6a). In Fig. 6b, the full width of half maximum (FWHM) of the current profile is directly related to the probe-sample separation, demonstrating that scanning with smaller probe-sample separations allows collection of well-resolved images; a similar tendency was also predicted in topographic images.22
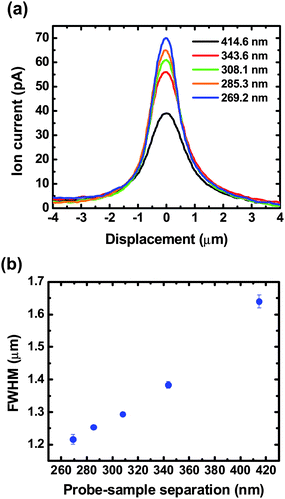 | ||
| Fig. 6 (a) Ion current profiles measured with SICM operated under ac feedback at different probe-sample separations, d, with a transmembrane concentration difference of 0.1 M (upper chamber) – 4.0 M (lower chamber). (b) The FWHM of ion current profiles represents a direct relationship with the probe-sample separation. | ||
Effects of probe-induced convection on ion current measurements
Convective effects introduced by modulation of the probe represent a possible source of deviation in the experiments described. To study the effect of probe convection on ion current measurements, ion currents measured with SICM operated under distance-modulated (ac) feedback mode (with pipette convection) and non-modulated (dc) feedback mode (without pipette convection) at different probe-sample separations were examined. Permeable membranes with pores of 535 nm in diameter were selected for these studies. Previous reports have detailed the advantages of ac feedback with respect to dc feedback.32 For SICM operated under dc feedback, a dc ion current is employed as the feedback signal to maintain a constant probe-sample separation during imaging. However, the magnitude of the dc ion current is susceptible to changes in conductivity of the bath electrolyte and thus cannot provide adequate feedback control when the probe scans over regions with significant changes in solution conductivity. This is especially important in measurements made here; when heterogeneous regions of conductivity are encountered as the pipette scans over a pore, dc feedback does not maintain adequate control of the pipette position.Approach curves using dc feedback (current-distance characteristics of the SICM operated with dc feedback) were recorded to determine the relationship between probe-sample separations and ion currents measured in the absence of convection. Fig. 7 shows typical dc approach curves obtained at a position located far from the pore center (Fig. 7a) and at a position located over the pore center (Fig. 7b). Insets in Fig. 7a and 7b illustrate the relative lateral position of a SICM probe to a nanopore in the membrane. By comparing Fig. 7a and 7b, a distinct difference between the two approach curves is observed. The dc approach curve obtained away from the pore center (Fig. 7a) represents a typical current-distance characteristic for a nanopipette over an insulating surface. The magnitude of ion currents remains virtually constant when the pipette is far away from the membrane surface but decreases rapidly when the probe-sample separation is smaller than ∼300 nm, the typical vertical distance used for glass pipettes to perform ac imaging in this study. In comparison, when a dc approach curve is recorded with the nanopipette positioned over a pore center (Fig. 7b), an increase in the ion current magnitude is recorded as the nanopipette approaches the membrane. This effect is observed due to variations in conductivity of the solution around the local position of the nanopipette. The highest current magnitude measured when the nanopipette probe is located at the center of the pore, where the solution conductivity is greatest.
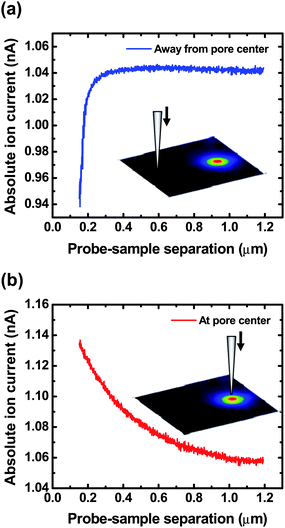 | ||
| Fig. 7 Approach curves (dc feedback) obtained (a) away from the pore center and (b) over the pore center with a transmembrane concentration difference of 0.1 M (upper chamber) – 4.0 M (lower chamber). Insets illustrate the relative lateral position of a SICM probe to a nanopore in the membrane. | ||
With dc approach curves, absolute ion currents at a specific position of the membrane surface can be measured. To obtain the current magnitudes that reflect the local conductance variations of a non-uniform electrolyte around a nanopore under a transmembrane concentration gradient, localized changes of ion currents around a nanopore (relative ion currents) instead of the absolute dc ion currents must be determined. A series of dc approach curves that traverse the center of a nanopore with probe-sample separations between ∼300 nm and ∼500 nm were recorded (see the supporting information, Figure S2) to obtain the ion current profiles at different probe-sample separations. The dependence of ion currents measured without convection was determined by plotting peak heights of these ion current profiles in relation to probe-sample separations.
For a range of probe-sample separation (e.g. ∼300 to ∼500 nm), ion currents measured with either ac or dc feedback demonstrated a linear relationship to the probe-sample separation, as illustrated in Fig. 5a. By fitting data taken at different transmembrane concentration gradients shown in Fig. 5a, the magnitude of ion currents measured with different feedback modes (ac and dc) at a specific probe-sample separation (300 nm was selected here which is a typical imaging distance used in this study) and under different transmembrane concentration gradients can be determined. In addition, ion currents can also be estimated using the model described with eqn (9) under different transmembrane concentration gradients. However, ion current values predicted by the model are not directly comparable to and are about 10 times smaller than the experimental measurements here. This discrepancy could arise from several possible sources. First, when the nanopipette scans over a pore, to follow the surface closely, the scanning pipette is displaced to reflect the changes of the membrane topography and thus the tip position deviates from the level line of probe-sample separation of 300 nm selected for calculation. Over a membrane pore, as the nanopipette moves down to follow membrane topography, the solution conductivity around the tip increases due to the non-uniform electrolyte concentration around the pore established by the transmembrane concentration gradient. Consequently, this suggests that the model described with eqn (9) might underestimate the electrolyte concentration around the nanopipette when it scans over a pore, resulting in underrating of calculated values.
Second, calculated data was obtained by using electrolyte concentrations determined at a probe-sample separation of 300 nm. However, the concentration at a probe-sample separation from 0 nm to 300 nm is not constant but increases with a smaller probe-sample separation. Thus using a constant electrolyte concentration at a probe-sample separation of 300 nm to perform the calculation possibly oversimplifies conditions described here. With these factors in mind, normalized experimental and calculated ion currents obtained at a common concentration gradient are compared in the following discussion.
To facilitate comparison, ion currents calculated from linear regression of experimental currents (Fig. 5a) at 300 nm, a typical imaging distance, and those calculated from the model, also at a probe-sample separation of 300 nm, were normalized. Ion currents normalized to the smallest transmembrane concentration difference used here (0.1–1.0 M) are plotted as a function of the electrolyte concentration in the lower chamber (Fig. 5b) to examine the consistency between experimental and modeled data. In Fig. 5b, the dependence of normalized ion currents on the electrolyte concentration measured under dc feedback (without pipette convection, Fig. 5b, ) shows a similar slope to that obtained from the disk-shaped source model (Fig. 5b, ). This is in contrast to normalized ion currents measured with ac feedback (with pipette convection, Fig. 5b, □), which represents obvious deviation from modeled data. This result suggests that convection induced by the vertical modulation of the nanopipette (±30 nm vertical displacement) contributes to discrepancies between normalized experimental and modeled data.
In addition, a concentration gradient of ions is established at a nanopore. A high concentration is present at the surface of the membrane which decays to bulk concentration away from the membrane surface. This is especially true in the vicinity of the nanopore. For larger transmembrane concentration differences (e.g. 0.1 M– 4.0 M KCl), the concentration gradient developed is greater, in comparison to smaller transmembrane concentration differences (e.g. 0.1 M–1.0 M KCl). This is significant when considering convection induced by vertical modulation of the nanopipette. Modulation (constant vertical oscillation, ±30 nm in this report) produces larger perturbations of local ion concentrations for the case of larger transmembrane concentration gradients because the convection effectively mixes two solutions with a greater difference in concentration. Thus, trends observed under ac feedback mode display greater deviation from the model at higher concentration differences. This phenomenon could account for the result shown in Fig. 5b, where a greater deviation in ac feedback measurements is observed at greater transmembrane concentration differences. On the basis of the aforementioned discussions, good agreement between modeled and experimental data is demonstrated for trends in normalized ion currents measured with dc feedback on the electrolyte concentration in the lower chamber.
Conclusion
A model which affords the capability to provide additional information related to ion currents measured with SICM in regions of non-uniform electrolyte conductance around a nanopore in a porous membrane was employed in this study. This is accomplished by adopting a disk-shaped source of ions to describe the nanopore in the permeable membrane instead of a hemispherical source. With this disk-shaped source model, a plateau region on the ion current profiles obtained by SICM with closer scanning (probe-sample separation ≤ 100 nm) can be accurately described.In addition, ion current images obtained with SICM operated with ac feedback under different probe-sample separations were examined. The relationship between the FWHM of the ion current profiles to the probe-sample separation implies that a smaller imaging distance is required for well-resolved ion current images.
Current measurements of local conductance as described here with SICM operated under ac and dc feedback were performed to study the effect of probe convection on recorded current values. Limited by drawbacks of SICM operated under dc feedback, dc approach curves instead of dc feedback-controlled scans are recorded to estimate the magnitude of ion currents without pipette convection. By comparing the dependence of ion currents measured under ac and dc feedback on the electrolyte concentration in the lower chamber with that of the calculated ion currents predicted from the model, it was realized that pipette-generated convection results in discrepancy between the normalized model and the normalized experimental data. However, the trend of the dependence for normalized ion currents measured with dc feedback is consistent with that calculated from the model. This result demonstrates that the model employed in this study can accurately predict the relationship of normalized ion currents measured with SICM to the transmembrane concentration difference if an appropriate experimental operation (dc feedback) is selected for measurements. In contrast to SICM operated with dc feedback which provides more qualitative results, SICM operated with ac feedback provides superior feedback regulation, and proves beneficial in mapping regions with variations in conductance.
Experimental
Chemicals
All solutions were prepared with deionized water (resistivity = 18 MΩ-cm) obtained from a Milli-Q water purification system (Millipore Corp., Danvers, MA). Potassium iodide (Mallinckrodt, Philipsburg, NJ) and sodium hypochlorite (13% active chlorine, Acros, Morris Plains, NJ) were utilized to prepare nanoporous membranes as described previously.33Potassium chloride (Mallinckrodt, Philipsburg, NJ) solutions with concentrations ranging from 0.1 M to 4.0 M were filtered with 0.22 µm PVDF filter membrane (Millipore Corp., Danvers, MA) and utilized as electrolytes for SICM measurements.Membrane preparation
Nanoporous membranes used in this report were prepared from ion-tracked polyimide membranes (track density 106 tracks/cm2, thickness 25 µm, it4ip, Belgium) via the track-etched process.33 With this process, polyimide membranes with pores of 272 ± 9, 535 ± 40, 766 ± 33 and 930 ± 127 nm in diameter were obtained. Exact pore sizes were characterized with scanning electron microscopy (SEM, FEI Quanta-FEG). Details of membrane preparation and pore characterization have been described elsewhere.18Instrumentation
Measurements of local conductance variations with a ScanIC scanning ion conductance microscopy (ionscope, London, UK) operated under distance-modulated mode (ac feedback) has been previously described.18 The experimental setup is illustrated in Fig. 1a. Measurements of ion currents through nanoporous membranes were determined with a dc feedback mode (without pipette convection) and with an ac feedback mode (with pipette convection).Nanoporous membranes prepared were masked in clear tape with a 1-mm-diameter hole to expose the porous membrane to electrolyte solutions on both sides. To generate a non-uniform electrolyte system around pores of the membrane, a masked membrane was mounted in a diffusion cell (Fig. 1a). KCl concentrations in the lower chamber were varied from 0.1 M to 4.0 M, while the KCl concentration in the nanopipette and upper chamber was held constant at 0.1 M. Nanopipettes with two different sizes were utilized in this study and characterized by electron microscopy (Quanta FEG SEM) (see the Supporting Information, Figure S1). Glass pipettes fabricated from borosilicate capillaries (inner diameter 0.58 mm, outer diameter 1.0 mm, World Precision Instrument, Sarasota, FL) with a CO2-laser-based pipette puller (P-2000, Sutter Instrument, Novato, CA) provide tip openings with an inner diameter of ∼60 nm and an outer diameter of ∼250 nm. Finer pipettes with an inner diameter of ∼30 nm and an outer diameter of ∼100 nm were fabricated from quartz capillaries (inner diameter 0.7 mm, outer diameter 1.0 mm, Sutter Instrument, Novato, CA).
A potential difference of 100 mV was applied between the Ag/AgCl electrode inserted into nanopipette and the second Ag/AgCl electrode placed in the lower chamber of the diffusion cell. The ion current through the nanopipette and across the nanoporous membrane was then measured. The nanopipette probe mounted on the SICM scanner was modulated ∼60 nm (peak-to-peak) at 800 Hz in the vertical direction and thus produced a distance-modulated ion current which was amplified and used as the feedback signal to control the system. After approach to the sample surface, the nanopipette was raster scanned over the surface of the sample at a constant probe-sample separation in the x and y dimensions. The lateral and vertical positions of the nanopipette and the magnitude of dc ion currents were recorded, producing both topographic and dc current images, respectively. SICM images were analyzed with SICM Image Viewer (ionscope, London, UK) and Gwyddion.34
Acknowledgements
Research was supported by the American Heart Association, the National Institutes of Health, the Research Corporation (Cottrell Scholar's Award to L.A.B.) and Indiana University.References
- J. M. Kim, T. Ohtani, S. Sugiyama, T. Hirose and H. Muramatsu, Anal. Chem., 2001, 73, 5984–5991 CrossRef CAS.
- H. J. Dai, J. H. Hafner, A. G. Rinzler, D. T. Colbert and R. E. Smalley, Nature, 1996, 384, 147–150 CrossRef CAS.
- T. A. Camesano, M. J. Natan and B. E. Logan, Langmuir, 2000, 16, 4563–4572 CrossRef CAS.
- X. Chen, M. C. Davies, C. J. Roberts, S. J. B. Tendler, P. M. Williams, J. Davies, A. C. Dawkes and J. C. Edwards, Langmuir, 1997, 13, 4106–4111 CrossRef CAS.
- A. Ebner, F. Kienberger, G. Kada, C. M. Stroh, M. Geretschlager, A. S. M. Kamruzzahan, L. Wildling, W. T. Johnson, B. Ashcroft, J. Nelson, S. M. Lindsay, H. J. Gruber and P. Hinterdorfer, ChemPhysChem, 2005, 6, 897–900 CrossRef CAS.
- D. Kossakovski and J. L. Beauchamp, Anal. Chem., 2000, 72, 4731–4737 CrossRef CAS.
- E. Oesterschulze, M. Stopka, L. Ackermann, W. Scholz and S. Werner, J. Vac. Sci. Technol., B, 1996, 14, 832–837 CrossRef CAS.
- F. Meier, L. H. Zhou, J. Wiebe and R. Wiesendanger, Science, 2008, 320, 82–86 CrossRef CAS.
- Y. E. Korchev, C. L. Bashford, M. Milovanovic, I. Vodyanoy and M. J. Lab, Biophys. J., 1997, 73, 653–658 CrossRef CAS.
- P. K. Hansma, B. Drake, O. Marti, S. A. C. Gould and C. B. Prater, Science, 1989, 243, 641–643 CrossRef CAS.
- P. Novak, C. Li, A. I. Shevchuk, R. Stepanyan, M. Caldwell, S. Hughes, T. G. Smart, J. Gorelik, V. P. Ostanin, M. J. Lab, G. W. J. Moss, G. I. Frolenkov, D. Klenerman and Y. E. Korchev, Nat. Methods, 2009, 6, 279–281 CrossRef.
- A. I. Shevchuk, P. Hobson, M. J. Lab, D. Klenerman, N. Krauzewicz and Y. E. Korchev, Biophys. J., 2008, 94, 4089–4094 CrossRef CAS.
- A. I. Shevchuk, P. Hobson, M. J. Lab, D. Klenerman, N. Krauzewicz and Y. E. Korchev, Pfluegers Arch., 2008, 456, 227–235 CrossRef CAS.
- W. Shin and K. D. Gillis, Biophys. J., 2006, 91, L63–L65 CrossRef CAS.
- J. Gorelik, A. I. Shevchuk, G. I. Frolenkov, I. A. Diakonov, M. J. Lab, C. J. Kros, G. P. Richardson, I. Vodyanoy, C. R. W. Edwards, D. Klenerman and Y. E. Korchev, Proc. Natl. Acad. Sci. U. S. A., 2003, 100, 5819–5822 CrossRef CAS.
- Y. J. Zhang, J. Gorelik, D. Sanchez, A. Shevchuk, M. Lab, I. Vodyanoy, D. Klenerman, C. Edwards and Y. Korchev, Kidney Int., 2005, 68, 1071–1077 CrossRef CAS.
- J. Gorelik, Y. J. Zhang, A. I. Shevchuk, G. I. Frolenkov, D. Sanchez, M. J. Lab, I. Vodyanoy, C. R. W. Edwards, D. Klenerman and Y. E. Korchev, Mol. Cell. Endocrinol., 2004, 217, 101–108 CrossRef CAS.
- C. C. Chen, M. A. Derylo and L. A. Baker, Anal. Chem., 2009, 81, 4742–4751 CrossRef CAS.
- M. Bocker, S. Muschter, E. K. Schmitt, C. Steinem and T. E. Schaffer, Langmuir, 2009, 25, 3022–3028 CrossRef.
- H. Nitz, J. Kamp and H. Fuchs, Probe Microsc., 1998, 1, 187–200 Search PubMed.
- O. A. Adenle and W. J. Fitzgerald, Scanning, 2006, 28, 79–80.
- J. Rheinlaender and T. E. Schaffer, J. Appl. Phys., 2009, 105, 094905 CrossRef.
- M. A. Edwards, C. G. Williams, A. L. Whitworth and P. R. Unwin, Anal. Chem., 2009, 81, 4482–4492 CrossRef CAS.
- E. R. Scott, H. S. White and J. B. Phipps, Anal. Chem., 1993, 65, 1537–1545 CrossRef CAS.
- J. D. Piper, R. W. Clarke, Y. E. Korchev, L. M. Ying and D. Klenerman, J. Am. Chem. Soc., 2006, 128, 16462–16463 CrossRef CAS.
- D. Stein, M. Kruithof and C. Dekker, Phys. Rev. Lett., 2004, 93, 035901 CrossRef.
- Lavalle, M.; Schanne, O. F.; Hebert, N. C., ed. Glass Microelectrodes; John Wiley and Sons, Inc.: New York, NY, 1969 Search PubMed.
- O. E. Husser, D. H. Craston and A. J. Bard, J. Electrochem. Soc., 1989, 136, 3222–3229 CAS.
- C. Wei and A. J. Bard, J. Electrochem. Soc., 1995, 142, 2523–2527 CAS.
- E. N. Ervin, H. S. White and L. A. Baker, Anal. Chem., 2005, 77, 5564–5569 CrossRef CAS.
- Y. E. Korchev, M. Milovanovic, C. L. Bashford, D. C. Bennett, E. V. Sviderskaya, I. Vodyanoy and M. J. Lab, J. Microsc., 1997, 188, 17–23 CrossRef.
- A. I. Shevchuk, J. Gorelik, S. E. Harding, M. J. Lab, D. Klenerman and Y. E. Korchev, Biophys. J., 2001, 81, 1759–1764 CrossRef.
- Fleischer, R. L.; Price, P. B.; Walker, R. M., ed. Nuclear Tracks in Solids; University of California Press: Berkeley, CA, 1975 Search PubMed.
- http://gwyddion.net/ .
Footnote |
| † Electronic supplementary information (ESI) available: Characterization details, additional figures, and discussion. See DOI: 10.1039/c0an00604a |
| This journal is © The Royal Society of Chemistry 2011 |