Thiolated eggshell membranes sorb and speciate inorganic selenium†
Ting
Yang
a,
Ming-Li
Chen
a,
Xian-Wei
Hu
b,
Zhao-Wen
Wang
b,
Jian-Hua
Wang
*a and
Purnendu K.
Dasgupta
*c
aResearch Center for Analytical Sciences, Northeastern University, Box 332, Shenyang 110819, China. E-mail: jianhuajrz@mail.neu.edu.cn
bCollege of Material and Metallurgy, Northeastern University, Shenyang 110819, China
cDepartment of Chemistry and Biochemistry, The University of Texas at Arlington, Arlington, TX 76019-0065, USA. E-mail: dasgupta@uta.edu
First published on 29th September 2010
Abstract
Eggshell membranes (ESMs) provide a unique, disulfide bond-rich surface. Thioglycolate reduction was used to generate thiol (–SH) groups on the ESM surface by S–S bond cleavage. The thiol-bearing ESMs (TESMs) were characterized by scanning electron microscopy and Raman spectroscopy. The fibrous network structure of the ESM is retained in the TESMs. TESMs adsorb both Se(IV) and Se(VI) but by different mechanisms: Se(VI) is retained reversibly, possibly via ionic interactions, while Se(IV) is reduced to Se(0) and deposited. We thus demonstrate speciation of selenium species, by using samples (a) as such and after prior oxidation to Se(VI), (b) preconcentration on a TESM microcolumn, (c) elution by 0.5 M HNO3 that only elutes Se(VI) and (d) detection by graphite furnace atomic absorption spectrometry (GFAAS). The Se(IV) amount is determined by difference. For a 1.0 mL sample, the enrichment factor was 17.2, the S/N = 3 detection limit was 0.06 μg L−1 and the precision was 3.3% at 0.50 μg L−1. The linear range was 0.25–2.50 μg L−1. The procedure was validated by analyzing selenium in certified reference materials of human hair (GBW 09101) and rice (GBW 10010). We further demonstrate utility by speciation of inorganic selenium in a series of water samples.
1. Introduction
Sorption of metal species by biological substrates, i.e., microorganisms, biological cells and natural biomaterials, often termed biosorption, is a promising approach for the selective binding of metals and metalloids, including radionuclides. This has been widely used in effluent treatment and precious metal recovery. The vast potential of biosorption in the separation/preconcentration and speciation of trace metal species, based on their interactions with the functional groups on the sorbents, has recently been demonstrated. Analytes can be (selectively) retained on the substrate and afterwards eluted in an order corresponding to the binding affinity with the sorbent; this affinity is often controlled by the specific chemical form of the element.1 Accordingly, biomaterials have been utilized for the speciation of CH3Hg+/Hg2+,2,3Sb(III)/Sb(V),4,5 Se(IV)/(VI),4As(III)/As(V)6 and Sn(II)/Sn(IV).7 The selective separation of Cr(III) and Cr(VI) is particularly facile as the corresponding ions are oppositely charged; such has been carried out with Saccharomyces cerevisiae,8,9Chlorella vulgaris,10 moss11 and eggshell membranes (ESMs).12 Living bacterial cells also differ in their uptake of different species of the same metal;13 the differentiation of inorganic As(III) and As(V) by living HeLa cells was recently reported.14Most biosorbent-based speciation studies were carried out in a batch mode that is laborious and tedious. On-line arrangements utilizing biosorbent-packed mini-columns possess clear advantages over batch mode operations in terms of automation, reproducibility, ease of recovery of the metal species and, where possible, regeneration of the sorbent.1,15
An ESM provides a unique natural cell surface with a variety of functional groups. It has been used for the uptake of organic molecules,16 heavy metals17 and to speciate chromium.12 It is known that an ESM surface readily takes up inorganic Se;18 however, Se(IV) and Se(VI) behave so similarly both during sorption and elution that no discrimination is possible. Surface modification of a sorbent can be used to modify its properties; for an ESM, appropriate reduction can create thiol groups by cleaving the disulfide linkage. The thiolated ESM (TESM) surface may behave differently towards Se(IV) and Se(VI), permitting speciation.
In this paper we describe the conversion of an ESM to a TESM by thioglycolate and demonstrate its utility in differential determination of Se(IV) and Se(VI) in an automated system.
2. Experimental
2.1. Instrumentation
An SP-3530GA atomic absorption spectrometer (GFAAS, Shanghai Spectrum Instruments, China) with deuterium background correction was used. A selenium hollow cathode lamp (Rayleigh Analytical Instrument, Beijing, China) was used as the light source at a wavelength of 196.0 nm and operated at 6.0 mA, with a 0.7 nm slit width. Pyrolytically coated graphite tubes with L'vov platforms were used. Magnesium nitrate (2 μg) was employed as the modifier. The GFAAS temperature program is as following: drying at 120 °C (15/15 s ramp/holding time), pyrolysis at 1000 °C (15/15 s), atomization at 2400 °C (0/3 s), and cleaning at 2600 °C (0/3 s).A FIAlab-3000 sequential injection system (FIAlab Instruments, Bellevue, WA, USA), equipped with a 2.5 mL syringe pump and a six-port distribution valve was utilized for fluid delivery and sample processing. The system, incorporating a micro-column packed with TESM particles, and coupled to the GFAAS, is shown in Fig. 1. All conduits in the flow system were 0.8 mm i.d. PTFE tubing.
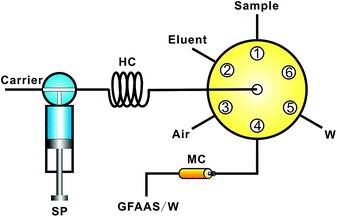 | ||
| Fig. 1 System for on-line selenium measurement system with TESM preconcentration mini-columns followed GFAAS detection. SP: syringe pump; HC: holding coil; MC: mini-column packed with 20–40 mesh TESM. | ||
An AFS-920 non-dispersive atomic fluorescence spectrometer (Titan Instruments, Beijing, China) with an electrically ignited concentric quartz tube atomizer was employed for the determination of selenium in the eluate.
Scanning electron micrographs were taken on an SSX-550 scanning electron microscope (SEM, Shimadzu, Japan). Raman spectra were obtained on a Labram HR 800 Raman Spectrometer (Jobin Yvon/Horiba, France), equipped with a He-Ne laser (632.8 nm) and 50 × 0.50 Olympus microscope objectives.
2.2. Chemicals
Unless indicated otherwise, all chemicals used in the experiments were at analytical reagent grade (G.R.) obtained from Sinopharm Chemical Reagent Co. (Shanghai, China). Stock solutions of Se(IV) and Se(VI) (1000 mg L−1) were prepared by dissolving appropriate amounts of Na2SeO3 and Na2SeO4 in 1.0 M HCl, respectively, and lower concentration standards were prepared by serial dilution of the stock. Basic ammonium thioglycolate solution was prepared by adding an appropriate volume of ammonia to thioglycolic acid. The pH of the sample solution was adjusted by using 0.1 M ammonia and/or 0.1 M HNO3. Deionized water (18.2 MΩ·cm) was used throughout for preparing the solutions, and also used as carrier.2.3. Sample pretreatment and preparation of the thiolated eggshell membrane
Certified reference material GBW 09101 (human hair) and GBW 10010 (rice) (http://www.ncrm.org.cn/Home/Index.aspx): 0.0500 g of human hair and 0.2500 g of rice powder were taken into PTFE digestion vessels along with 10 mL of HNO3 (65%, w/v). After soaking for 2 h at room temperature, the mixtures were digested on a microwave oven by using the following program: 150 °C/20 atm for 5 min; 180 °C/22 atm for 5 min. Thereafter, the sample solutions were evaporated to ∼1 mL on a sand bath at 150 °C. A drop of hydrogen peroxide (30%, v/v) was next added and the mixture further heated to near dryness. The residue was finally taken up in deionized water and diluted to 50 mL. A blank was processed in the same manner.Bottled mineral water and mineral water specifically stated to be selenium-rich were acquired from a local supermarket; rain samples were locally collected. All water samples were filtered through a 0.22 μm membrane filter and adjusted to pH 5.8 before processing and analysis.
To prepare the TESM, after the ESM was collected as described previously,12 50 mg was soaked in 20 mL of basic ammonium thioglycolate solution 10% (v/v) for 12 h. The TESM was filtered out, washed with deionized water thrice and dried at 50 °C for 2 h. It was then ground and sieved to 20–40 mesh particles. A 5 mg aliquot of the TESM particles was packed into a segment of 2.0 mm i.d., 5.0 mm o.d. PTFE tubing using glass wool plugs at each end; the effective column length was ∼10 mm. Before use, the column was rinsed (10 μL s−1 for 60 s) alternately with 1 M HNO3 and deionized water 3 times and finally all liquid is aspirated out by evacuation.
2.4. Operating procedure
Referring to Fig. 1, the following steps are used: 1000 μL of sample solution followed by 200 μL of air were aspirated into the holding coil at a flow rate of 100 μL s−1 from port 1 and port 3 respectively. The sample zone was then dispensed at 5 μL s−1via port 4 through the TESM mini-column, during which time Se was taken up by the column. The air zone was used to remove residual excess liquid from the column after the adsorption/preconcentration process.After sample loading, 200 μL of air, 50 μL of eluent (0.5 M HNO3) and 20 μL of air were sequentially aspirated into the holding coil. The eluent zone was next directed to flow through the column at 2 μL s−1 for stripping the retained selenium. The selenium-bearing eluate was thereafter transported to the GFAAS instrument for quantification.
Before the next sample, 200 μL of air, 1000 μL of deionized water and 100 μL of 0.5 M HNO3 were aspirated sequentially into the holding coil, the stacked zones were directed to flow through the mini-column to eliminate potential residues on the TESM column and leaving it without excess acid.
2.5. Batch adsorption and breakthrough capacity of thiolated eggshell membrane
Batch adsorption kinetics of Se(IV) and Se(VI) were evaluated as follows: 5 mg of TESM was added to 10 mL of 60 μg L−1Se(IV) or Se (VI) solutions under magnetic stirring, and the concentration of Se(IV) or Se(VI) in the supernatant was quantified by GFAAS at appropriate time intervals.To determine dynamic breakthrough capacities 100 μg L−1Se(IV) or Se(VI) solution was continuously passed through a mini-column loaded with 5 mg of TESM at a flow rate of 5 μL s−1 until complete breakthrough occurred. The effluent was collected in 1000 μL aliquots and the Se concentration was determined by GFAAS.
3. Results and discussion
3.1. Characterization of the thiolated eggshell membrane
An ESM is uniquely keratin rich; keratin is more than 3% S, much of which is represented by disulfide bonds, part of a cystine residue.19–21 It has long been known that the cystine disulfide linkage in keratin can be reduced to free thiol groups by reagents like ammonium thioglycolate.19Raman spectroscopy is useful to characterize disulfides and thiols because the Raman bands are more intense compared to their infrared absorption.22Fig. 2A and 2B respectively show the Raman spectrum of the original ESM and the TESM. The stretching mode of the S–S bond appears at 510 cm−1,23 while the stretching of the S–H bond is generally seen in the 2550–2590 cm−1 range,24 2573 cm−1 in the present case. The Raman spectra clearly shows that after reduction the characteristic S–S bond signature disappears and the S–H bond signature, characteristic of the TESM, appears. We also note that if the TESM is left exposed to air, the S–S bond signature slowly reappears (Fig. 2C), suggesting the need to store any prepared TESM in closed containers, preferably under nitrogen.
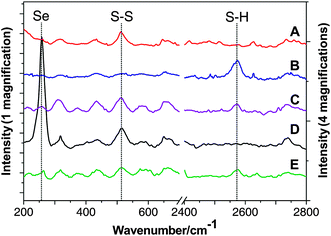 | ||
| Fig. 2 Raman spectra: (A) eggshell membrane (ESM); (B) TESM; (C) TESM after exposure to air for 1 month; (D) TESM after adsorption of Se(IV); (E) TESM after adsorption of Se(VI). For (D) and (E), the TESM was pre-treated with 200 mg L−1Se(IV) or Se(VI) solution (pH 5.8) under vigorous agitation for 60 min to facilitate adsorption. | ||
It is worth noting that thioglycolate reduction to create a TESM is a gentle process: it leaves the original fibrous structure of the ESM intact. SEM images of the TESM (Fig. 3A, 3B) indicate that the TESM retains a compact, cross-linked network that should provide a large surface area as a sorbent with good mass transfer characteristics.
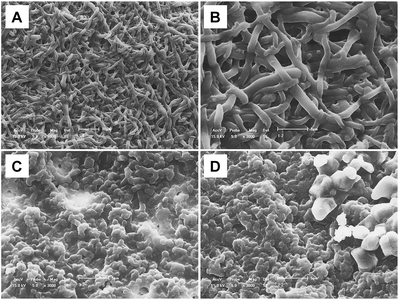 | ||
| Fig. 3 SEM image of the TESM before and after biosorption of Se(IV) and Se(VI): (A) TESM, 1000×; (B) TESM, 3000×; (C) TESM after adsorption of Se(IV), 3000×; (D) TESM after adsorption of Se(VI), 3000×. Preparation of (C) and (D) as in Fig. 2. | ||
3.2. Biosorption of selenium(IV) and selenium(VI) on the thiolated eggshell membrane. Adsorption kinetics and capacity
Results of batch experiments carried out to evaluate the uptake kinetics of Se(IV) (Fig. 4A) and Se(VI) (Fig. 4B) on the TESM illustrate that the adsorption kinetics for both species were fast processes. The data fit a first order kinetics with respective r2 values of 0.988 and 0.984. The respective best-fit rate constants are 0.432 and 0.427 s−1.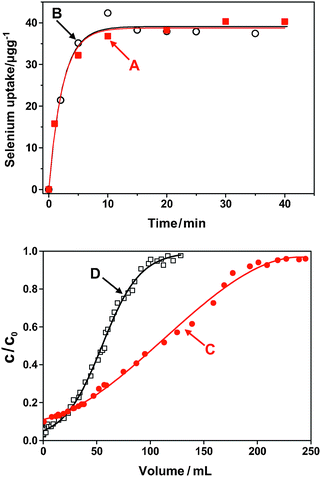 | ||
| Fig. 4 The sorption process of Se(IV)/Se(VI) on thio-ESM: (A) and (B) indicate the batch adsorption kinetics of Se(IV) and Se(VI), respectively; (C) and (D) illustrate the breakthrough curves of TESM for 100 μg L−1Se(IV) and Se(VI), respectively. | ||
The dynamic adsorption capacity, derived from the breakthrough curves obtained as described in the Experimental section are shown in Fig. 4C and Fig. 4D for Se(IV) and Se(VI), respectively, where C0 and C were the, respective concentrations of selenium in the original solution and the effluent.
The breakthrough curve is influenced by various experimental factors, including the initial concentration, flow rate, and the particle size of the absorbent. Under the experimental conditions, the respective capacities were 2.6 μg Se(IV)/mg TESM and 1.9 μg Se(VI)/mg TESM, respectively. The adsorption kinetics obtained from the batch experiments are likely to be more reliable than assessing kinetics from the dynamic breakthrough data because the binding of Se(IV) is not a reversible process (vide infra).
3.3. Sorption mechanisms
The TESM exhibits significant adsorption capacity and fast uptake for both Se(IV) and Se(VI). However, as elaborated below, the sorption occurs via different mechanisms.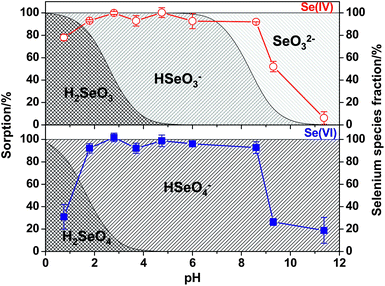 | ||
| Fig. 5 The adsorption efficiencies of Se(IV) and Se(VI) by a TESM mini-column as a function of pH. Sample: 200 μL, 30 μg L−1Se(IV) or Se(VI); sample loading flow rate: 5.0 μL s−1; eluent (0.5 M HNO3): 100 μL; elution flow rate: 2 μL s−1. | ||
| H2SeO3 + RSH → R–S–SeO2H + H2O |
| R–S–SeO2H + R–SH → R–S–Se(O)–S–R + R–S–Se–S–R |
| R–S–Se–S–R → R–S–S–R + Se |
More recently Forastiere et al.28 have elaborated on this mechanism, particularly when the reaction takes place in alkaline aqueous solution, but they also find the end products to be the same. Others have previously assigned the intense Raman band at 258 cm−1 to the asymmetric stretching mode of the –Se–Se– chain;29,30 there is therefore little doubt that elemental Se is formed. In addition, characteristic Raman bands of Se–S are normally located at 339 cm−1 and 359 cm−1,31 and their absence suggests that there is no conversion to Se(II). Visually, when treated with high concentration (e.g., 200 mg L−1) Se(IV), the TESM sorbent turns from ivory to brick red, the same color as amorphous selenium32 or nanoparticulate Se particles33 (Fig. 6). In contrast, there is no change in the color of the TESM when treated with Se(VI), regardless of concentration. All in all, there is little doubt that Se(IV) is reduced to Se(0) on the TESM surface.
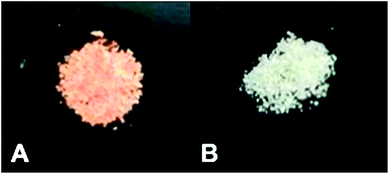 | ||
| Fig. 6 Photographs of the TESM after adsorption of Se(IV) and Se(VI): (A) TESM after adsorption of Se(IV); (B) TESM after adsorption of Se(VI). Preparation of (A) and (B) as in Fig. 2. | ||
When Se(VI) is retained on the TESM surface, no Se(0) or selenide is found (Fig. 2E). It is known that selenite is a strong oxidizing agent and could readily be reduced by thiols. On the other hand, however, selenate is much less reactive to thiols with respect to selenite.34 Previous investigations have indicated that when selenate is given intravenously, it could be cleared rapidly via renal filtration because of its low affinity between thiol groups of plasma proteins.35 Our experimental results agree well with these observations documented in the literature.
We note that the Raman spectrum of the Se(VI) treated TESM (Fig. 2E) also shows some indication for some S–S linkages being present. At the time this experiment was conducted we did not appreciate the need to store the TESM without exposure to air. This small formation of S–S bonds we must attribute to air oxidation. We observe that Se(VI) is taken up essentially quantitatively and eluted quantitatively. We have confirmed that there is no Se(IV) in the eluate by hydride generation-atomic fluorescence spectroscopy (HG-AFS). Only Se(IV) can be converted to the hydride36 and the eluate showed no signal in HG-AFS.
3.4. Preconcentration and speciated measurement of inorganic selenium species
The differences in pH-dependent uptake between Se(IV) and Se(VI) are not sufficient to clearly discriminate between them. We noted, however, that there is a marked difference in their elution behavior. While the retained Se(VI) could be readily and quantitatively recovered by 50–100 μL of 0.5 M HNO3, there was hardly any recovery of Se(IV) under the same conditions (Fig. 7). We tried several other eluents, including mineral acids and bases, oxidizing reagents (KMnO4, H2O2, KBrO3 and K2Cr2O7), complexing reagents (cysteine, ammonium pyrrolidine dithiocarbamate, imidazole, thiourea and thioglycolate) and strong reducing agents like NaBH4. Only high concentrations of NaOH or ammonia (20% v/v) resulted in partial (∼50%) elution of the selenium; like sulfur, elemental Se dissolves partly in strong alkali. But the recovery is still too low for the purposes of quantitative analysis. Base use is not practical: the TESM swells greatly in base and the reusability of the column suffers greatly. We chose therefore a strategy where the sample is preoxidized with KMnO437 to Se(VI) before TESM preconcentration, and with the usual 0.5 M HNO3 elution, this determined total Se. Next, the sample without any pretreatment was preconcentrated on the TESM, and the same HNO3 elution now measures only Se(VI). The Se(IV) originally present can be obtained by difference.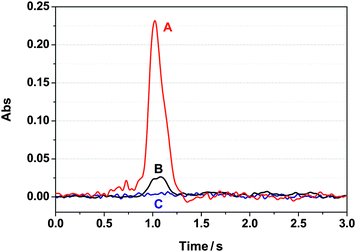 | ||
| Fig. 7 The recorded GFAAS peak shapes for selenium determination after preconcentration on the TESM mini-column: (A) 3.0 μg L−1Se(VI) after preconcentration/elution; (B) 3.0 μg L−1Se(IV) after preconcentration/elution; (C) blank solution undergoing the same preconcentration/elution process. Sample volume: 1000 μL, 3.0 μg L−1Se(IV)/Se(VI); sample loading flow rate: 5.0 μL s−1; eluent (0.5 M HNO3): 100 μL; elution flow rate: 2.0 μL s−1. | ||
3.5. Parametric effects on the preconcentration of selenium species
The pH of the sample solution, sample loading flow rate, eluent concentration and eluent flow rate were optimized with respect to sensitivity, precision and sampling frequency in determining Se(VI).As previously discussed (Fig. 5), the Se(VI) sorption efficiency on the TESM is high over a wide pH range. Standards were prepared in deionized water without any further treatment and acid digests were adjusted to have a pH between 5 and 7 before preconcentration. The loading flow rate was investigated: within a range of 2–20 μL s−1, the sorption efficiency decreased monotonically from 96 ± 3% at 2 μL s−1 to 38 ± 8% at 20 μL s−1; detailed results are shown in Fig. S1A in the Supporting Information.† At 5 μL s−1, the sorption efficiency was 89 ± 4%; we chose to operate at this loading rate as a compromise between the capture efficiency and the sampling throughput.
We studied 0.1–1.6 M HNO3 (100 μL, 2 μL s−1) for the elution of retained Se(VI) from the TESM column. With 0.1 M HNO3, <40% of the retained Se(VI) was eluted whereas at concentrations > 0.5 M the elution was essentially quantitative. Detailed results are shown in Fig. S2 in the Supporting Information.†
We chose 0.5 M HNO3 as the eluent and studied the effect of the eluent flow rate (2–20 μL s−1) with an eluent volume of 50 μL. The elution efficiency dropped monotonically from 89 ± 1% at 2 μL s−1 to 72 ± 1% at 20 μL s−1 (detailed results are shown in Fig. S1B in the Supporting Information†). A high elution efficiency is essential and we chose 2 μL s−1 for further work.
3.6. Interferences
The interfering effect of several foreign ions was tested. The selenium species are anionic, and cationic species are not expected to interfere. At a selenium concentration level of 0.5 μg L−1 and within a ±5% error range, 40 mg L−1HCO3−, 25 mg L−1SO42−, Cl−, 1 mg L−1PO43−, 500 μg L−1As(V), Cr(VI) and Mn(VII) posed no interferences. For common biological and environmental samples, the contents of the above foreign ions in the sample digests, especially after any needed dilution, will not exceed these tolerated concentration levels; therefore, the present procedure can be directly utilized for the preconcentration and speciation of inorganic selenium species.3.7. Se(IV) retention and Se(0) accumulation on the TESM surface. Effect on Se(VI) capture and column reusability
Because the presence of any Se(IV) results in the irreversible formation of Se(0) on the TESM, two questions arise naturally: (a) does the Se(VI) recovery depend on the Se(VI)/Se(IV) ratio? and (b) how does the accumulation of Se(0) on the TESM column interfere with the capture and recovery of Se(VI)?To address (a), we did an experiment in which three samples with a Se(VI) : Se(IV) ratio from 4![[thin space (1/6-em)]](https://www.rsc.org/images/entities/char_2009.gif) :
:![[thin space (1/6-em)]](https://www.rsc.org/images/entities/char_2009.gif) 1 to 1
1 to 1![[thin space (1/6-em)]](https://www.rsc.org/images/entities/char_2009.gif) :
:![[thin space (1/6-em)]](https://www.rsc.org/images/entities/char_2009.gif) 1 to 1
1 to 1![[thin space (1/6-em)]](https://www.rsc.org/images/entities/char_2009.gif) :
:![[thin space (1/6-em)]](https://www.rsc.org/images/entities/char_2009.gif) 4 were taken (Se(VI) and Se(IV): 2.0, 0.5; 1.0, 1.0; and 0.5, 2.0 μg L−1, respectively). The samples were analyzed for Se(VI) as such and after oxidation with KMnO4 (total Se). Values found for Se(VI) and total Se for the three samples above were, respectively (mean ± sd, n = 3 each): 2.08 ± 0.08, 2.53 ± 0.11; 0.99 ± 0.05, 1.94 ± 0.10; and 0.50 ± 0.02, 2.32 ± 0.10 μg L−1. We considered this performance (2.7 ± 2.6% mean error, 7.2% maximum error) acceptable.
4 were taken (Se(VI) and Se(IV): 2.0, 0.5; 1.0, 1.0; and 0.5, 2.0 μg L−1, respectively). The samples were analyzed for Se(VI) as such and after oxidation with KMnO4 (total Se). Values found for Se(VI) and total Se for the three samples above were, respectively (mean ± sd, n = 3 each): 2.08 ± 0.08, 2.53 ± 0.11; 0.99 ± 0.05, 1.94 ± 0.10; and 0.50 ± 0.02, 2.32 ± 0.10 μg L−1. We considered this performance (2.7 ± 2.6% mean error, 7.2% maximum error) acceptable.
To address (b), we analyzed a mixture containing 1.0 μg L−1 each of Se(IV) and Se(VI) 20 times in succession. There was no significant change from run 1 (0.94 μg L−1) to run 20 (0.97 μg L−1), the average (±sd) for all the runs was 0.94 ± 0.02 μg L−1. The variation during successive measurement was not monotonic but random. Detailed data are shown as a bar graph in Fig. S3 in the Supporting Information.† These results indicate that, at these levels, the column can be reused at least 20 times. These results are understandable, according to capacity measurement data previously presented, and the full breakthrough capacity of a column containing 5 mg TESM is 13 μg of Se(IV); in the present experiments only 20 ng of Se(IV) has been put on. A more challenging experiment was next done: 100 μg L−1 of Se(IV) and 0.5 μg L−1 of Se(VI) successively passed through the TESM column, the retained Se was eluted by HNO3 after each run. Within a ±5% error range, the retained Se(0) posed no interferences on the recovery of Se(VI).
3.8. Performance and validation
All the relevant analytical figures of merit and volume requirements are summarized in Table 1. In order to validate the present method, total Se in certified reference materials (CRMs) human hair (GBW 09101) and rice (GBW 10010) were analyzed by measuring Se(VI) after digestion. The values found were 0.61 ± 0.07 μg g−1 (certified 0.58 ± 0.05 μg g−1) for the hair sample and 72 ± 10 ng g−1 (certified 61 ± 15 ng g−1) for the rice sample, in both cases within the certification limits. We also analyzed a CRM for simulated natural water, GBW(E)080395, certified to contain 1.00 ± 0.03 mg L−1Selenium. We detected no Se(VI) by our method and after oxidation (and appropriate dilution before measurement) found 0.96 ± 0.03 mg L−1 total Se. We also analyzed a selenium-rich mineral water, bottled mineral water and rainwater sample both directly and after oxidation, each in triplicate. The first sample contained 2.47 ± 0.27 μg L−1Se(VI) and 3.52 ± 1.16 μg L−1 total Se; the other two samples did not contain any detectable Se. Upon addition of 1.0 μg L−1Se(VI), the recoveries of Se(VI) for the three respective samples were 105 ± 3%, 94 ± 3% and 96 ± 4%.| Sample volume | 1000 μL |
| Eluent volume (0.5 mol L−1HNO3) | 50 μL |
| Enrichment factor | 17.2 |
| Precision (RSD, n = 9) | 3.3% (0.50 μg L−1Se(VI)) |
| Sorption efficiency (1.5 μg L−1) | 89 ± 4% (loading flow rate at 5.0 μL s−1) |
| Elution efficiency | 89 ± 1% (elution flow rate at 2.0 μL s−1) |
| Detection limit (3σ, n = 11) | 0.06 μg L−1 |
| Linear range | 0.25–2.50 μg L−1 |
| Regression equation | Abs = 0.151CSe(μg L−1) + 0.0398 (R2 = 0.9991) |
4. Conclusions
Eggshell membranes were reduced by thioglycolate to cleave disulfide bonds and form thiol groups. The TESM thus formed retained the basic fibrous physical structure of the original ESM. The TESMs take up Se both as Se(IV) and Se(VI). The Se(VI) can be reproducibly eluted from the TESM with 0.5 M HNO3 whereas Se(IV) is reduced by the thiol groups to Se(0) which cannot be eluted. Measuring the Se(VI) content of a sample before and after KMnO4 oxidation provides a means to determine Se(VI) and total Se, respectively, and thereby determine Se(IV) by difference.Acknowledgements
Financial support from the Natural Science Foundation of China (No. 20805004, key project No. 20635010, National Science Fund for Distinguished Young Scholars No. 20725517 and Major International Joint Research Project 20821120292), the 973 program (2007CB714503) and Fundamental Research Funds for the Central Universities (N090105001, N090605001, N090405004) is gratefully acknowledged. P.K.D. was supported by a US National Science Foundation Grant CHE-0821969.References
- Y. Madrid and C. Camara, TrAC, Trends Anal. Chem., 1997, 16, 36 CrossRef.
- Y. Madrid, C. Cabrera, T. Perezcorona and C. Camara, Anal. Chem., 1995, 67, 750 CrossRef CAS.
- T. Perez-Corona, Y. Madrid-Albarran, C. Camara and E. Beceiro, Spectrochim. Acta, Part B, 1998, 53, 321 CrossRef.
- T. PerezCorona, Y. Madrid and C. Camara, Anal. Chim. Acta, 1997, 345, 249 CrossRef CAS.
- A. A. Menegario, A. J. Silva, E. Pozzi, S. F. Durrant and C. H. Abreu, Spectrochim. Acta, Part B, 2006, 61, 1074 CrossRef.
- P. Smichowski, J. Marrero, A. Ledesma, G. Polla and D. A. Batistoni, J. Anal. At. Spectrom., 2000, 15, 1493 RSC.
- R. Caldorin and A. A. Menegario, Microchim. Acta, 2007, 157, 201 CrossRef CAS.
- A. A. Menegario, P. Smichowski and G. Polla, Anal. Chim. Acta, 2005, 546, 244 CrossRef CAS.
- H. Bag, A. R. Turker, M. Lale and A. Tunceli, Talanta, 2000, 51, 895 CrossRef CAS.
- A. M. Zou, X. Y. Tang, M. L. Chen and J. H. Wang, Spectrochim. Acta, Part B, 2008, 63, 607 CrossRef.
- M. V. B. Krishna, K. Chandrasekaran, S. V. Rao, D. Karunasagar and J. Arunachalam, Talanta, 2005, 65, 135.
- A. M. Zou, X. W. Chen, M. L. Chen and J. H. Wang, J. Anal. At. Spectrom., 2008, 23, 412 RSC.
- A. J. Aller and L. C. Robles, J. Anal. At. Spectrom., 1998, 13, 469 RSC.
- X. W. Chen, A. M. Zou, M. L. Chen, J. H. Wang and P. K. Dasgupta, Anal. Chem., 2009, 81, 1291 CrossRef CAS.
- A. M. Zou, M. L. Chen, Y. Shu, M. Yang and J. H. Wang, J. Anal. At. Spectrom., 2007, 22, 392 RSC.
- M. Arami, N. Y. Limaee and N. M. Mahmoodi, Chemosphere, 2006, 65, 1999 CrossRef CAS.
- S. Ishikawa, K. Suyama, K. Arihara and M. Itoh, Bioresour. Technol., 2002, 81, 201 CrossRef CAS.
- S. I. Ishikawa, S. Sekine, N. Miura, K. Suyama, K. Arihara and M. Itoh, Biol. Trace Elem. Res., 2004, 102, 113 CrossRef CAS.
- D. R. Goddard and L. Michaelis, J. Biol. Chem., 1934, 106, 605 CAS.
- W. Akhtar, H. G. M. Edwards, D. W. Farwell and M. Nutbrown, Spectrochim. Acta, Part A, 1997, 53, 1021 CrossRef.
- W. Akhtar and H. G. M. Edwards, Spectrochim. Acta, Part A, 1997, 53, 81 CrossRef.
- E. Smith, G. Dent, Modern Raman Spectroscopy: A Practical Approach. John Wiley & Sons.: Chichester, 2005; p 16 Search PubMed.
- M. C. Teixeira, V. S. T. Ciminelli, M. S. S. Dantas, S. F. Diniz and H. A. Duarte, J. Colloid Interface Sci., 2007, 315, 128 CrossRef CAS.
- G. D. Fleming, J. J. Finnerty, M. Campos-Vallette, F. Celis, A. E. Aliaga, C. Fredes and R. Koch, J. Raman Spectrosc., 2009, 40, 632 CrossRef CAS.
- J. A. Dean, Langes's Handbook of Chemistry. McGraw-Hill: New York, 1986 Search PubMed.
- W. E. Laitinen, H. A. Laitinen and W. E. Harris, Chemical Analysis, McGraw-Hill, New York, 2nd edn, 1975, p. 46 Search PubMed.
- J. L. Kice, T. W. S. Lee and S. Pan, J. Am. Chem. Soc., 1980, 102, 4448 CrossRef CAS.
- D. O. Forastiere, E. B. Borghi and P. J. Morando, Helv. Chim. Acta, 2007, 90, 1152 CrossRef CAS.
- S. N. Yannopoulos and K. S. Andrikopoulos, J. Chem. Phys., 2004, 121, 4747 CrossRef CAS.
- V. V. Poborchii, A. V. Kolobov, J. Caro, V. V. Zhuravlev and K. Tanaka, Chem. Phys. Lett., 1997, 280, 17 CrossRef CAS.
- J. O. Jensen, THEOCHEM, 2005, 728, 243 CrossRef CAS.
- Z. X. Chen, Y. H. Shen, A. J. Xie, J. M. Zhu, Z. F. Wu and F. Z. Huang, Cryst. Growth Des., 2009, 9, 1327 CrossRef CAS.
- Z. H. Lin and C. R. C. Wang, Mater. Chem. Phys., 2005, 92, 591 CrossRef CAS.
- G. Spyrou, M. Bjornstedt, S. Skog and A. Holmgren, Cancer Res., 1996, 56, 4407.
- O. A. Levander, Bull. N.Y. Acad. Med., 1984, 60, 144 Search PubMed.
- J. E. Conde and M. S. Alaejos, Chem. Rev., 1997, 97, 1979 CrossRef CAS.
- C. Xiong, M. He and B. Hu, Talanta, 2008, 76, 772 CrossRef CAS.
Footnote |
| † Electronic supplementary information (ESI) available: Figures showing the effects on the sorption and elution processes. See DOI: 10.1039/c0an00480d |
| This journal is © The Royal Society of Chemistry 2011 |
