Geometrical effect of CuO nanostructures on catalytic benzene combustion†
Zhaoyang
Fei
,
Ping
Lu
,
Xinzhen
Feng
,
Bo
Sun
and
Weijie
Ji
*
Key Laboratory of Mesoscopic Chemistry, MOE, School of Chemistry and Chemical Engineering, Nanjing University, Nanjing 210093, P. R. China. E-mail: jiwj@nju.edu.cn; Fax: +86-25-8331776
First published on 20th April 2012
Abstract
CuO nanostructures of different morphologies were synthesized and compared for catalytic benzene combustion. XRD patterns of various CuO nano-crystallites suggest the monoclinic CuO structure. The dominant crystal planes of various CuO nanostructures are identified by means of HRTEM and electron diffraction. The amount of oxygen adspecies was found to be strongly dependent on the orientation of crystal planes. The activity of benzene combustion over major crystal planes of CuO nanostructures is: (200) > (111) > (01![[1 with combining macron]](https://www.rsc.org/images/entities/char_0031_0304.gif) ) > (001), consistent with the order of the corresponding density of terminate Cu2+ ions on which both benzene and oxygen are activated.
) > (001), consistent with the order of the corresponding density of terminate Cu2+ ions on which both benzene and oxygen are activated.
1. Introduction
Catalysts based on copper oxides are of great importance for catalytic processes such as oxidation of carbon monoxide,1,2 selective catalytic reduction of nitric oxide,3–5 olefin epoxidation with molecular oxygen,6 water-gas shift reaction7,8 and so forth. It is also established that such materials are effective combustion catalysts for removal of volatile organic compounds (VOCs), especially the total oxidation of light hydrocarbons, alcohols, aromatics, esters, ketones etc., for environmentally benign energy generation and emission control. Therefore, copper oxides and their applications have been extensively studied.9–17Controlled synthesis of nano-sized crystallites of different morphology has attracted remarkable attention in recent years.18–22 The geometrical structure of different nano-crystallites can have an intensive effect on catalytic activity and selectivity owing to the differences in arrangement of surface atoms and the density of dangling bonds on various specific crystal planes. It is desirable to obtain the nanostructures of specifically exposed crystal plane(s) on which there are higher density of active sites and higher reactivity.
Over the past decade, increasing attention has been paid to the catalytic combustion of VOCs, as a large number of VOCs are emitted from industrial, transportation, and decoration activities and most of them are harmful to the atmosphere and human health.23 The noble metal catalysts can exhibit excellent low-temperature activity; while there is high cost issue for applications.24,25 Transition metal oxides including copper oxide, spinel cobalt oxide, manganese oxide, and chromium oxide have been reported for catalytic removal of VOCs.9–11,17,26–28 In the present work, copper oxides on the nano-scale with significantly different morphologies were synthesized through a hydrothermal or a solvothermal route, involving the use of certain surfactants and different solvents. The catalytic benzene combustion was also studied to elaborate the effect of morphology of CuO nano-crystallites on the activity of benzene combustion.
2. Experimental section
2.1 Synthesis of CuO nanostructures
2.2 Materials characterization
Powder X-ray Diffraction (XRD) was performed on a Philips X'Pert Pro diffractometer with Cu-Kα radiation (λ = 0.1541 nm). The size and morphology of as-synthesized samples were determined by using a transmission electron microscope (TEM) JEOL JEM-1010, at an accelerating voltage of 80 kV. HRTEM images were taken on a JEOL JEM-2100 electron microscope operated at 200 kV. Every sample was first subjected to grinding in an agate mortar and then the sample powder was rather uniformly dispersed in absolute ethanol by means of a mild sonication. BET surface area was measured at −196 °C on a NOVA-1200 Material Physical Structure Determinator using N2 as the probe molecule. Prior to the measurements, all the samples were degassed at 300 °C for 4 h. Temperature-programmed desorption (TPD) of O2 was carried out under Ar flow (60 ml min−1) in the range of RT to 600 °C at a rate of 10 °C min−1. The catalyst (400 mg) was pretreated in Ar at 300 °C for 1 h, and then adsorption was performed in pure O2 at 200 °C for 1 h. After cooling to RT, the sample was purged in Ar (60 ml min−1) for 1 h. A thermal conductivity detector was employed to measure the desorption profiles.2.3 Catalyst activity
The catalysts were evaluated at atmospheric pressure using a fixed bed quartz reactor. 500 mg of the sample was used and diluted with chemically inert SiC. Before reaction, the catalysts were pretreated with air (40 ml min−1) at 200 °C for 1 h. The benzene vapor was carried by an air flow bubbling through a saturator (benzene of 1000 ppm balanced by dry air). The total flow rate was 40 ml min−1. The outlet products were analyzed by two on-line gas chromatographs equipped with a HP FFAP column (0.32 mm × 25 m) and a flame ionization detector, and a packed column of Alltech Hayesep D HP and a thermal conductivity detector. The differences between the inlet and outlet concentrations were used to calculate conversion. No carbon containing product other than CO2 has been detected which was further confirmed by carbon balance on benzene and CO2 with an accuracy of ±2%. Blank experiments were conducted in an empty reactor which showed negligible activity over the temperature range used. Two catalytic cycles plus continuous running at constant 90% benzene conversion were performed to test catalyst stability.3. Results and discussion
3.1 XRD
Fig. 1 shows the XRD patterns of the copper oxide nanostructures obtained via different approaches. All the samples were identified solely as the monoclinic CuO phase. The diffraction patterns of the CuO nanocuboids show the lowest intensity of diffraction peaks among the four CuO nanostructures, partly owing to their smaller particle size (estimated to be ca. 15 nm based on the analysis of the half width of the representative diffraction peak using Scherrer's equation). For the CuO nanoplatelets and nanocuboids, the intensity of the (200)/(111) peaks is higher than that of the (002)/(11) ones. However, the reverse situation was observed for the nanorods and nanobelts. It is technically difficult for us to identify the net planes from the XRD diffraction patterns. Nevertheless, the difference in the intensity of the related peaks over the four CuO nanostructures is likely due to the texture effect as well as the dimension/morphology change in a certain direction. Singh et al. reported that the alteration of morphology and growth direction can result in the change in intensity of the XRD pattern.29 Note that the real orientation of the crystal planes of CuO nanostructures is identified by the HRTEM observations and electron diffraction patterns. And the specific rates of the dominant planes are estimated in line with the results of HRTEM and electron diffraction patterns, not with that of XRD patterns.
 | ||
| Fig. 1 XRD patterns of (a) CuO nanoplatelets, (b) nanorods, (c) nanobelts, and (d) nanocuboids. | ||
CuO generally crystallizes in the complex monoclinic tenorite structure. In the synthetic procedures adopted in the present study, NaOH first reacts with CuCl2 to generate Cu(OH)2 nanorods that can be further transformed into CuO nanorods upon thermo-treatment. The CuO nanorods can also self-assemble into a two-dimensional netted structure and further transform into nanoplatelets through Ostwald ripening in the medium of H2O–ethanol mixture.29 In case absolute ethanol is used as the solvent, the asymmetric growth is unfavorable due to lower polarity of the solvent, thus the morphology of CuO can be effectively modified, yielding essentially nanocuboids. NaOH is a strong electrolyte, high concentration of NaOH in the solution could result in the neutralization of the surface charges of CuO nanorods, which in turn prevents them from aggregation; in other words, the “oriented attachment” among the original CuO nanorods was highly prohibited, yielding essentially CuO nanorods.30 A high concentration of NaOH may also favour the interaction of OH− species with certain planes of CuO nanorods, leading to the energetically favourable anisotropic growth of specific planes. In the synthesis of CuO nanobelts, the introduced SDBS surfactant played an important role, kinetically controlling the growth rates of crystallographic facets of monoclinic CuO through selectively adsorbing on these facets.31
3.2. N2 sorption measurement
Table 1 presents the BET surface areas of the samples before and after reaction. The SBET of nanocuboids is about 3 times higher than that of other three catalysts. The SBET of nanoplatelets, nanorods and nanobelts are close to each other. The used catalysts show minor reduction in BET surface areas. The observation reveals that these nanostructures are rather stable during the reaction. Note that the BET surface area of sample is based on the unit mass of sample, not simply based on the geometrical appearance of a single particle; it is multiply determined by the factors such as the particle size and appearance as well as the number of particles on the basis of per unit mass of sample. For instance, the size of nanocuboids is notably smaller than that of nanorods; while the number of nanocuboids is much greater than that of nanorods on the basis of per unit mass of sample. The overall contribution from these two sides results in the larger surface area of nanocuboids.3.3 TEM/HRTEM
The morphological properties and structural information about the four CuO nanostructures were investigated by means of (HR)TEM as well as electron diffraction, and the results are shown in Fig. 2. The CuO nanoplatelets are uniform rectangles (Fig. 2a) and the average length, width, and thickness are ca. 150–200 nm, 80–100 nm, and ca. 8–10 nm, respectively. Whereas the average length and diameter of CuO nanorods are ca. 150–200 nm and 15–20 nm, respectively. The as-prepared CuO nanobelts show the uniform structure with ca. 1 μm in length, 50–70 nm in width and ca. 10 nm in thickness. The CuO nanocuboids are mono-dispersed with the uniform size of ca. 25 × 10 × 5 nm. Therefore, the TEM results suggest that the copper oxides of different morphology obtained in the present study are highly uniform.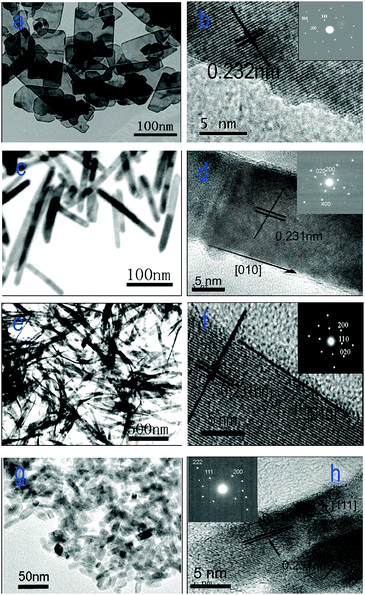 | ||
| Fig. 2 (HR)TEM images of (a, b) CuO nanoplatelets, (c, d) nanorods, (e, f) nanobelts, and (g, h) nanocuboids. | ||
The HRTEM images and electron diffraction patterns of the CuO nanostructures are also shown in Fig. 2. The HRTEM image and the electron diffraction pattern of a single CuO nanoplatelet are shown in Fig. 2b. It is observed that the platelet is a single crystal with the (01) plane as its dominant exposed facet. In the case of CuO nanorods, there are two different crystal planes that are predominantly exposed. Fig. 2d shows the crystal lattice image of a typical CuO nanorod with the growth direction of [010] together with the electron diffraction pattern (the inset of Fig. 2d). Clearly, the dominant exposed planes of the nanorods are (001) and (200). Different from the nanorods, the nanobelts possess thin side faces and flexible structure. The dominant exposed plane of CuO nanobelts is the (001) facet. One of the dominant exposed planes of the CuO nanocuboids, identical to the CuO nanoplatelets, is (01), which is the plane normal to the set of (200) planes with a lattice space of 0.231 nm and the set of (111) planes with a lattice space of 0.232 nm. The (111) planes, parallel to the side faces of nanocuboids, are the other dominant exposed planes of CuO nanocuboids.
3.4 O2-TPD
O2-TPD profiles of the fresh CuO nanostructures are illustrated in Fig. 3. Desorption of physically adsorbed oxygen species usually occurs below 100 °C. The surface oxygen adspecies such as O2− and O− will generally desorb below 400 °C, whereas the lattice oxygen species can desorb beyond 400 °C.32 In the present study, we did not attempt to determine the absolute amount of desorbed oxygen on each catalyst, instead, we compared in parallel the area of desorption peak on the basis of per unit mass and per unit surface area of catalyst, and the derived information is then correlated with the specific activity.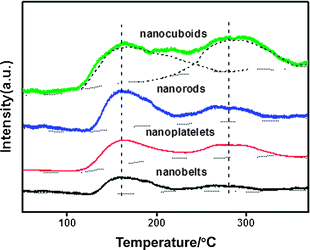 | ||
| Fig. 3 O2-TPD profiles of CuO nanostructures. | ||
On the basis of per unit mass of catalyst, the amount of oxygen adspecies over the CuO nanostructures has the following sequence: nanocuboids > nanorods > nanoplatelets > nanobelts (the relative values based on curve-fitting analysis are presented in Table 1). However, on the basis of per unit surface area of catalyst (considering the factor of deviation in the surface area of different catalysts), the following sequence is obtained for the density of oxygen species: nanorods > nanocuboids > nanoplatelets > nanobelts. Considering the surface area of catalyst together with the average surface area percentage of different facets, one can have the following sequence for the density of oxygen species on the facets of CuO nanostructures: (200) > (111) > (01) > (001). This order fits well with the sequence observed for the areal specific activities of the dominantly exposed facets (see Section 3.5). It was recognized that the oxygen adspecies is important for the VOCs oxidation through a suprafacial mechanism.27
3.5 Catalytic activity
Fig. 4a shows the catalytic activity for benzene combustion over the various CuO nanostructures. The temperatures at 10%, 50% and 90% conversion of benzene (denoted T10, T50 and T90, respectively) are given in Table 2. For all the catalysts, no carbon containing product other than carbon dioxide has been detected. The value of T50 over CuO nanocuboids is 167 °C. Compared to CuO nanocuboids, the value of T50 over nanorods is a bit higher (178 °C). The value of T50 over nanoplatelets is 192 °C, and that over nanobelts is the highest, 258 °C. Therefore, on the basis of per unit mass of catalyst, the following order in catalytic activity for benzene combustion: nanocuboids > nanorods > nanoplatelets > nanobelts is observed. | ||
| Fig. 4 (a) Catalytic activity of benzene combustion as a function of reaction temperature, and (b) activity with time on stream over CuO nanostructures at T90. | ||
It was observed that all the four CuO nanostructures are rather stable in the cyclic test and 30 h continuous running. The data shown in Table 2 suggest that the activities collected over the various catalysts are essentially identical in the first and second running. Moreover, the continuous running at constant 90% benzene conversion was operated over the four catalysts. One can see that good stability is achieved over 30 h reaction without significant activity decline (Fig. 4b).
Note that based on the per unit mass of catalyst, the surface areas of samples are rather different (Table 1). A comparison of catalytic activity on the basis of per unit area of catalyst is given in Table 1 and Fig. 5e. At a temperature of 170 °C, the benzene conversion over CuO nanocuboids, nanorods, nanoplatelets, and nanobelts is 60%, 25%, 12%, and 5%, respectively. Based on the specific surface areas of samples, one can obtain the areal specific rates over the various CuO nanostructures, and the result is found to be: nanorods > nanocuboids > nanoplatelets > nanobelts. Furthermore, if the dominant exposed planes of different samples are taken into consideration, one can also estimate the corresponding specific rates of benzene conversion on the major crystal planes of different CuO nanostructures (the details about how to calculate the values are given in the ESI†), and the results are illustrated in Fig. 5e. Clearly, the (200) plane shows the highest activity (11.26 × 10⁻² μmol m−2 s−1), followed by the (111) plane (8.42 × 10⁻² μmol m−2 s−1), the (01) plane (3.27 × 10⁻² μmol m−2 s−1), and the (001) plane (1.13 × 10⁻² μmol m−2 s−1).
 | ||
| Fig. 5 The top views of (a) (111), (b) (200), (c) (01), and (d) (001) faces of CuO nanocrystallites and the corresponding side views (the insets). The red balls denote O2− ions while the blue balls denote Cu2+ ions. (e) The specific rates of benzene conversion over (111), (200), (01) and (001) faces as well as the average rates of benzene combustion over various CuO nanostructures (reaction temperature = 170 °C). | ||
For the calculation of the percentage of the dominant facets, it is assumed that the non-dominant facets are as active as the dominant facets. And in order to make the rough estimation of specific activity of the dominant facets, the contribution of non-dominant facets is ignored, this is because if the contributions of the other two kinds of dominant crystal facets need to be independently and quantitatively determined, then the contribution of the non-dominant facets cannot be independently figured out from the overall contribution of the three kinds of crystal planes at a time. On the other hand, it is thought that there is insignificant difference in molecule diffusion onto the different facets. The nanoparticles are well-crystallized and non-porous, and the nature of sample porosity only results from the secondary pores due to the stacking of the nanoparticles, and is essentially mesoporous, thus the reaction is generally beyond diffusion limitation. Note that on the basis of the average specific rates of four CuO nanostructures, the reactivity of each nanostructure can be clearly differentiated (Fig. 5e), where, however, the reactivity of different facets and structural defects (if any) are averaged. The obtained values for the reactivity of dominant facets, however, are approximate at the expense of ignoring the contribution of non-dominant facets and averaging the reactivity of regular surface sites and that of possible surface defects. As a whole, one should recognize that the overall activities could be based on the complicated synergism effect of dominant surfaces, atom arrangement, specific particle size and surface area. The surface atomic configurations of the close-packed planes (111), (200), (01), and (001) are illustrated in Fig. 5a–d. The terminate structure of the (001) plane contains O2− ions, and those of the (111) and (01) planes are composed of both Cu2+ and O2− ions. For the CuO single crystal surfaces, there could be two terminated planes: the Cu2+-terminated one and the O2−-terminated one. And the real termination is strongly dependent upon the orientation of the specific crystal plane. For instance, in the cases of the corundum-type (0001) surfaces of Al2O3,33 Cr2O3,34 and Fe2O3,35 a stable structure is given by the metal ion-terminated surface.
According to our O2-TPD investigation (Table 1), the greatest amount of oxygen (on the basis of per unit surface area of catalyst) desorbs from the CuO nanorods on which the (200) plane is the dominant one. The result implies that Cu2+ sites of highest density are available over the (200) plane for oxygen (benzene) adsorption and activation. This is one of the reasons why the Cu2+-terminated model layer is selected for interpreting the reaction behaviour. Moreover, the presence of reactant molecules may modify the structural termination, thus a partially oxygen covered Cu2+-terminated surface is rather possible. Note also that a surface reconstruction could occur; especially the existing reactant molecules may induce such a reconstruction that can modify the surface geometry to a certain degree, namely, variation in the density of Cu2+ or O2− in the terminated surface of certain orientation, which in turn has an influence on the corresponding catalytic behaviour. It is likely that both benzene and oxygen molecules are preferably adsorbed and activated on the Cu2+ sites; and the activated benzene can be attacked by the adjacent oxygen adspecies. This could reasonably explain the observation why the (200) plane is apparently more active than the other three counterparts: the terminate Cu2+ ions of higher density are favourable for adsorption/activation of benzene and oxygen molecules. Si and Flytzani-stephanopoulos studied the surface properties of the Au/CeO2 systems,20 and found that the catalytic activities can be influenced to a certain extent by the surface properties of the Au/CeO2 entities with different morphologies.
4. Conclusions
In summary, the CuO nanostructures of cuboids, rods, platelets and belts have been successfully synthesized via a hydrothermal/solvothermal process. Based on the analysis of HRTEM images and electron diffraction patterns, the predominantly exposed planes of the highly uniform nano-crystallites are found to be (111) and (01) for the nanocuboids, (200) and (001) for the nanorods, (01) for the nanoplatelets and (001) for the nanobelts, respectively. The amount of oxygen adspecies is also dependent upon the morphological feature of the specific nanocrystallite and the geometrical structure of dominant crystal planes. These in turn show effects on adsorption and activation of benzene and oxygen molecules, and consequently the catalytic activity of benzene combustion. Estimation of the specific activity of benzene combustion over the dominant crystal planes of various CuO nanostructures showed the following order: (200) > (111) > (01) > (001). This study presented an example to demonstrate how activity can be influenced by the geometrical effect of the various well-defined crystal planes. One should recognize that the overall activities could be based on the complicated synergism effect of dominant surfaces, atom arrangement, specific particle size and surface area.
Notes and references
- H. Q. Wan, Z. Wang, J. Zhu, X. W. Li, B. Liu, F. Gao, L. Dong and Y. Chen, Appl. Catal., B, 2008, 79, 254 CrossRef CAS.
- F. Severino, J. Brito, O. Carías and J. Laine, J. Catal., 1986, 102, 172 CrossRef CAS.
- F. Amano, S. Suzuki, T. Yamamoto and T. Tanaka, Appl. Catal., B, 2006, 64, 282 CrossRef CAS.
- L. Ma, M. F. Luo and S. Y. Chen, Appl. Catal., A, 2003, 242, 151 CrossRef CAS.
- L. J. Liu, B. Liu, L. H. Dong, J. Zhu, H. Q. Wan, K. Q. Sun, B. Zhao, H. Y. Zhu, L. Dong and Y. Chen, Appl. Catal., B, 2009, 90, 578 CrossRef CAS.
- Y. Wang, H. Chu, W. M. Zhu and Q. H. Zhang, Catal. Today, 2008, 131, 496 CrossRef CAS.
- J. Papavasiliou, G. Avgouropoulos and T. Ioannides, Appl. Catal., B, 2007, 69, 226 CrossRef CAS.
- Y. S. She, L. Li, Y. Y. Zhan, X. Y. Lin, Q. Zheng and K. M. Wei, J. Rare Earths, 2009, 27, 411 CrossRef.
- M. Zimowska, A. Michalik-Zym, R. Janik, T. Machej, J. Gurgul, R. P. Socha, J. Podobiński and E. M. Serwicka, Catal. Today, 2007, 119, 321 CrossRef CAS.
- W. B. Li, J. X. Wang and H. Gong, Catal. Today, 2009, 148, 81 CrossRef CAS.
- M. Chen, L. P. Fan, L. Y. Qi, X. Y. Luo, R. X. Zhou and X. M. Zheng, Catal. Commun., 2009, 10, 838 CrossRef CAS.
- M. C. Alvarez-Galvan, V. A. de la Pena O'Shea, J. L. G. Fierro and P. L. Arias, Catal. Commun., 2003, 4, 223 CrossRef CAS.
- C. H. Wang, S. S. Lin, C. L. Chen and H. S. Weng, Chemosphere, 2006, 64, 503 CrossRef CAS.
- X. D. Wu, Q. Liang, D. Weng and Z. X. Lu, Catal. Commun., 2007, 8, 2110 CrossRef CAS.
- M. F. Luo, J. M. Ma, J. Q. Lu, Y. P. Song and Y. J. Wang, J. Catal., 2007, 246, 52 CrossRef CAS.
- W. Liu and M. Flytzani-stephanopoulos, J. Catal., 1995, 153, 317 CrossRef CAS.
- D. Delimaris and T. Ioannides, Appl. Catal., B, 2009, 89, 295 CrossRef CAS.
- Z. Y. Fei, S. C. He, L. Li, W. J. Ji and C. T. Au, Chem. Commun., 2012, 48, 853 RSC.
- N. Tian, Z. Y. Zhou, S. G. Sun, Y. Ding and Z. L. Wang, Science, 2007, 316, 732 CrossRef CAS.
- R. Si and M. Flytzani-stephanopoulos, Angew. Chem., Int. Ed., 2008, 47, 2884 CrossRef CAS.
- H. J. Li, G. S. Qi, T. Na, X. J. Zhang, W. Li and W. J. Shen, Catal. Sci. Technol., 2011, 1, 1677 CAS.
- D. Mckay, J. S. J. Hargreaves, J. L. Rico, J. L. Rivera and X. L. Sun, J. Solid State Chem., 2008, 181, 325 CrossRef CAS.
- A. P. Jones, Atmos. Environ., 1999, 33, 4535 CrossRef CAS.
- A. C. Gluhoi, N. Bogdanchikova and B. E. Nieuwenhuys, Catal. Today, 2006, 113, 178 CrossRef CAS.
- A. F. Lee, C. R. Seabourene and K. Wilson, Catal. Commun., 2006, 7, 566 CrossRef CAS.
- G. Litt and C. Almquist, Appl. Catal., B, 2009, 90, 10 CrossRef CAS.
- Q. Liu, L. C. Wang, M. Chen, Y. Cao, H. Y. He and K. N. Fan, J. Catal., 2009, 263, 104 CrossRef CAS.
- Y. S. Xia, H. X. Dai, H. Y. Jiang, J. G. Deng, H. He and C. T. Au, Environ. Sci. Technol., 2009, 43, 8355 CrossRef CAS.
- D. P. Singh, A. K. Ojha and O. N. Srivastava, J. Phys. Chem. C, 2009, 113, 3409 CAS.
- Y. Chang and H. C. Zeng, Cryst. Growth Des., 2004, 4, 397 CAS.
- X. Wang, G. Xi, S. Xiong, Y. Liu, B. Xi, W. Yu and Y. Qian, Cryst. Growth Des., 2007, 7, 930 CAS.
- M. Iwamoto, Y. Yoda, N. Yamazoe and T. Seiyama, J. Phys. Chem., 1978, 82, 2564 CrossRef CAS.
- L. Manassidis and M. J. Gillan, J. Am. Chem. Soc., 1994, 77, 335 Search PubMed.
- X.-G. Wang, W. Weiss, S. K. Shaikhutdinov, M. Ritter, M. Petersen, F. Wagner, R. Schloegl and M. Scheffler, Phys. Rev. Lett., 1998, 81, 1038 CrossRef CAS.
- C. Rebhein, N. M. Harrison and A. Wander, Phys. Rev. B: Condens. Matter, 1996, 54, 14066 CrossRef.
Footnote |
| † Electronic supplementary information (ESI) available: Experimental details; the details about how to calculate the values of the major crystal planes of different CuO nanostructures. See DOI: 10.1039/c2cy20168b |
| This journal is © The Royal Society of Chemistry 2012 |