Magnetoliposomes for controlled drug release in the presence of low-frequency magnetic field
Silvia
Nappini
a,
Francesca Baldelli
Bombelli
a,
Massimo
Bonini
a,
Bengt
Nordèn
*b and
Piero
Baglioni
*a
aDepartment of Chemistry, University of Florence and CSGI, Via della Lastruccia 3 - Sesto Fiorentino, 50019 Florence, Italy. E-mail: baglioni@csgi.unifi.it
bDepartment of Chemical and Biological Engineering/Physical Chemistry, Chalmers University of Technology, SE-41296 Gothenburg, Sweden. E-mail: norden@chalmers.se
First published on 16th November 2009
Abstract
In this work we have studied the effect of a low-frequency alternating magnetic field (LF-AMF) on the permeability of magnetoliposomes, i.e. liposomes including magnetic nanoparticles within their water pool. Large unilamellar liposomes loaded with magnetic cobalt ferrite nanoparticles (CoFe2O4) have been prepared and characterized. Structural characterization of the liposomal dispersion has been performed by dynamic light scattering (DLS). The enhancement of liposome permeability upon exposure to LF-AMF has been measured as the self-quenching decrease of a fluorescent hydrophilic molecule (carboxyfluorescein, CF) entrapped in the liposome pool. Liposome leakage has been monitored as a function of field frequency, time of exposure and concentration, charge and size of the embedded nanoparticles. The results show that CF release from magnetoliposomes is strongly promoted by LF-AMF, reasonably as a consequence of nanoparticle motions in the liposome pool at the applied frequency. CF release as a function of time in magnetoliposomes unexposed to magnetic field follows Fickian diffusion, while samples exposed to LF-AMF show zero-order kinetics, consistently with an anomalous transport, due to an alteration of the bilayer permeability. These preliminary results open up new perspectives in the use of these systems as carriers in targeted and controlled release of drugs.
Introduction
Since their discovery,1 lipid vesicles have attracted growing interest for their potential applications as drug delivery vectors. They are now considered clinically established nanometre-scaled systems for the delivery of cytotoxic drugs or agents for biomedical applications.2–6 What makes these carriers especially interesting is their biocompatibility, their adjustability in composition and size,7 the easy modification of surface properties8,9 and their ability in encapsulating both hydrophilic and hydrophobic molecules into their aqueous pool10 or within the bilayer,11 respectively. The surface modification has been exploited, for instance, to target tumor cells and release the therapeutics,12,13 while incorporation of organic dyes or quantum dots into their membrane allowed the visualization in in vivo and in vitro experiments.11,14One of the major features of a drug carrier is the release of the encapsulated drug selectively at the target site with an efficient rate.15 This can be obtained through the destabilization of the delivery system by an external stimulus, which can be of different nature depending on the carrier, followed by the release of the drug. In this framework, although trans-membrane diffusion of the embedded drug takes place spontaneously in liposomes, in many cases a controlled and complete release of the drug is a requirement.
Many factors have been shown to affect liposome permeability,16 such as a temperature increase especially when close to the lipid melting temperature (Tm),17 and the doping with large headgroup amphiphiles,18etc. In general, the permeability is correlated to the lateral compressibility19 consistently with the formation of defects and/or pores promoting the diffusion. Enhanced drug release has been achieved by using pH-sensitive lipids,20 by stimulating temperature-sensitive liposomes via local hyperthermia,15,21 and by mechanical disruption with low frequency ultrasounds.22,23 Another way to tune the permeability is the encapsulation of superparamagnetic nanoparticles (NPs) into the aqueous pool of liposomes and the modulation of the trans-membranal drug diffusion by applying an external alternating magnetic field (AMF).24 A number of investigations has been reported about the exploitation of superparamagnetic NPs in targeted and controlled release of drugs.25–27 In most cases the magnetic fluid hyperthermia (MFH) method is used: i.e. high-frequency magnetic field (HF-AMF), 50–400 kHz, is employed to promote local heating of the NPs, located in the targeted tumor cells, causing the thermal ablation of such cells without damaging the healthy tissues.21,28 When superparamagnetic nanoparticles are embedded in drug-containing matrix of different nature, the controlled drug release can also be promoted using low-frequency external magnetic field (LF-AMF), 0.1–5 kHz. In particular, Langer and coworkers have reported for the first time externally controlled drug release from polymer matrices by application of LF-AMF.29 Recently, this concept has been applied to achieve controlled drug release from magnetic nanocomposites of collagen,30 magnetic-sensitive ferrogels31 and polyelectrolyte microcapsules embedded with Co and Au nanoparticles.32 Lately, there has been increasing interest in using liposomes containing magnetic nanoparticles in their water pool, i.e. magnetoliposomes (MLs), for biomedical applications such as magnetic resonance imaging (MRI) contrast agents,33 activated drug release for hyperthermia by application of high-frequency oscillating magnetic field21,34,35 and fluorescence imaging when combined with fluorescent probes.10,36–38
For the first time, to the best of our knowledge, we report on externally controlled drug release from magnetoliposomes by means of LF-AMF, as sketched in Fig. 1.
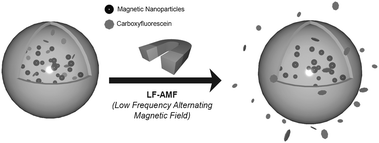 | ||
| Fig. 1 Sketch of CoFe2O4 nanoparticle-embedded liposomes containing carboxyfluorescein (CF) and subsequent CF release upon application of low frequency alternating magnetic field (LF-AMF). | ||
In this study, cobalt-ferrite nanoparticles (CoFe2O4) have been produced according to the method originally proposed by Massart39–41 (introducing minor modifications42,43) and were then used to load the pool of large unilamellar liposomes. Structural characterization of nanoparticles and magnetoliposomes has been performed by dynamic light scattering (DLS) and small angle scattering of X-rays (SAXS). Encapsulation-efficiency has been evaluated by inductively coupled plasma atomic emission spectrometry (ICP-AES) by monitoring the amount of iron and cobalt loaded into the liposomes. The enhancement of liposome permeability upon LF-AMF exposure has been measured as the self-quenching decrease of a fluorescent hydrophilic molecule (carboxyfluorescein, CF) entrapped in liposome pool. Liposome leakage has been monitored as a function of the field frequency, the exposure time and the concentration, charge, and size of the embedded nanoparticles.
Materials and methods
Materials
Iron(III) chloride hexahydrate (97%), cobalt(II) nitrate hexahydrate (98%), sodium hydroxide (minimum 98%), tetramethylammonium hydroxide 25 wt% solution in water (TMAOH), sodium chloride (minimum 99.5%), L-phosphatidylcholine from egg yolk, type XVI-E (∼99% TLC) lyophilized powder (PC), 5(6)-carboxyfluorescein (≫95% HPLC, CF), chloroform (99.9% HPLC grade), ethylenediaminetetraacetic acid (EDTA, 99.5%), TritonX-100 were purchased from Sigma-Aldrich. HEPES [4-(2-hydroxyethyl)piperazine-1-ethane-sulfonic acid] (ultra ≫99.5%), concentrated nitric acid (90%) were purchased from Fluka. Methanol (99.8%) was purchased from Panreac Quimica Sau and Sephadex G-25 Superfine from Pharmacia Fine Chemicals.Synthesis of cobalt-ferrite nanoparticles
Magnetic nanoparticles were prepared introducing minor modifications42,43 to Massart's method.39–41 Briefly, aqueous solutions of 1 M FeCl3 (64 ml) and Co(NO3)2 (32 ml) were added to concentrated nitric acid (2 ml). The mixture was heated to the boiling point and then, as fast as possible, mixed under vigorous agitation with 1 M NaOH solution (400 ml) and warmed up until boiling. The boiling temperature and stirring were maintained for 90 min. The particles obtained were separated by magnetic decantation, washed with water and added to 2 M HNO3 (40 ml). The precipitate was again separated by magnetic decantation, dispersed in a boiling solution obtained by dissolving 0.5 M FeCl3 (56 ml) and 0.5 M Co(NO3)2 (28 ml) and kept under vigorous agitation for 30 min. The precipitate obtained after this treatment was isolated and washed with water. To prepare larger nanoparticles the same synthetic procedure was used, but the Co(II), Fe(III), NaOH mixture was kept at the boiling temperature for 120 min. For negatively charged CoFe2O4 nanoparticles, the precipitate was dispersed in a 0.25 M TMAOH solution. For positively charged CoFe2O4 nanoparticles, the precipitate was washed with HNO3 1 M (30 ml) and then dispersed in water. The concentration of the nanoparticles was checked by thermogravimetric analysis (DTG) and eventually adjusted by diluting or concentrating by means of an ultrafiltration cell (Amicon, Millipore corporation) to obtain 5 wt% solid content.Liposome preparation
Magnetoliposomes, i.e. CoFe2O4 nanoparticle-embedded liposomes, were prepared by the lipid film hydration method, followed by sequential extrusion.24,33,38 Vesicles were prepared by evaporation of the solvent from a CHCl3–MeOH solution of the lipid; the dry lipid film was hydrated with a buffer solution of carboxyfluorescein (50 mM CF, 10 mM HEPES, 10 mM NaCl, 148 mM NaOH, 1 mM EDTA) and magnetic nanoparticles to give a lipid concentration of 20 mM. Control liposomes, without cobalt-ferrite NPs, have been prepared by adding CF in buffer to the dry lipid film. The suspensions were vortexed until complete dispersion of the film and then freeze-thawed six times. Multilamellar polydisperse vesicles were then sized down by repeated extrusion at room temperature through polycarbonate membrane (Whatman). Three steps of twenty-one extrusions through filters of 0.8 μm, 0.4 μm and 0.2 μm pore sizes allowed the preparation of a narrow sized distribution of unilamellar vesicles. Different liposomal preparations resulted in slightly different sizes with hydrodynamic radii ranging from 70 to 85 nm for liposomes and from 80 to 95 nm for magnetoliposomes, as inferred from QELS (quasi-elastic light scattering) experiments. The nanoparticles and the molecules of CF that were not entrapped inside the liposome pool were removed by gel exclusion chromatography (GEC) with Sephadex G-25 microcolumn (1 ml-syringe) saturated with lipids so that liposomes were recovered without dilution. Under these conditions, 300 μl of liposome dispersions were eluted and centrifuged at 2000g for two minutes without loss or dilution of material. Fractions of 0.2 ml were collected, investigated by DLS, and checked for their content. Nanoparticle and lipid concentrations were measured by inductively coupled plasma–atomic emission spectrometry (ICP-AES) and by the Steward-Marshall method, respectively, as described below.Inductively coupled plasma–atomic emission spectrometry (ICP-AES)
A VARIAN 720 OES inductively coupled plasma optical emission spectrometer (ICP-AES) was used for the determination of iron and cobalt content (ppm) inside magnetoliposomes before and after purification. The samples were diluted from 0.1 ml to 5.0 ml in 0.1% nitric acid. Calibration curves of standard solutions of iron and cobalt have been used. The ICP-AES was programmed to detect Co (238.892; 228.615; 230.786 nm) and Fe (238.204; 259.940; 234.350 nm) and to give the average value of the obtained results for each metal. An internal standard of Ge 5 ppm (209.426 nm) has been used to correct for matrix effects.Assay of phospholipids
Phospholipid content was determined by the Steward-Marshall method.44 This colorimetric method is based on the formation of a complex between phospholipid and ammonium ferrothiocyanate in chloroform. An aliquot of 7 μl of magnetoliposomes was mixed with 2 ml 0.1 M ammonium ferrothiocyanate (NH4SCN) in chloroform. After vortexing for 15 s, the sample was centrifuged for 5 min at 120 g. The red lower layer (chloroform) was removed with a Pasteur pipette and the absorbance was read in a Lambda 900 UV-vis spectrophotometer at 485 nm.Magnetic field generator
A sinusoidal adjustable magnetic field was generated in the gap of a broken ferrite ring carrying a solenoid through which an alternating electric current (AC) from a tone generator was led. The gaps of three different rings varied between 4 and 10 mm, producing magnetic fields up to 0.1 T and in the range 0.2–6 kHz. The solenoid had to be cooled by an air jet at the highest current (1 A).Dynamic light scattering (DLS)
DLS experiments were carried out on a Brookhaven Instrument apparatus, New York, USA (BI 9000AT correlator card and BI 200 SM goniometer). The signal was detected by an EMI 9863B/350 photomultiplier. The light source was the doubled frequency of a Coherent Innova diode pumped Nd–YAG laser, (λ = 532 nm, 20 mW), or alternatively a JDS Uniphase He–Ne (λ = 633 nm, 5 mW). The laser long term power stability was ±0.5%. Self-beating detection was recorded using decahydronaphthalene (thermostated by a water circulating system) as index matching liquid. A temperature probe was inserted in the sample while simultaneously recording autocorrelation functions. Measurements have been performed at 25 °C on 0.5 ml samples previously transferred into cylindrical Hellma scattering cells. For each sample at least three separate measurements were performed at the scattering angle θ = 90° corresponding to the scattering vector q = (4πn/λ)sin(θ/2); n is the refractive index of the medium equal to 1.33. Data analysis has been performed according to standard procedures, and interpreted through a cumulant expansion of the field autocorrelation function, arrested to the second order. Moreover, in order to obtain a distribution w(Γ) of decay rates, a constrained regularization method, CONTIN,45 was used to invert the experimental data. A statistical parameter “probability to reject”, R, is calculated for each w(Γ) generated by CONTIN. The preferred solution is usually the one characterized by the R value closest to 0.5.The translational diffusion coefficient, Dt, has been determined from the decay rates, Γ, through the relation Γ = Dt·q2 which is valid for diffusive modes. The diffusion coefficients provide access to the hydrodynamic correlation lengths RH for isotropic particles through the Stokes–Einstein relationship:
 | (1) |
Small angle X-ray scattering (SAXS)
SAXS measurements were carried out with a HECUS SWAX-camera (Kratky) equipped with a position-sensitive detector (OED 50 M) containing 1024 channels of width 54 μm. Cu Kα radiation of wavelength 1.542 Å has been obtained using a X-ray generator (Seifert ID-3003), operating at a maximum power of 2 kW. A 10 μm thick nickel filter was used to remove Cu Kα radiation. The volume between the sample and the detector was kept under vacuum (P < 1 mbar) during measurements to minimize scattering from air. The liquid samples were filled into 1 mm quartz capillary and then sealed. Measurements were done at 25 °C and temperature was controlled by a Peltier element, with an accuracy of ±0.1 °C. All scattering curves were corrected for the solvent contribution. The data were slit desmeared by a linear method.46In SAXS experiments, the measured intensity of the radiation, I(Q), scattered by a collection of uniform particles is given by:47
| I(Q) = A·ϕ·P(Q)·S(Q) + Ibkg | (2) |
Fluorescence monitoring of carboxyfluorescein release from liposomes
Steady-state fluorescence was measured with a LS50B spectrofluorimeter (Perkin Elmer, Italy). The emission fluorescence spectra of CF were recorded between 500 and 610 nm in the corrected spectrum mode with excitation wavelength set at 492 nm and 2.5 nm slit. At least 10 scans were averaged for each spectrum. Magnetoliposome and control solutions (diluted 1![[thin space (1/6-em)]](https://www.rsc.org/images/entities/char_2009.gif) :150 with the isotonic buffer) were measured, before and after LF-AMF exposure, at regular time intervals. The release behavior was checked as a function of the exposure time to LF-AMF and in time-drive modality by measuring the fluorescence intensity every 10 min during 15 h. The temperature upon LF-AMF exposure has been measured by means of a temperature probe. Fluorescence experiments were also performed on both magnetoliposomes and control liposomes kept at the highest temperature reached during the treatment for the same exposure time. All samples were diluted to the measurement concentration with a Triton X-100 solution to achieve complete release of CF through vesicles disruption. The release percentage was calculated from the fluorescence intensity as:
:150 with the isotonic buffer) were measured, before and after LF-AMF exposure, at regular time intervals. The release behavior was checked as a function of the exposure time to LF-AMF and in time-drive modality by measuring the fluorescence intensity every 10 min during 15 h. The temperature upon LF-AMF exposure has been measured by means of a temperature probe. Fluorescence experiments were also performed on both magnetoliposomes and control liposomes kept at the highest temperature reached during the treatment for the same exposure time. All samples were diluted to the measurement concentration with a Triton X-100 solution to achieve complete release of CF through vesicles disruption. The release percentage was calculated from the fluorescence intensity as: | (3) |
Results and discussion
Characterization of cobalt-ferrite nanoparticles
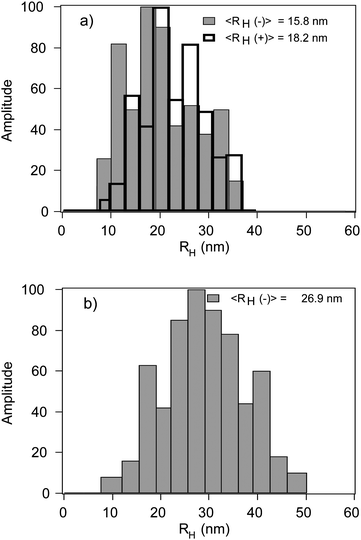
Positively and negatively charged cobalt-ferrite nanoparticle dispersions were characterized by SAXS and DLS. SAXS spectra of these solutions, corrected for the solvent, are reported in Fig. 2a and 2b.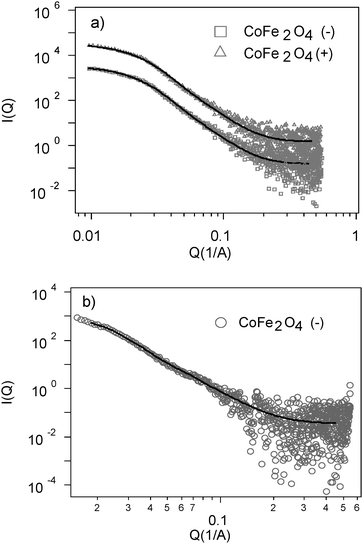 | ||
| Fig. 2 SAXS spectra (a) of small negative and positive cobalt-ferrite nanoparticles; (b) SAXS spectra of large negative cobalt-nanoparticles. | ||
SAXS spectra have been investigated through a model-fitting analysis where cobalt ferrite nanoparticles have been modeled as polydisperse spheres of constant scattering length (see Materials and methods section). The best fittings are reported in Fig. 2a as solid lines. The estimated average radius <R> and the polydispersity are reported in Table 1. The system is affected by a considerable polydispersity, consistent with what has observed for similar magnetic nanoparticles.52
| Small CoFe2O4 (−) | Small CoFe2O4 (+) | Large CoFe2O4 (−) | |
|---|---|---|---|
| SAXS Fitting | |||
| A*ϕ | 0.0125 ± 0. 0002 | 0.0123 ± 0.0001 | 1) 0.0105 ± 0.0010 |
| 2) 0.0013 ± 0.0003 | |||
| <R> [nm] | 5.7 ± 0.2 | 5.9 ± 0.2 | 1) 23.4 ± 1.0 |
| 2) 8.3 ± 2.7 | |||
| Polydispersity | 0.44 ± 0.02 | 0.42 ± 0.01 | (1) 0.21 ± 0.01 |
| (2) 0.20 ± 0.04 | |||
| Cumulant analysis | |||
| RH[nm] | 14.1 ± 1.0 | 17.9 ± 1.2 | 27.6 ± 1.4 |
| Polydispersity | 0.20 | 0.21 | 0.19 |
| CONTIN | |||
| <RH> [nm] | 15.8 ± 0.5 | 18.2 ± 0.5 | 26.9 ± 1.3 |
In Fig. 2b SAXS spectrum from larger CoFe2O4 nanoparticles is reported; the solid curve represents the best fitting results. For this sample it was not possible to fit the curve as a single population of particles; a bimodal function has been used where each population is modeled as polydisperse spheres of radius R with a Schulz distribution of the radii49–51 (Table 1). Spheres of about 23 nm in radius are the most represented population, while an averaged radius of 8 nm characterizes the second one.
The same samples have been investigated by DLS (Fig. 3) and the autocorrelation functions are well fitted with cumulant analysis. The obtained hydrodynamic radii, RH, (eqn (1)) and polydispersity values are reported in Table 1. The RH values of the nanoparticles are larger than the mean radii estimated by SAXS analysis: in fact, the objects diffusing in the aqueous solution are composed by the oxide cores together with their hydration layers, which weakly contribute to the scattering intensities in SAXS experiments.
 | ||
| Fig. 3 (a) Size distributions of small negative and positive cobalt-ferrite nanoparticles; (b) Size distribution of large negative cobalt-ferrite nanoparticles. | ||
Characterization of magnetoliposomes
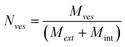
Table 2 summarizes the main features of the magnetoliposome dispersions investigated in this work. We have estimated the encapsulation efficiency for each sample as the ratio of CoFe2O4 concentration before and after GEC purification. Moreover, an estimate of the mean number of magnetic nanoparticles per liposome, <N>, has been calculated as the ratio of the number of nanoparticles (NNPs) and lipid vesicles (Nves), <N> = NNPs/Nves, where NNPs and Nves have been obtained from their corresponding size and concentration through the following equations: | (4a) |
 | (4b) |
 with 0.589 nm3 unit cell volume of CoFe2O4, Mves is the total number of lipid molecules and Mext and Mint are the lipid molecules in the external and internal leaflet per vesicle, respectively.
| MLs | Chargea | [NPs]/mg L−1b | <R>/nmc | <RH>/nmd | Encapsulation percentagee | <N>f |
|---|---|---|---|---|---|---|
| a Nanoparticle charge. b CoFe2O4 concentration by ICP-AES after GEC purification. c Average radius of nanoparticles by SAXS analysis. d Average hydrodynamic radius of MLs from DLS by CONTIN analysis. e {[CoFe2O4]after GEC/[CoFe2O4]before GEC}×100. f Mean number of nanoparticles for liposome. | ||||||
| A | (−) | 9 ± 0.1 | 5.7 ± 0.2 | 84.2 ± 0.7 | 9.5 | 0.4 |
| B | (−) | 37 ± 0.4 | 5.7 ± 0.2 | 84.5 ± 0.9 | 7.4 | 1.5 |
| C | (−) | 60 ± 0.6 | 5.7 ± 0.2 | 86.7 ± 1.0 | 6.3 | 2.5 |
| D | (−) | 194 ± 2.0 | 5.7 ± 0.2 | 90.2 ± 1.2 | 6.2 | 8.6 |
| E | (−) | 162 ± 1.6 | 23.4 ± 1.0 | 92.0 ± 1.0 | 16.2 | 0.2 |
| F | (+) | 58 ± 0.6 | 5.9 ± 0.2 | 87.9 ± 1.0 | 6.8 | 2.6 |
It is important to note that this calculation is based on the assumption that NPs are homogeneously distributed over the water-pools of the liposomes. Nevertheless, we can safely assume that the values obtained give a meaningful indication of the total amount of loaded NPs. Generally, the loading is less effective as compared to what was obtained previously for citrate-coated ferrite nanoparticles embedded in lipid vesicles.33 This is likely due to the higher stability of citrate-coated nanoparticles in a buffer medium. The choice of naked nanoparticles was dictated by their higher magnetic response upon LF-AMF with respect to the coated ones, most likely due to cooperative effects in NP aggregates. In our case, <N> gradually increases as a function of the initial concentration of ferrofluid, while encapsulation efficiency decreases with the initial concentration of magnetic fluid up to an invariant value of about 6.3% above 60 mg L−1. (see Table 2) We are currently investigating magnetic nanoparticles with different surface coatings. In fact, the coating stabilization should significantly improve the loading efficiency, without dramatically reducing the response upon AMF. This study could disclose possible differences in their AMF mediated release connected to the formation of aggregates for the naked CoFeO4 NPs.
Most experiments have been performed on magnetoliposomes containing negatively charged CoFe2O4 nanoparticles of <R> = 5.6 nm with 60 mg L−1 concentration. This sample is labeled as C in Table 2. Magnetoliposomes and liposomes without embedded nanoparticles (blank sample) were characterized by DLS. The autocorrelation functions were well fitted with cumulant analysis and the obtained hydrodynamic radii, RH, are ranging between 70–85 nm and 85–95 nm for liposomes and magnetoliposomes, respectively. For all the investigated samples, the distribution of relaxation time gives a single population (monomodal distribution), with polydispersity ranging from 0.07 to 0.18 for different batches.
The size distributions extracted from CONTIN analysis are reported in Fig. 4 and show that magnetoliposome samples are constituted by a single population centered on the RH values obtained by cumulant analysis. Nanoparticle contribution to the overall scattering intensity, due to their low concentration and small size, is probably completely hidden by liposomes scattering.
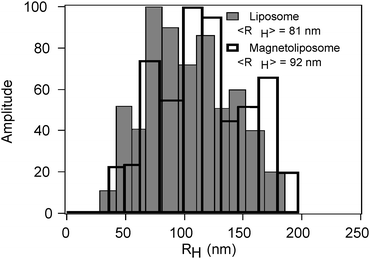 | ||
| Fig. 4 Representative size distributions of liposomes (grey bars) and magnetoliposomes (black bars) obtained by CONTIN analysis of the autocorrelation functions. | ||
Release of magnetoliposomes in the presence of LF-AMF
Magnetoliposomes (C sample reported in Table 2) and blank samples, as described before, were loaded with CF.The release of CF, monitored as the increase of fluorescence emission, has been measured as a function of the field frequency (0.2 kHz, 2.84 kHz and 5.82 kHz), the time of exposure (from 10 to 50 min) and the concentration, charge and size of the loaded magnetic nanoparticles. Magnetoliposomes show a significant increase in their permeability upon LF-AMF application for exposure time longer than 10 min. i.e. about 20% and 40% increase in the release after 20 and 50 min of treatment, respectively.
The results, reported in Fig. 5a, show that longer exposure times lead to higher release. Blank samples at the highest exposure time and field frequency, where the highest release was observed, are also reported as empty circles. This trend is followed during 10 h; for longer times the release difference levels off and after one day all treated samples show similar release percentage. The comparison between the control samples and those subjected to LF-AMF shows that the release is significantly higher for the last ones.
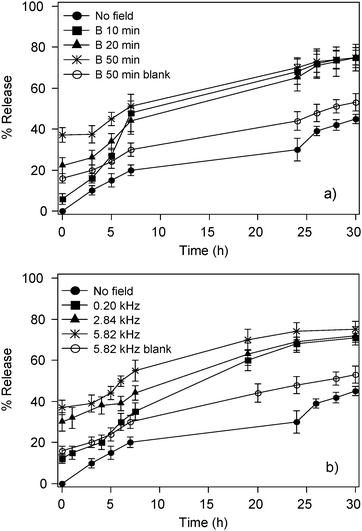 | ||
| Fig. 5 Release of CF-loaded magnetoliposomes (sample C in Table 2) and CF-loaded liposomes without NPs (blank) in the presence of LF-AMF as a function of (a) exposure time at 5.82 kHz and (b) of field frequency for 50 min of treatment. | ||
The results suggest that CF release under the oscillating magnetic field is related to the presence of magnetic nanoparticles, possibly as a consequence of their flipping and shaking in the liposome pool due to the applied frequency. This process affects the bilayer permeability, promoting CF release, without rupture of the vesicles. This was confirmed by DLS analysis that shows no significant changes in the total scattered intensity and in the evaluated size distributions (data not shown).
The same behavior is observed as a function of the field frequency: an higher release is obtained at higher frequencies, and the differences level off above 2.8 kHz. This behavior differs from what reported by Lu et al. that have studied the permeability of polyelectrolyte microcapsules loaded with Co and Au nanoparticles as a function of field frequencies.32 They reported an increase on the release of the polyelectrolyte microcapsules when decreasing the field frequency below 0.3 kHz; above this value the release levels off. The observed release dependence from the field frequency of our magnetoliposomes likely depends on the different particle response to magnetic field and to the different particle hosts (liposomes). Nevertheless, we can only give a speculative explanation for this dependency. In our hypothesis, an increase in the frequency enhances the permeability of the membrane because of the crowding of NPs in specific regions of the water pool. In fact, due to magnetic field gradients, the NPs are moved next to the liposome bilayer according to the magnetic field lines. Once the NPs reach the bilayer, they induce the motion of the whole magnetoliposome, until the field is reversed. Due to these “shaking” motions, we expect the permeability of the bilayer to be affected. An increased frequency corresponds therefore to an increase in the number of cycles in which the bilayer is stressed, explaining the higher release at higher frequency. Further experiments are in progress to verify the correctness of this hypothesis.
Upon exposure to the LF-AMF both magnetoliposomes and control liposomes have shown a very similar increase of temperature due to the coils' heat dissipation. Hence, control experiments on both systems, incubated at the highest temperature produced by the oscillating field for the total exposure time, have been performed to take into account the temperature contribution. Magnetoliposomes are slightly more sensitive to temperature increase than control liposomes, but the overall increase is never higher than 20% as clearly shown in Fig. 6a and b. Therefore, we can state that temperature weakly affects the CF release and the enhancement found in the release upon the application of a LF-AMF is genuine.
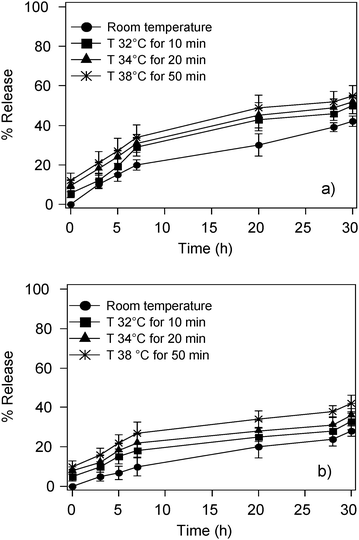 | ||
| Fig. 6 Release curves of (a) CF-loaded magnetoliposomes (sample C in Table 2) and (b) control liposomes incubated at higher temperature as specified in the figure legend. | ||
In Fig. 7, release curves of magnetoliposomes at different CoFe2O4 loading are reported (Table 2). High loadings are more effective in the release, even if the increase levels off for particle concentrations above 37 mg L−1. Although we are not able to obtain high encapsulation efficiency, LF-AMF treatment induces immediate CF release showing that low frequency alternating magnetic fields are very effective in promoting the release.
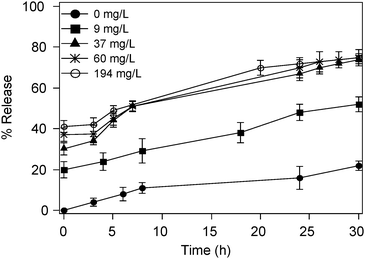 | ||
| Fig. 7 Release curves of CF-loaded magnetoliposomes at different CoFe2O4 content. The characteristics of these samples are reported in Table 2 where they are labeled as A,B,C, D, respectively. | ||
We have encapsulated both negatively and positively charged nanoparticles to highlight possible interactions with liposome membrane that could enhance or inhibit the effect to LF-AMF exposure. Release curves have shown that negatively charged nanoparticles are more effective in the same conditions (Fig. 8a), consistently with suggesting the presence of stronger interaction between the trimethylammonium groups of the phosphatidylcholine and negatively charged NPs. The release is also enhanced by using larger nanoparticles (Fig. 8b). This can be explained by two separate effects. In the framework of the hypothesis we introduced when discussing the effect of the field frequency, bigger nanoparticles show a stronger response to the magnetic field, producing then bigger pores when magnetically collected next to the bilayer. Bigger NPs are also expected to generate more defects when exposed to oscillating magnetic fields, both due to their hindrance and to the heat they can produce.
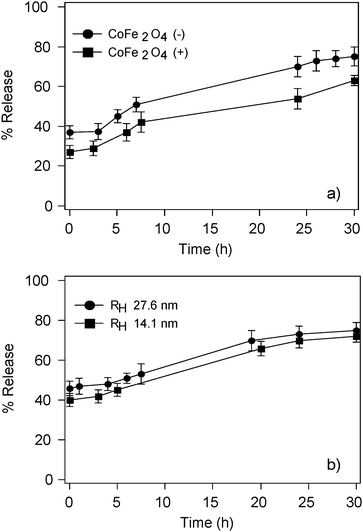 | ||
| Fig. 8 Release curves of CF-loaded magnetoliposomes after LF-AMF exposure at 5.82 kHz for 50 min as a function of (a) nanoparticle surface overall charge and (b) nanoparticle size. | ||
Drug release kinetics
Release studies as a function of time pointed out different release kinetics for magnetoliposomes upon LF-AMF with respect to untreated samples. Temporal dependence of CF fluorescence intensity has been detected for two samples of magnetoliposomes containing small CoFe2O4 and large CoFe2O4 NPs, respectively. CF release has been evaluated for untreated magnetoliposomes and upon LF-AMF exposure as well as for heated samples to take into account a possible temperature contribution. The fluorescence readings were normalized to the maximum fluorescence intensity of the solution by disrupting the liposomes with TRITON-X. Experimental data are reported in Fig. 9a and b. It is clear that magnetoliposome release curves upon LF-AMF exposure have a different trend with respect to control samples. Moreover, magnetoliposomes containing larger nanoparticles (Fig. 9b) are less stable since untreated samples show higher temporal fluorescence emission increase with respect to the analog sample containing smaller nanoparticles. We speculate that larger nanoparticles encapsulated in the liposome pool partially destabilize the membrane even without field exposure, inducing pores and/or defects that promote the release of CF molecules.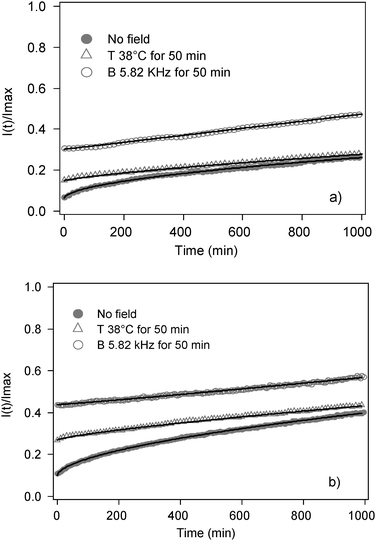 | ||
| Fig. 9 Release curves of CF-loaded (a) small CoFe2O4 NPs-embedded magnetoliposomes (sample C Table 2) and (b) large CoFe2O4 NPs-embedded magnetoliposomes (sample E Table 2) in time drive mode. (●) Untreated samples, (△)incubated at 38 °C for 50 min, (○) samples subjected to LF-AFM for 50 min at a frequency of 5.82 kHz. Solid curves are the best fitting obtained by means of eqn (5). | ||
In order to better understand the CF transport mechanism,53,54 the experimental data were fitted using the Ritger–Peppas equation, a semi-empirical formula based on a power-law dependency. This equation has been extensively used to analyze the release behavior of various drug delivery systems, namely hydrogels and microcapsules during the first 60% of the release curves. The Ritger–Peppas equation can be written as:
 | (5) |
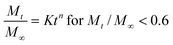
Kinetics parameters obtained from the analysis of the curves with eqn (5) for Mt/M∞ < 0.6 are reported in Table 3. Untreated samples are well fitted by eqn (5) for n equal to 0.55–0.57 ± 0.01 indicating that the dominant drug release mechanism is due to Fickian diffusion. The fit for samples incubated at 38 °C gives n = 0.76–0.77 ± 0.01 indicating the presence of anomalous transport, that is the combination of Fickian diffusion and initial membrane destabilization. The results obtained for magnetoliposomes exposed to LF-AMF indicate zero-order kinetics, confirming that the transport is dominant on the Fickian process. More likely, nanoparticle motions induce an alteration of the bilayer structure enhancing the CF release.
| Small CoFe2O4 NPs-loaded magnetoliposomes | Large CoFe2O4 NPs-loaded magnetoliposomes | |
|---|---|---|
| No field | ||
| n | 0.55 ± 0.01 | 0.57 ± 0.01 |
| K | 4.75 × 10⁻³ ± 0.15 × 10⁻³ | 5.94 × 10⁻³ ± 0.18 × 10⁻³ |
| T = 38 °C for 50 min | ||
| n | 0.76 ± 0.01 | 0.77 ± 0.01 |
| K | 7.02 × 10⁻⁴ ± 0.31 × 10⁻⁴ | 7.73 × 10⁻⁴ ± 0.07 × 10⁻⁴ |
| LF-AFM 5.82 kHz for 50 min | ||
| n | 1.01 ± 0.02 | 1.09 ± 0.02 |
| K | 1.58 × 10⁻⁴ ± 0.18 × 10⁻⁴ | 7.14 × 10⁻⁵ ± 0.93 × 10⁻⁵ |
In addition, K values decrease in passing from Fickian diffusion to zero-order release. Indeed, the rate of release is higher at the beginning, when most of the carboxyfluorescein is inside liposomes and diffuses out by concentration gradient. Upon contact with external water, carboxyfluorescein diffuses due to a concentration difference at the interface and the release is controlled by Fickian diffusion through the lipid bilayer. The fact that the kinetics follows a zero-order and it is slower in AMF treated samples is explained when considering that the main part of the release has already taken place when the fluorescence experiment is started. In fact, during the application of the oscillating magnetic field, a considerable amount of CF is released (significantly higher than in absence of magnetic field), meaning that in AMF treated samples the fluorescence experiment reflects only the slower part of the release.
Conclusions
Magnetic CoFe2O4 nanoparticles have been successfully embedded in 200 nm sized liposomes to form the so-called magnetoliposomes. We have studied the effect of a low-frequency alternating magnetic field (LF-AMF) on the permeability of these systems. Carboxyfluorescein was incorporated into the liposome pool to follow CF release upon LF-AMF treatment. Magnetoliposomes’ response to LF-AMF exposure was effective in term of CF release. Long LF-AMF exposure time, high field frequency and large nanoparticles are the most effective in fast and high CF release, but after one day all samples reach nearly the same plateau value. Drug release behavior in magnetoliposomes exposed to LF-AMF showed zero-order kinetics, confirming that the so called anomalous transport predicted by the Ritger and Peppas equation is dominant on the Fickian (diffusive) process for this system. This indicates that nanoparticle motions under LF-AMF effectively affect the bilayer structure promoting CF release, and support that the release is not simply due to a difference of CF concentration across the liposome membrane. Even though more investigations are necessary to fully unravel the release process, the results reported in this paper already suggest that the use of magnetoliposomes in LF-AMF for targeted and externally controlled release of drugs represent a real advancement in the field.Acknowledgements
Financial support from CSGI, MIUR-PRIN 2006 and the European Commission's Sixth Framework Program (Project Reference AMNA, Contract No 013575) are acknowledged. We thank Professor R. Udisti and F. Rugi for ICP-AES experiments.B. N. acknowledges a King Abdullah University of Science and Technology Award making this project possible. Dr. Tore Eriksson is acknowledged for building the alternating magnetic field generator.
References
- A. D. Bagham, R. Flemans, D. H. Heard and G. V. F. Seaman, Nature, 1958, 182, 682.
- D. D. Lasic, Trends Biotechnol., 1998, 16, 307 CrossRef CAS.
- T. M. Allen and P. R. Cullis, Science, 2004, 303, 1818 CrossRef CAS.
- Y. Barenholz, Curr. Opin. Colloid Interface Sci., 2001, 6, 66 CrossRef CAS.
- M. C. Woodle, Adv. Drug Delivery Rev., 1995, 16, 249 CrossRef CAS.
- V. P. Torchilin, Nat. Rev. Drug Discovery, 2005, 4, 145 CrossRef CAS.
- G. J. Charrois and T. M. Allen, Biochim. Biophys. Acta, Biomembr., 2003, 1609, 102 CrossRef CAS.
- T. M. Allen and A. Chonn, FEBS Lett., 1987, 223, 42 CrossRef CAS.
- H. Takeuchi, H. Kojima, H. Yamamoto and Y. Kawashima, J. Controlled Release, 2001, 75, 83 CrossRef CAS.
- W. T. Al-Jamal, K. T. Al-Jamal, P. H. Bomans, P. M. Frederik and K. Kostarelos, Small, 2008, 4, 1406 CrossRef CAS.
- J. A. Kloepfer, N. Cohen and J. L. Nadeau, J. Phys. Chem. B, 2004, 108, 17042 CrossRef.
- J. N. Weinstein, R. L. Magin, L. Yatvin and D. S. Zaharko, Science, 1979, 204, 188 CrossRef CAS.
- D. C. Drummond, O. Meyer, K. Hong, D. B. Kirpotin and B. Papahadjopoulos, Pharmacol. Rev., 1999, 51, 691 CAS.
- K. C. Weng, C. O. Noble, B. Papahadjopoulos-Sternberg, F. F. Chen, D. C. Drummond, D. B. Kirpotin, D. Wang, Y. K. Hom, B. Hann and J. W. Park, Nano Lett., 2008, 8, 2851 CrossRef CAS.
- D. Needham and M. W. Dewhirstb, Adv. Drug Delivery Rev., 2001, 53, 285 CrossRef CAS.
- D. Exerowa, D. Kaschiev and D. Platikanov, Adv. Colloid Interface Sci., 1992, 40, 201 CrossRef CAS.
- D. Marsh, A. Watts and P. F. Knowles, Biochemistry, 1976, 15, 3570 CrossRef CAS.
- D. Papahadjopoulos, K. Jacobson, S. Nir and T. Isac, Biochim. Biophys. Acta, Biomembr., 1973, 311, 330 CrossRef CAS.
- J. F. Nagle and H. L. Scott Jr., Biochim. Biophys. Acta, Biomembr., 1978, 513, 236 CrossRef CAS.
- J. K. Mills, N. Eichenbaum, N. Case and D. Needham, J. Liposome Res., 1999, 9, 275 CrossRef CAS.
- M. Babincová, P. Čičmanec, V. Altanerová, Č. Altaner and P. Babinec, Bioelectrochemistry, 2002, 55, 17 CrossRef CAS.
- H.-Y. Lin and J. L. Thomas, Langmuir, 2003, 19, 1098 CrossRef CAS.
- A. Schroeder, Y. Avnir, S. Weisman, Y. Najajreh, A. Gabizon, Y. Talmon, J. Kost and Y. Barenholz, Langmuir, 2007, 23, 4019 CrossRef CAS.
- S. Lesieur, C. Grabielle-Madelmont, C. Menager, V. Cabuil, D. Dadhi, P. Pierrot and K. Edwards, J. Am. Chem. Soc., 2003, 125, 5266 CrossRef.
- M.-H. Hsu and Y.-C. Su, Biomed. Microdevices, 2008, 10, 785 CrossRef CAS.
- S.-H. Hu, T.-H. Liu, H.-Y. Huang, D.-M. Liu and S.-Y. Chen, Langmuir, 2008, 24, 239 CrossRef CAS.
- N. Kohler, C. Sun, J. Wang and M. Zhang, Langmuir, 2005, 21, 8858 CrossRef CAS.
- R. E. Rosensweig, J. Magn. Magn. Mater., 2002, 252, 370 CrossRef CAS.
- J. Kost, J. Wolfrum and R. Langer, J. Biomed. Mater. Res., 1987, 21, 1367 CrossRef CAS.
- V. M. De Paoli, S. H. De Paoli Lacerda, L. Spinu, B. Ingber, Z. Rosenzweig and N. Rosenzweig, Langmuir, 2006, 22, 5894 CrossRef.
- T.-H. Liu, S.-H. Hu, K.-H. Liu, D.-M. Liu and S.-Y. Chen, J. Controlled Release, 2008, 126, 228 CrossRef CAS.
- Z. Lu, M.-D. Prouty, Z. Guo, V. O. Golub, C. S. S. R. Kumar and Y. M. Lvov, Langmuir, 2005, 21, 2042 CrossRef CAS.
- M.-S. Martina, J.-P. Fortin, C. Menager, O. Clement, G. Barratt, C. Grabielle-MAdelmont, F. Gazeau, V. Cabuil and S. Lesieur, J. Am. Chem. Soc., 2005, 127, 10676 CrossRef CAS.
- E. Viroonchatapan, H. Sato, M. Ueno, I. Adachi, K. Tazawa and I. Horikoshi, J. Controlled Release, 1997, 46, 263 CrossRef CAS.
- A. Ito, Y. Kuga, H. Honda, H. Kikkawa, A. Horiuschi, Y. Watanabe and T. Kobayashi, Cancer Lett., 2004, 212, 167 CrossRef CAS.
- F. Bertorelle, C. Wihelm, J. Roger, F. Gazeau, C. Menager and V. Cabuil, Langmuir, 2006, 22, 5385 CrossRef CAS.
- G. Beaune, C. Menager and V. Cabuil, J. Phys. Chem. B, 2008, 112, 7424 CrossRef CAS.
- R. Sabate, R. Barnadas-Rodriguez, J. Callejas-Fernandez, R. Hidalgo-Alvarez and J. Estelrich, Int. J. Pharm., 2008, 347, 156 CrossRef CAS.
- C. R. Massart, US Patent 4 329 241, 1982.
- C. R. Massart, IEEE Trans. Magn., 1981, 17, 1247 CrossRef.
- C. R. Massart, Acad. Sci. Ser. C, 1980, 291, 1 Search PubMed.
- M. Bonini, A. Wiedenmann and P. Baglioni, Phys. A, 2004, 339, 86 CrossRef CAS.
- M. Bonini, A. Wiedenmann and P. Baglioni, J. Phys. Chem. B, 2004, 108, 14901 CrossRef CAS.
- J. C. Steward-Marshall, Anal. Biochem., 1980, 10.
- S. W. Provencher, Comput. Phys. Commun., 1982, 27, 213 CrossRef.
- M. A. Singh, S. S. Ghosh and R. F. Shannon, J. Appl. Crystallogr., 1993, 26, 787 CrossRef CAS.
- S. H. Chen and J. Teixeira, Phys. Rev. Lett., 1986, 57, 2583 CrossRef CAS.
- M. Kotlarchyk and S.-H. Chen, J. Chem. Phys., 1983, 79, 2461 CrossRef CAS.
- G. V. Schulz, J. Phys. Chem., 1935, 43, 25.
- J. B. Hayter and J. Penfold, Mol. Phys., 1981, 42, 109 CAS.
- A. Guinier and G. Fournet, Small Angle X-rays Scattering, Wiley, New York, 1955 Search PubMed.
- M. Bonini, A. Wiedenmann and P. Baglioni, J. Appl. Crystallogr., 2007, 40, s254 CrossRef CAS.
- D. Y. Arifin, L. Y. Lee and C.-H. Wang, Adv. Drug Delivery Rev., 2006, 58, 1274 CrossRef CAS.
- J. Serra, J. Doménech and N. A. Peppas, Biomaterials, 2006, 27, 5440 CrossRef.
- P. L. Ritger and N. A. P, J. Controlled Release, 1987, 5, 23 CrossRef CAS.
| This journal is © The Royal Society of Chemistry 2010 |