Interfacial tension between a complex coacervate phase and its coexisting aqueous phase
Evan
Spruijt
*,
Joris
Sprakel
,
Martien A.
Cohen Stuart
and
Jasper
van der Gucht
Laboratory of Physical Chemistry and Colloid Science, Wageningen University, Dreijenplein 6, 6703 HB, Wageningen, The Netherlands. E-mail: evan.spruijt@wur.nl
First published on 15th October 2009
Abstract
Complex coacervation is the associative phase separation in a solution of positively and negatively charged macroions. Despite the widespread use of coacervation in e.g. micellar assemblies (complex coacervate core micelles), drug carriers and thin films, there is virtually no experimental data on the interfacial tension between such coacervate phases (polyelectrolyte complexes) and their coexisting aqueous phases or on the influence of salt thereon. In this paper we use colloidal probe AFM measurements of capillary adhesion forces to obtain the interfacial tension between a complex coacervate phase of two polyelectrolytes with high charge density and its coexisting aqueous phase. We find that the interfacial tension is of order 100 µN/m, decreases with increasing salt concentration and vanishes at the critical point. Interestingly, we find that the critical scaling exponent for the interfacial tension found in segregative demixing also applies here.
1 Introduction
Complex coacervation is the associative phase separation in a solution of positively and negatively charged macroions, such as polyelectrolytes.1 Generally, two phases are formed: one polymer-rich phase (the coacervate or polyelectrolyte complex), which can still be liquid-like, and one very dilute phase. The interfacial tension between these two phases is an important factor that is directly related to the interaction between the macroions. In all potential applications of coacervate phases, such as drug carriers,2–4 fat replacers or meat analogues,5,6 coatings and packaging materials,7 knowledge of the interfacial tension is essential in making predictions about the prerequisites and practical applicability of such systems. In complex coacervate core micelles for example,8,9 the interfacial tension is related to the driving force of micelle formation, and it can thus be used to predict the critical aggregation concentration.10 In microdroplets of a complex coacervate phase, the interfacial tension determines the relative importance of interfacial forces over viscous forces and it can thus be used to predict flow properties. Finally, De Ruiter and Bungenberg-de Jong already pointed out the strong similarities between complex coacervate phases and both the cell membrane and the bacterial nucleoid.11Despite the crucial role of the interfacial tension in the determination of interactions, interface stability and flow properties, there is no experimentally verified theoretical argument nor a systematic study on the interfacial tension between a complex coacervate phase and its surrounding equilibrium aqueous phase. Kramarenko et al. present an indirect expression for the interfacial tension of a polyelectrolyte complex that is difficult to compare to experimental data.12 Their calculations reveal that the aggregation number of a polyelectrolyte complex decreases with increasing salt concentration, as a result of a decreasing interfacial tension. Experimentally, many qualitative studies on complex coacervation also indicate that the coacervation transition and the interfacial tension are highly sensitive to added salt.13,14 Most of these studies concern complex coacervates of arabic gum and gelatin or whey protein, which all have a very low charge density. The only quantitative report of an interfacial tension between a polyelectrolyte complex phase and its equilibrium aqueous phase was made by De Ruiter and Bungenberg-de Jong.11 They used the method of capillary rise to measure the interfacial tension at varying compositions and at three salt concentrations. They reported very low values for the interfacial tension at three different salt concentrations (∼1 µN/m) with a maximum at equimolar composition and the highest salt concentration. However, they also indicated that the results they obtained were inaccurate and unsatisfactory, for several reasons: (i) the method relies on optical contrast between the phases, while the interface is usually wide and visible only as a diffuse band; (ii) the system is very sensitive to pH, because of ionizable groups on both polymers, and the silanol groups of the capillary wall can cause significantly different local pH values; (iii) for measurement of ultralow interfacial tensions the capillaries need to be very narrow, leading to frequent obstruction by small particles or aggregates.
In this paper we present accurate measurements of the interfacial tension between a complex coacervate and its coexisting aqueous phase for the general case of two polyelectrolytes with a high charge density. Our data indicate that the interfacial tension is significantly higher than for the biopolymers with very low charge density that have been used extensively in the study on coacervate phases.11 Furthermore, we show that salt has a strong effect on the interfacial tension. On the one hand we find a critical point at high salt concentration, near which the interfacial tension approaches zero. On the other hand we find slow kinetics of the phase separation and strong hysteresis in our measurements at low salt concentrations, which we ascribe to a highly asymmetric composition of the coexisting phases. In our analysis of the influence of salt on the interfacial tension we find a critical scaling of the interfacial tension with the salt concentration that is similar to the scaling found for segregative demixing. We rationalize this using the mean-field theory of complex coacervation. Such a prediction about the interfacial tension of complex coacervate phases in equilibrium with their dilute phases has not been made before and we believe it is important for the use of coacervates in the above mentioned applications.
In our measurements of the interfacial tension, we make use of colloidal probe atomic force microscopy (CP-AFM) to measure the forces associated with a capillary bridge between a flat surface and a spherical colloidal probe. CP-AFM was introduced independently by Ducker et al.15 and Butt16 and it was first used to measure ultra-low interfacial tensions by Sprakel et al.17 In contrast to other techniques to measure low interfacial tensions such as the spinning drop method, this method does not use strong external fields. Moreover, this method can be applied without problems in any liquid–liquid system, because it does not require an optical contrast or a density difference between the two phases. Because of these requirements we expect the spinning drop method to be not applicable to coacervate systems close to their critical point. For another liquid–liquid system, gelatin-dextran, it has been shown by Sprakel et al. that both methods give identical results for the interfacial tension.18 Our CP-AFM method does not require optical contrasts or density differences, because the method is based on the principle of capillary condensation. In a system that is almost saturated with one component, a capillary bridge consisting of a condensed phase of this component can form spontaneously between two surfaces if the condensed phase wets the surfaces, as is shown schematically in Fig. 1. This phenomenon causes, for example, the adhesion between sand grains in humid air, which makes the sand stick together such that it can be shaped. If the component is a nonwetting phase for the surfaces the analogous capillary evaporation, also known as cavitation, can take place. In both cases there is an attractive force between the surfaces, which can be measured by AFM if one of the two surfaces is connected to a cantilever.17 In this paper we will show that this method can be applied to complex coacervate systems and we believe it is applicable to a wide range of phase separating systems, with either a segregative or an associative origin.
 | ||
| Fig. 1 Artist impression of a capillary bridge formed by a complex coacervate phase. | ||
2 Experimental
2.1 Materials
METAC (2-(methacryloyloxy)-ethyl-trimethyl-ammonium chloride), KSPM (potassium salt of 3-sulfopropylmethacrylate), 2,2′-dipyridyl (ligand), CuCl2, CuCl, ethylbromoisobutyrate (initiator), 2-propanol, methanol and KCl were purchased from Aldrich. Inhibitor was removed from the METAC solution by running it through a neutral alumina column. All other chemicals were used as received. De-ionized water with a resistance of 18.2 MΩ cm was used. Triangular AFM contact-mode cantilevers with a spring constant of 0.06–0.12 N/m were purchased from Veeco. Silica probes (R = 3 µm) were a gift from Philips Laboratories. They were glued to the tip of a cantilever using an epoxy glue. Flat silicon wafers were purchased from WaferNet. Both flat silicon surfaces and silica probes were cleaned by rinsing with water and ethanol, drying under a stream of N2 and plasma treatment for 2 minutes. The probes and wafers were then left in water until they were used in experiments. After plasma treatment the flat silicon wafers have a 3 nm thick oxidized layer of silica at the surface, as determined by ellipsometry.2.2 Polyelectrolyte synthesis
The coacervate phases that are studied here are formed by two strong polyelectrolytes in aqueous solutions. The positively charged polymer is poly(2-(methacryloyloxy)-ethyl-trimethyl-ammonium chloride) (PMETAC), also known as poly(trimethyl-aminoethyl methacrylate) (PTMAEMA or MADQUAT); the negatively charged polymer is poly(3-sulfopropyl methacrylate) (PSPM). Both polyelectrolytes are synthesized by atom transfer radical polymerization (ATRP) on a gram scale.For the synthesis of PMETAC 5.5 g METAC, 150 mg 2,2′-dipyridyl (ligand) and 5 mg CuCl2 are dissolved in 6.4 mL 2-propanol and 1.6 mL water. This solution is degassed by purging with argon for 30 minutes at room temperature. Then 50 mg CuCl is added and purging is continued for 10 minutes. The polymerization is initiated by adding 10 µL of ethylbromoisobutyrate and propagated for 24 hours at room temperature, while stirring and keeping the solution under argon. After 24 hours the solution becomes viscous and brown-green. All solvent is evaporated under reduced pressure and the residue is dissolved in water. The majority of the copper ions are removed by running the solution through a small neutral alumina column, leaving a light blue solution. The PMETAC was further purified by dialysis of the filtered solution against two times 1 L of a 2 M KCl solution in water and subsequently three times 1 L of water in a 3![[hair space]](https://www.rsc.org/images/entities/char_200a.gif) 500 Mw cut-off dialysis membrane. After dialysis, excess solvent is evaporated under reduced pressure and the residue is freeze-dried to yield a fine white powder. GPC analysis of the product indicates that Mn = 11 kg/mol and Mw/Mn = 1.1.
500 Mw cut-off dialysis membrane. After dialysis, excess solvent is evaporated under reduced pressure and the residue is freeze-dried to yield a fine white powder. GPC analysis of the product indicates that Mn = 11 kg/mol and Mw/Mn = 1.1.
For the synthesis of PSPM 4.5 g KSPM, 75 mg ligand and 7 mg CuCl2 are dissolved in 2.5 mL water and 5 mL methanol. Degassing, initiation and propagation are carried out in the same way as for PMETAC. In the final solution 18 mg CuCl and 10 µL initiator were added. After 24 hours of polymerization, PSPM is purified by evaporating all solvents under reduced pressure, dissolution of the residue in water, dialysis against four times 1 L of a 2 M KCl solution in water and three times 1 L of water, evaporation and freeze-drying. GPC analysis of the product indicates that Mn = 90 kg/mol and Mw/Mn = 1.3.
2.3 Complex coacervates
Complex coacervate samples are prepared by dissolving equal amounts (moles of monomer groups) in a solution of 350–1500 mM KCl in water. All samples therefore have a mixing ratio of both charges and monomers of 1:1. The samples are mixed vigorously and left to equilibrate for four days, after which a semitransparent, viscous phase has formed at the glass wall in the solutions with sufficiently low salt concentrations (Fig. 2a). | ||
| Fig. 2 (a) Macroscopically phase separated system of oppositely charged polymers in 750 M KCl in water, (b) example of the analysis of the contact angle of a droplets of the coacervate phase in (a) on silica and (c) average advancing contact angle of a complex coacervate phase in its coexisting aqueous phase on silica as a function of salt concentration. The solid line is drawn to guide the eye. | ||
Advancing contact angles of these coacervate phases on plasma treated flat silicon wafers are measured as follows. The phase separated solutions are mixed, until the complex coacervate phase is dispersed as droplets in its equilibrium aqueous phase. This mixture is injected in a glass cuvet with the cleaned silicon wafer at the bottom. The cuvet is placed on the stage of a Krüss G10 contact goniometer and contact angles of sedimented coacervate droplets, advancing on the silica surface, are measured over a period of three hours. Droplet pictures are then analyzed using a drop analysis plugin based on active contours in ImageJ (see for example Fig. 2b).19 The resulting average advancing contact angles of a complex coacervate phase on silica in its coexisting aqueous phases are shown in Fig. 2c. At salt concentrations beyond 1000 mM we observe a transition from partial to complete wetting with a contact angle that decreases to 0°.
2.4 Colloidal probe AFM
Force measurements are performed on a Nanoscope 4 AFM (Digital Instruments), equipped with a PicoForce scanner. Cleaned silicon wafers and cantilevers with a silica colloidal probe are enclosed in a liquid cell with a volume of approximately 250 µL, sealed by a rubber ring. The liquid cell is filled with the dilute phase of the phase separated complex coacervate samples. Force distance curves are measured using a scan range of 1000 nm and scanning velocities ranging from 20 to 1000 nm/s. At least 20 separate curves are recorded for every sample and every scanning speed. The position where the two surfaces are in direct contact (h = 0) is taken in the constant compliance region. Absolute separations between the surfaces are derived from this reference position. The cantilever deflection data are converted to interaction forces using Hooke's law, F = k·Δz, where k is the cantilever spring constant. In this study we use cantilevers with spring constant in the range of 0.07–0.12 N/m. We determine the spring constant for every cantilever separately using the thermal tuning method introduced by Hutter and Bechhoefer.203 Results and discussion
3.1 Force distance curves
Typical force–distance curves for the interactions between two silica surfaces, immersed in the dilute phase of an associatively demixed system of oppositely charged polymers, are shown in Fig. 3. We want to stress here that the immersing liquid is near its binodal concentration, i.e. saturation conditions apply. Our first observation is that there is considerable hysteresis in these force curves. No attractive force is measured upon approach for any of the scanning velocities. The retraction curves, by contrast, show a long-range attractive force for sufficiently low salt concentrations, which we ascribe to a capillary adhesion force, following a similar reasoning as Sprakel et al.17 Firstly, the attractive force can not be ascribed to bridging by one of the polymers, as no attraction was measured in solutions of either polymer separately. Secondly, the range of attraction (∼200 nm) is much larger than can be expected for depletion interactions, which have a range comparable to the radius of gyration (here ∼5 and 20 nm). Thirdly, we exclude the attractive van der Waals interaction between the two silica surfaces, because we do not measure any attraction between the same surfaces in solutions of only salt. Therefore, we attribute the attractive forces to capillary adhesion, which results from the capillary condensation of a dense, complex coacervate phase between the two surfaces at close separation. This possibility is confirmed by Fig. 2b and c, where we show that the complex coacervate phase wets a silica surface. | ||
| Fig. 3 Typical retraction force–distance curves between silica surfaces immersed in saturated solutions of oppositely charged strong polyelectrolytes, using a scanning velocity of 20 nm/s (upper) and 1000 nm/s (lower). Each symbol corresponds to a different salt concentration of the polyelectrolyte solutions, as indicated by the labels (in mM KCl). The insets show the corresponding approach force curves. | ||
The formation of a capillary condensate of the coacervate phase requires the nucleation of the condensate phase between the two surfaces, which could explain the hysteresis between approach and retract observed in the force–distance curve. Nucleation is accompanied by an energy barrier, which is proportional to γA*, with γ the interfacial tension and A* the area of the critical nucleus. As a result, nucleation will only take place at a considerable rate when the surfaces are close together, so that A* is small, or when the interfacial tension between the two phases is extremely small.17
The second observation we make in Fig. 3 is that the attractive force in the retraction part of the force curves vanishes at salt concentrations above 1250 mM. This is in agreement with our observation that phase separation is absent in the solutions at the highest salt concentrations. It means that we crossed the critical point in the phase diagram beyond which the polyelectrolytes remain dissolved and no phase separation occurs. Clearly, salt has a strong effect on the phase behavior of these polyelectrolyte complexes, which we will discuss in more detail below.
We can determine the interfacial tension of the complex coacervate phase that forms the capillary bridge following the method of Sprakel et al.18 Briefly, there are two contributions to the capillary force in general: a Laplace pressure difference across the interface and the interfacial tension acting to minimize the interfacial area:21
 | (1) |
 | (2) |
 | ||
| Fig. 4 Extrapolation of the attractive capillary force to zero separation for a scanning velocity of 20 nm/s and a salt concentration of 750 mM KCl; 20 independent force–distance curves are shown. | ||
3.2 Kinetics of capillary bridge formation
In Fig. 5a we have plotted the force at zero separation, which is directly proportional to the apparent interfacial tension, as a function of the scanning velocity. For salt concentrations above 500 mM the adhesion force is independent on scanning velocity over the complete range of velocities that we use. In addition, the measured force does not depend on the time that the two surfaces are kept in contact before retraction, as indicated in Fig. 5b. This suggests that the capillary bridge grows very fast, once nucleated, at these salt concentrations. At a salt concentration of 350 mM however, we do observe an increase in attractive force with increasing contact time (Fig. 5b). Our explanation for the observed contact time dependence is related to the kinetics of capillary bridge formation.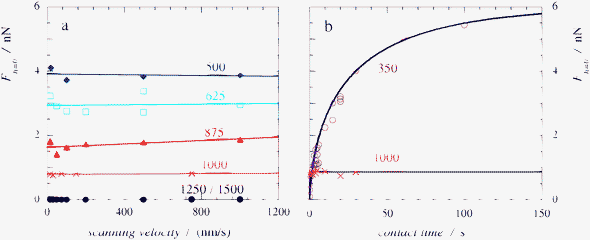 | ||
| Fig. 5 (a) Extrapolated adhesion force between two silica surfaces, connected by a capillary bridge of a complex coacervate phase, as measured by CP-AFM as a function of scanning velocity for different salt concentrations. The labels correspond to salt concentrations in mM KCl. (b) Change of the extrapolated attractive force with the time the two surface are kept in contact at a constant force for two salt concentrations. Labels as in (a). For a 350 mM KCl solution the kinetics of capillary bridge formation could be followed almost until completion by CP-AFM. For a 1000 mM KCl solution no change in the extrapolated force could be detected. The solid lines are fits of the experimental data to equation 4. | ||
In the discussion of Fig. 3 we attributed the hysteresis in the force–distance curves to the nucleation of the capillary condensate. We assumed that the second step in the formation of a capillary bridge, diffusion-limited growth of the bridge, is very fast. Our reasons to do so are (i) the small size of the polymers, leading to relatively fast diffusion and (ii) the small volume of the capillary bridge, which means that only little polymer material has to diffuse to reach the equilibrium volume of the capillary condensate. We find that this assumption is valid for high enough salt concentrations. Lowering the salt concentration shifts the phase equilibrium, such that the dilute phase becomes more dilute and the concentrated phase more concentrated.23 As a result, more material is required to form the capillary condensate, while there is less material available in the dilute aqueous phase to provide this. We therefore expect the diffusion times to increase with decreasing salt concentration.
At a salt concentration of 350 mM the capillary force increases to what seems to be a plateau value in roughly 100 seconds. At the shortest contact times (0.1 second), we do already measure a weak attractive force in all force curves. This is an indication that nucleation is not the limiting step in the formation of the capillary bridge.
In an attempt to quantify our kinetic data, we numerically fit our data to a model for the diffusion-limited growth of a capillary bridge between a sphere and a plate introduced by Kohonen et al.24 They use Langmuir's treatment of the diffusion-limited growth of atmospheric water droplets to arrive at the following differential equation for the change of the radius of curvature with time.
 | (3) |
 | (4) |
The solid lines in Fig. 5b are numerical fits of the data to the above equation, using three parameters: A = 2πγDc/ρ, B = 2πγDc*/ρ and λK = γvm/kBT, being the Kelvin length, which characterizes the length scale of capillary forces. It follows that A/B = c/c*, a measure for the saturation of the surrounding solution. We find that A/B ≈ 1 for both salt concentrations in Fig. 5b, which is an indication that the assumption that saturation conditions applied is reasonable. Furthermore, we find that λK, the Kelvin length, is approximately 500 nm. The Kelvin length is determined by the interfacial tension and the molecular volume, vm. From the plateau value of the capillary force in Fig. 5b, we find that the interfacial tension for this salt concentration is 400 µN/m. Using this value for the interfacial tension, we can estimate the molecular volume vm in equation 4, leading to a molecular volume, vm, of order 10−23 m3. This molecular volume corresponds to the total volume occupied by a polyelectrolyte chain, including solvent within the coil. The effective radius of the polyelectrolytes is therefore of order 10 nm, which is a realistic value for the polyelectrolyte molecules we use.
Finally, we note that the diffusion-limited growth of the capillary bridge in our experiments imposes a lower boundary for the salt concentrations that can be used. At even lower salt concentrations, growth of the capillary bridge becomes even slower and at much longer time scales than 100 seconds drift problems in the AFM set-up make it impossible to get reliable retraction force curves. Therefore, we can only make an estimate of the interfacial tension between a coacervate phase and its equilibrium aqueous phase at low salt concentration by extrapolation.
3.3 Effect of salt on coacervate interfacial tension
Fig. 6 shows the interfacial tension between the coacervate phase and its coexisting dilute phase as a function of salt concentration in the solution. The interfacial tension decreases with increasing salt concentration and vanishes at a critical salt concentration (ccr) of 1250 mM. | ||
| Fig. 6 (a) Interfacial tension of complex coacervate phases as measured by CP-AFM as a function of salt concentration. The error bars represent the standard deviation of the interfacial tension around their average value at different scanning velocities. The critical salt concentration, above which no capillary force could be measured, is indicated by the arrow. (b) Same data as in (a), but plotted against the separation from the critical point on a double logarithmic scale. The solid line is a power-law fit to the experimental data, with an exponent 1.5. | ||
In the inset of Fig. 6 we plot the interfacial tension, γ, as a function of the separation from the critical salt concentration, c − ccr. We find a power-law behavior with an exponent of approximately 1.5. To explain this scaling, we use the mean-field model of Overbeek and Voorn,23 which estimates the total free energy of mixing as a sum of mixing entropy terms, based on a Flory-Huggins expression, and electrostatic interaction terms, based on the theory of Debye and Hückel, for every component. This approximation is validated in the polyelectrolyte complex by the fact that the interactions between individual charged spots and ions is much more pronounced than the interaction of the complete polyelectrolyte molecules.
Our system can be expressed as a three-component system in the model of Overbeek and Voorn with a stoichiometric polyelectrolyte salt (PQ), a microsalt (KCl) and solvent (water). At this stoichiometric charge ratio, the phase diagram of the complex coacervate and salt mixture can be mapped onto a segregative polymer-solvent mixture, with an effective interaction parameter:25
 | (5) |
| γ ∝ (χ − χcr)3/2 | (6) |
Using now the effective interaction parameter, χeff ∝ κ−1 ∝ csalt−1/2, we find that for associative demixing, the interfacial tension vanishes close to the critical salt concentration according to
 | (7) |
Finally, we can make a comparison between our interfacial tension values and the values reported by De Ruiter and Bungenberg-de Jong for a complex coacervate of gelatin and arabic gum.11 Our interfacial tension values are one to two orders of magnitude larger than the values obtained by De Ruiter and Bungenberg-de Jong, who found values of 1–2 µN/m. This difference can be explained by considering the nature of the coacervate phase. In our case the coacervate phase is formed by two strong polyelectrolytes with a very high charge density (σ ≈ 1). De Ruiter and Bungenberg-de Jong used gelatin and gum arabic, two weak polyelectrolytes with an estimated 1% of the groups bearing a charge. A higher charge density results in a stronger cohesive force within the complex coacervate phase and therefore a higher value of the interfacial tension. This is also expressed by equation 5.
4 Conclusions
We have measured the interfacial tension of complex coacervate phases of strong polyelectrolytes with CP-AFM. The force curves show no attraction upon approach, but upon retraction a capillary adhesion force is measured. From these forces we could obtain the interfacial tension between the coacervate phase and the coexisting aqueous phase, which is of order 100 µN/m. The interfacial tension decreases with increasing salt concentration and vanishes at the critical point. We were able to measure the interfacial tensions in a range of salt concentrations from the critical salt concentration, where no phase separation occurs, to a lower experimental limit. Below this lower limit, diffusion-limited growth of the capillary bridge is too slow for AFM to yield accurate measurements. The dependence of the interfacial tension on the salt concentration is in agreement with a mean-field model for complex coacervation. These results will be valuable in predicting the proper conditions for applications of these complex coacervate phases, such as nucleoid models, drug carriers and coatings. In the case of supramolecular assemblies based on oppositely charged polymers (C3Ms), combination of our results for interfacial tension as a function of salt with a nucleation theory for such assemblies in which the interfacial tension is used10 will lead to a prediction for the critical aggregation concentration as a function of salt concentration that can be compared with the empirically found dependence of Yan et al.28 and the suggested scaling found in calculations by Kramarenko et al.12Acknowledgements
The authors gratefully acknowledge Frans Leermakers for fruitful discussions and Gert Buurman for the artwork. ES acknowledges financial support from the Netherlands Organisation for Scientific Research (NWO).Notes and references
- H. B. de Jong and H. Kruyt, Proceedings of the Section of Sciences, Koninklijke Nederlandse Akademie van Wetenschappen, 1929, 32, 849–856 Search PubMed.
- L. Luzzi, J. Pharm. Sci., 1970, 59, 1367–1376 CrossRef CAS.
- C. Thomasin, H. Nam-Trân, H. P. Merkle and B. Gander, J. Pharm. Sci., 1998, 87, 259–268 CrossRef CAS.
- A. Ohsugi, H. Furukawa, A. Kakugo, Y. Osada and J. P. Gong, Macromol. Rapid Commun., 2006, 27, 1242–1246 CrossRef CAS.
- M. Bakker, M. Konig and J. Visser, World Patent Application, 1994, WO94/14334.
- S. I. Laneuville, P. Paquin and S. L. Turgeon, J. Food Sci., 2005, 70, s513–s519 CrossRef CAS.
- J. Kester and O. Fennema, Food Technology, 1986, 40, 47–59 CAS.
- M. A. Cohen Stuart, N. A. M. Besseling and R. G. Fokkink, Langmuir, 1998, 14, 6846–6849 CrossRef.
- I. K. Voets, A. de Keizer and M. A. Cohen Stuart, Adv. Colloid Interface Sci., 2009, 147–148, 300–318 CrossRef CAS.
- J. Sprakel, F. A. M. Leermakers, M. A. Cohen Stuart and N. A. M. Besseling, Phys. Chem. Chem. Phys., 2008, 10, 5308–5316 RSC.
- L. de Ruiter and H. B. de Jong, Proceedings of the Section of Sciences, Koninklijke Nederlandse Akademie van Wetenschappen, 1947, 50, 836–848 Search PubMed.
- E. Y. Kramarenko, A. Khokhlov and P. Reineker, J. Chem. Phys., 2006, 125, 194902 CrossRef.
- H. Sato and A. Nakajima, Colloid Polym. Sci., 1974, 252, 944–948 CrossRef CAS.
- F. Weinbreck, R. H. Tromp and C. G. de Kruif, Biomacromolecules, 2004, 5, 1437–1445 CrossRef CAS.
- W. A. Ducker, T. J. Senden and R. M. Pashley, Nature, 1991, 353, 239–241 CrossRef CAS.
- H.-J. Butt, Biophys. J., 1991, 60, 1438–1444 CrossRef CAS.
- J. Sprakel, N. A. M. Besseling, F. A. M. Leermakers and M. A. Cohen Stuart, Phys. Rev. Lett., 2007, 99, 104504 CrossRef CAS.
- J. Sprakel, N. A. M. Besseling, M. A. Cohen Stuart and F. A. M. Leermakers, Langmuir, 2008, 24, 1308–1317 CrossRef CAS.
- A. Stalder, G. Kulik, D. Sage, L. Barbieri and P. Hoffmann, Colloids Surf., A, 2006, 286, 92–103 CrossRef CAS.
- J. L. Hutter and J. Bechhoefer, Rev. Sci. Instrum., 1993, 64, 1868–1873 CrossRef CAS.
- H.-J. Butt and M. Kappl, Adv. Colloid Interface Sci., 2009, 146, 48–60 CrossRef CAS.
- C. D. Willett, M. J. Adams, S. A. Johnson and J. P. K. Seville, Langmuir, 2000, 16, 9396–9405 CrossRef CAS.
- J. Overbeek and M. Voorn, J. Cell. Comp. Physiol., 1957, 49, 7–26 CrossRef CAS.
- M. M. Kohonen, N. Maeda and H. K. Christenson, Phys. Rev. Lett., 1999, 82, 4667–4670 CrossRef CAS.
- R. de Vries and M. A. Cohen Stuart, Fundamentals of Interface and Colloid Science, Academic Press, London, 1991, vol. 5 Search PubMed.
- J. Charvolin, J. Joanny and J. Zinn-Justin, Liquids at Interfaces, Les Houches 1988, session 48, North-Holland, 1988 Search PubMed.
- E. Scholten, R. Tuinier, R. H. Tromp and H. N. W. Lekkerkerker, Langmuir, 2002, 18, 2234–2238 CrossRef CAS.
- Y. Yan, A. de Keizer, M. A. Cohen Stuart, M. Drechsler and N. A. M. Besseling, J. Phys. Chem. B, 2008, 112, 10908–10914 CrossRef CAS.
| This journal is © The Royal Society of Chemistry 2010 |