Reversible NOx storage over Ru/Na–Y zeolite†
Sylvia
Smeekens
a,
Steven
Heylen
a,
Kenneth
Villani
a,
Kristof
Houthoofd
a,
Eric
Godard
a,
Moniek
Tromp
b,
Jin Won
Seo
c,
Michaël
DeMarco
d,
Christine E. A.
Kirschhock
a and
Johan A.
Martens
*a
aCentre for Surface Chemistry and Catalysis, Katholieke Universiteit Leuven, Kasteelpark Arenberg 23, 3001, Leuven, Belgium. E-mail: johan.martens@biw.kuleuven.be; Fax: +32 1632 1998; Tel: +32 1632 1637
bSchool of Chemistry, University of Southampton, Highfield, Southampton, SO17 1BJ, United Kingdom
cDepartment of Metallurgy and Materials Engineering, Katholieke Universiteit Leuven, Kasteelpark Arenberg 44, 3001, Leuven, Belgium
dPhysics Department, Buffalo State College, 1300 Elmwood Avenue, Buffalo, New York 14222, USA
First published on 21st October 2010
Abstract
Ruthenium loaded Na–Y zeolite was found to be an efficient adsorbent for achieving NOx adsorption–desorption cycles comprising adsorption under oxidizing and desorption under reducing conditions. The speciation of ruthenium was investigated using TEM, EXAFS, 99Ru Mossbauer spectroscopy and XRD in combination with Rietveld refinement. The sodium cation siting was monitored using 23Na MAS NMR. Characterization of the Ru/Na–Y adsorbent in NOx saturated and regenerated state revealed a unique cooperation of supported ruthenium nano metal particles and isolated Ru atoms in framework cavities affecting the sodium cations. Supported ruthenium nanoparticles assume a catalytic role in NO oxidation. Ruthenium atoms in framework cavities undergo switching of oxidation state during adsorption–desorption cycles. It triggers reversible sodium cation migrations from coordination with the framework in the regenerated state to coordination in sodium–water networks in supercages providing adsorption sites for NOx during adsorption. The peculiar ruthenium organization is naturally obtained upon lean–rich cycling. Ru/Na–Y adsorbent is insensitive to SOx and to the presence of CO during reductive regeneration.
Introduction
Nitrogen oxides (NOx) are produced in combustion processes in presence of air. Especially the NOx emitted in the troposphere by traffic is of major concern.1 One solution to the NOx emission problem is the development of customized exhaust gas cleaning techniques for the different engine types.2 Three-way catalysts can achieve simultaneous and almost complete removal of uncombusted hydrocarbons, carbon monoxide and NOx from exhaust of gasoline engines, operated at nearly stoichiometric air-to-fuel ratio.3 The latest diesel and lean-burn gasoline type engines produce increased NOx emissions, necessitating alternative approaches. Exhaust gas purification can be achieved using selective catalytic reduction (SCR) and NOx-storage with periodic reductive regeneration (NSR).4–12 SCR catalysts continuously achieve the reduction of NOx using urea or hydrocarbons. The NSR concept involves a periodic two step process. While the engine is operated under lean-burn condition, NOx is oxidized into NO2 on a Pt catalyst and stored as nitrate on an alkaline earth compound, e.g. BaCO3 or BaO.13–15 For regeneration, the engine is switched to rich operation for a short time. Stored NOx is released and reduced to N2 with the help of reductants from a rich gas produced by the engine.16,17 A disadvantage of the NSR system is the poisoning of the precious metal catalyst and the NOx-storage material by SOx originating from combustion of sulfur compounds contained in the fuel.18–20In automotive exhaust gas treatment zeolites are gaining popularity, especially for hydrocarbon trapping at cold start and in SCR.6,21–24 The potential of zeolites for NOx adsorption in view of NSR applications has been investigated.25–28 Generally, in alkali and alkaline earth metal exchanged Y zeolites NOx is adsorbed as surface nitrate.24,27,28 In Na–Y zeolite NOx can be adsorbed according to a different mechanism.29 At temperatures above 200 °C, NO and NO2 are co-adsorbed as N2O3 molecules which compete with three water molecules for an adsorption site composed of sodium cations in the zeolite Y supercage. The stored NOx can be released in a pressure swing process using hydrated inert gas. The presence of SOx does not have an influence on the NOx storage capacity owing to a different location of adsorbed SOx and NOx molecules in Na–Y cages.30,31 Nevertheless, Na–Y zeolite would fall short in practical application due to the slow NOx desorption kinetics and the requirement of an equimolar mixture of NO and NO2 in the exhaust, which is difficult to achieve.29–32 Since NO is the main NOx compound of engine exhaust gas, NOx adsorption on Na–Y is critically dependent on NO into NO2 oxidation. Practically, the oxidation could be achieved using an upfront catalyst. Incorporation of an oxidation function via a supported noble metal on the Na–Y zeolite itself could be an elegant solution.
Exceptional catalytic activity of zeolite supported ruthenium metal dispersed on zeolites including Na–Y zeolite in redox reactions had already been observed in carbon oxidation,33 Fischer–Tropsch synthesis,34 the water gas shift reaction,35 ammonia synthesis36,37 and carbon monoxide oxidation.38 While evaluating noble metal oxidation functions we discovered that ruthenium is particularly suited for oxidizing NO and enhancing NOx adsorption on Na–Y zeolite. Here we demonstrate lean–rich NOx adsorption–desorption cycles with rapid desorption kinetics on Ru/Na–Y zeolite. In the Ru/Na–Y adsorbent, ruthenium particles exert a redox catalytic function. In addition, isolated ruthenium atoms in the framework cavities undergo reversible oxidation and reduction which causes dramatic sodium cation migration. Cation migration in zeolites induced by adsorbate molecules is a known phenomenon.39–42 Here we demonstrate a cooperation of reducible and non-reducible cations which allows switching of the cation distribution in zeolite framework cavities. This mechanism reversibly generates and destroys the adsorption site for NOx.
Results and discussion
Ru(3%)/Na–Y zeolite was loaded in the adsorption unit and subjected to NOx adsorption–desorption cycles at 250 °C. Inlet gas composition during adsorption was 1000 ppm NO, 5% O2, 3% H2O and N2. N2 spiked with 1% H2 and 3% H2O was used for desorption. It typically took 5 cycles before stable and reversible adsorption–desorption cycles were obtained. In a representative later cycle shown in Fig. 1, there was significant NOx uptake during the first minutes of the adsorption phase.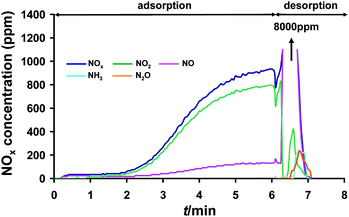 | ||
| Fig. 1 A detailed NOx adsorption–desorption pattern recorded at the outlet of a Ru(3%)/Na–Y adsorbent bed at 250 °C. The adsorbent was pretreated at 450 °C for 1 h under a flow of 5% O2, 3% H2O and balance N2 before adsorption–desorption cycles started. Gas composition during lean phase was 1000 ppm NO, 5% O2, 3% H2O and balance N2. Regeneration of the bed during rich phase was done with 1% H2, 3% H2O and balance N2. | ||
The main compound in the NOx outlet (i.e. unadsorbed NOx) was NO2 which revealed the strong oxidation activity of Ru(3%)/Na–Y. After switching to regeneration gas, sudden NOx desorption was obtained which was completed within 1 min. The NOx adsorption capacity was 3.2 ± 0.1 mg NOx g−1. Part of the adsorbed NOx was released (1.6 ± 0.1 mg NOx g−1), mainly as NO (Fig. 1). Formation of only small amounts of NH3 and N2O was detected revealing that a substantial part of the NOx was reduced by hydrogen to N2. The use of Rh, Pt, Pd or Ir instead of Ru metal on the same Na–Y zeolite led to at least three times lower NOx adsorption capacity, ill defined adsorption profiles (Pt) and low NO oxidation activity (Pd, Ir, Rh) (ESI, Fig. S1†).
The rapid NOx release was a remarkable effect of loading ruthenium on Na–Y zeolite. The peak NOx concentration amounted to 8000 ppm (Fig. 1).
Ru/Na–Y adsorbent in absence of O2 during the adsorption phase did not show any NOx adsorption activity. Raising the O2 content from 1 to 5% systematically increased the NOx adsorption capacity. At higher O2 concentrations up to 10%, there was quantitative oxidation of NO into NO2 and no longer an influence of O2 concentration on NOx adsorption capacity. At all gas compositions investigated, Ru(3%)/Na–Y catalyst established the internal thermodynamic equilibrium of NO, O2 and NO2. Feeding 500 ppm NO and 500 ppm NO2 instead of 1000 ppm NO in presence of 5% O2 did not alter the adsorption performance. Feeding 1000 ppm NO2 in the presence of 5% O2 caused a decrease of the adsorption capacity to 2.1 ± 0.1 mg NOx g−1. The latter observation points to the necessity of NO being present in the NOx mixture.
In another set of NO adsorption experiments the water content of the feed was varied. In absence of water there was no NOx adsorption. In presence of 3% up to 12% water, a similar NOx adsorption behavior was observed. When the water supply was interrupted during the adsorption phase of a cycle, Ru(3%)/Na–Y immediately lost its NOx adsorption property. Adding water quickly restored the NOx adsorption activity (Fig. 2).
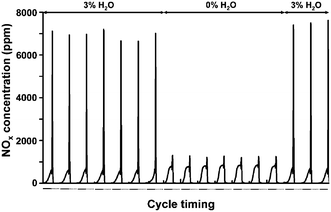 | ||
| Fig. 2 NOx concentration traces at the adsorber outlet in cycles with 5 min adsorption (—) and 5 min desorption (⋯) on a Ru(3%)/Na–Y zeolite at 250 °C in presence of different H2O concentrations. The Ru(3%)/Na–Y adsorbent was pretreated at 450 °C for 1 h under a flow containing 5% O2, 3% H2O and balance N2. Lean composition was 1000 ppm NO, 5% O2, 3% H2O and balance N2 and regeneration of the adsorbent bed was done with 1% H2, 3% H2O and balance N2. | ||
The NOx adsorption capacity was investigated at different volumetric space velocities. In the VHSV range of 7500–45![[thin space (1/6-em)]](https://www.rsc.org/images/entities/char_2009.gif) 000 h−1, the NOx adsorption capacity showed little dependence on space velocity. Increasing the VHSV to 75
000 h−1, the NOx adsorption capacity showed little dependence on space velocity. Increasing the VHSV to 75![[thin space (1/6-em)]](https://www.rsc.org/images/entities/char_2009.gif) 000 and 100
000 and 100![[thin space (1/6-em)]](https://www.rsc.org/images/entities/char_2009.gif) 000 h−1 caused a significant drop. Under those conditions the NO into NO2 oxidation function was found to be limiting (ESI, Fig. S2†).
000 h−1 caused a significant drop. Under those conditions the NO into NO2 oxidation function was found to be limiting (ESI, Fig. S2†).
On weight basis the NOx adsorption capacity of Ru(3%)/Na–Y is similar to that of 2%Pt–17% BaO/Al2O3, but lower than the best in literature reported NOx adsorbent formulations (ESI, Fig. S3†).12,43,44
Ru(3%)/Na–Y adsorbent after pretreatment at 450 °C for 1 h under 5% O2 and 3% H2O was characterized using powder X-ray diffraction in sealed capillaries. In addition to the diffraction pattern of Na–Y zeolite, a crystalline anhydrous RuO2 phase with characteristic diffraction peaks at 28.4, 35.3 and 54.4° 2θ was detected. After running several adsorption-desorption cycles at 250 °C, in the regenerated sample as well as in the NOx saturated sample, no RuO2 was detected by XRD. Instead, Ru metal was identified by a broadened diffraction peak around 44° 2θ (Fig. 3).
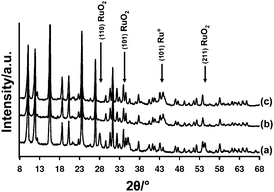 | ||
| Fig. 3 XRD pattern of Ru(3%)/Na–Y after (a) pretreatment, (b) NOx saturation and after (c) NOx release. Pretreatment was done at 450 °C for 1 h under a flow of 5% O2, 3% H2O and balance N2 before adsorption–desorption cycles at 250 °C. Lean gas composition was 1000 ppm NO, 5% O2, 3% H2O and balance N2. Rich composition was 1% H2, 3% H2O and balance N2. | ||
The presence of a segregated ruthenium phase was confirmed by TEM (Fig. 4). The elongated particles measuring 30–150 nm observed outside of the zeolite crystals were ascribed to Ru metal.45 Ruthenium is known to easily segregate from a faujasite zeolite in oxidation–reduction cycles.45
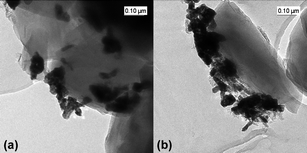 | ||
| Fig. 4 TEM images of a Ru(3%)/Na–Y zeolite after (a) NOx saturation and (b) NOx release. | ||
NOx saturated and regenerated adsorbent samples after 10 NOx adsorption–desorption cycles under standard conditions (Fig. 1) were sealed and investigated with EXAFS spectroscopy. The experimental χ(k) EXAFS functions obtained for both samples were found to be similar (ESI, Fig. S4†). The experimentally determined and theoretically calculated k3 χ(k) EXAFS function in k space and the Fourier transforms in real space, including the imaginary parts, for the NOx saturated Ru(3%)/Na–Y sample, measured at the Ru K-edge are shown in Fig. 5. The experimentally and calculated χ(k) EXAFS functions in k space for this NOx saturated Ru(3%)/Na–Y sample are included in the ESI (Fig. S5†).
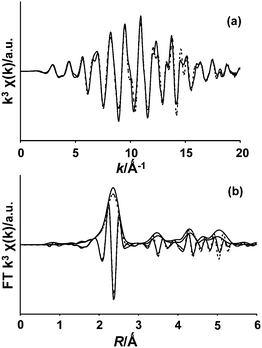 | ||
Fig. 5 Experimental (—) and calculated (![[dash dash, graph caption]](https://www.rsc.org/images/entities/char_e091.gif) ) (a) k3-weighted EXAFS function and (b) the corresponding Fourier transform plots including the imaginary part of the NOx saturated Ru(3%)/Na–Y sample at the Ru K-edge. ) (a) k3-weighted EXAFS function and (b) the corresponding Fourier transform plots including the imaginary part of the NOx saturated Ru(3%)/Na–Y sample at the Ru K-edge. | ||
The data quality was excellent, allowing all Ru–Ru metal single shell contributions up to 5 Å, as well as the major multiple scattering contributions, to be included in the fit. Moreover, during the fit only one Debye–Waller factor and one delta R (i.e. difference in distance compared to the model) were fitted to all contributions (in addition to S02 and E0). This assumes the structure of the Ru particles is identical to the Ru metal, which was confirmed by the goodness of the fit (R = 5%). The corresponding structural parameters can be found in the ESI (Table S1).† The obtained large coordination numbers and multiple shells including multiple scattering present up to at least ∼6 Å, suggest that the metal particles present at the surface of the zeolite structure were very large. EXAFS did not provide any evidence for the presence of other Ru species next to Ru metal. Considering the detection limits of EXAFS, ruthenium species other than ruthenium metal, if present, should represent less than 10% of all ruthenium present.
99Ru Mossbauer spectroscopy was run on NOx saturated Ru(3%)/Na–Y zeolite. The spectrum exhibited a single-line centered at zero velocity (Fig. 6), attributed to metallic ruthenium.
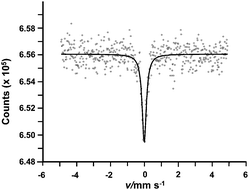 | ||
| Fig. 6 Mössbauer effect plot of the 99Rh(Ru) source versus a 101Ru(3%)/Na–Y zeolite after NOx saturation measured at 25 K. The small circles represent the experimental data and the solid line is a single Lorentzian line fit to the data. | ||
The line width fit was 0.30 mm s−1 FWHM. In a non-magnetic compound such as Na–Y zeolite, 99Ru Mossbauer spectroscopy fails to discriminate among nano Ru metal particles, if any, from the larger Ru metal particles observed with TEM (Fig. 4).
In subsequent experiments the ruthenium loading of Na–Y zeolite was decreased to 2, 1 and 0.5 wt%. NOx adsorption cycles comprising 5 min adsorption and 5 min desorption were run using the standard gas compositions. NOx release from all these adsorbents with different Ru content was always very quick and achieved within 1 min. Optimum adsorption temperature and NOx adsorption capacities were estimated based on an average of 10 stable and reversible NOx adsorption–desorption cycles. All samples showed an optimum adsorption temperature. On Ru(3%)/Na–Y the optimum temperature was 250 °C increasing gradually to 300 °C with decreasing Ru content to 0.5 wt% (Fig. 7). Lowering the ruthenium content while increasing the adsorption temperature had a beneficial influence on the NOx adsorption capacity. The NOx adsorption capacity of Ru/Na–Y samples after 5 min of adsorption at the optimum temperature decreased with increasing Ru content:
Ru(6%)/Na–Y (2.0 ± 0.1 mg NOx g−1) < Ru(3%)/Na–Y (2.8 ± 0.1 mg NOx g−1) < Ru(2%)/Na–Y (3.4 ± 0.1 mg NOx g−1) < Ru(1%)/Na–Y (3.6 ± 0.1 mg NOx g−1) < Ru(0.5%)/Na–Y (3.8 ± 0.1 mg NOx g−1).
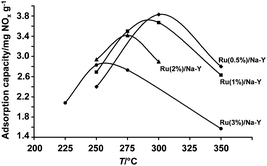 | ||
| Fig. 7 Adsorption capacity versus temperature for Ru/Na–Y catalysts loaded with different wt% Ru: ● Ru(3%)/Na–Y, ▲ Ru(2%)/Na–Y, ■ Ru(1%)/Na–Y, ♦ Ru(0.5%)/Na–Y. All the adsorbents were pretreated at 450 °C for 1 h in a gas flow containing 5% O2, 3% H2O and balance N2 before adsorption–desorption cycles started. Lean gas composition was 1000 ppm NO, 5% O2, 3% H2O and balance N2. Rich gas composition was 1% H2, 3% H2O and balance N2. The NOx adsorption capacities were calculated based on an average of 10 cycles. The standard deviation of the NOx adsorption capacities was less than ±0.1 mg NOx g−1 in all data points. | ||
At the beginning of an adsorption phase, some NO breakthrough occurred depending on the Ru content of the Na–Y zeolite. This NO breakthrough was most pronounced on Ru(0.5%)/Na–Y and was absent on Ru(3%)/Na–Y. Apparently, at the lowest ruthenium loading the oxidation function immediately after switching from rich to lean gas was insufficient. Assmann et al. assigned the catalytic oxidation activity of supported Ru nanoparticles to an ultrathin Ru oxide surface layer covering the metallic core.46 Those core-shell RuO2/Ru particles were reported to be stable under oxidizing conditions below 375 °C. Above 375 °C under oxidation conditions there is a transformation into the less active bulk RuO2. Provided core-shell RuO2/Ru nanoparticles take the role of NO oxidation in Ru/Na–Y adsorbents, after each NOx desorption in the presence of hydrogen the active RuO2 surface layer needs to be restored for reaching maximum NO oxidation activity.
The observation that the NOx adsorption capacity increased with decreasing ruthenium loadings of the zeolite (Fig. 7), suggested that NOx adsorption did not occur on ruthenium and that an excess of ruthenium even eliminated or obstructed access to NOx adsorption sites.
The presence of H2 was essential for obtaining fast desorption. In an experiment with desorption in the absence of H2, the regeneration of Ru(3%)/Na–Y lasted more than 10 min (Fig. 8). Similar slow desorption kinetics were also observed on NOx saturated Na–Y zeolite (without Ru-metal loading), using an equimolar mixture of NO and NO2 (Fig. 8).
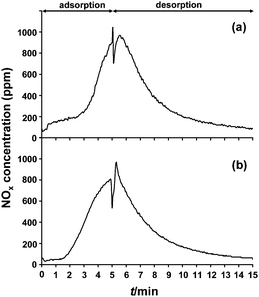 | ||
| Fig. 8 NOx adsorption–desorption behavior of (a) a Na–Y zeolite and (b) a Ru(3%)/Na–Y zeolite at 250 °C. The Ru(3%)/Na–Y zeolite was first pretreated at 450 °C for 1 h under a gasflow of 5% O2, 3% H2O and balance N2 before adsorption–desorption cycles started. Lean gas composition was 1000 ppm NOx (500 ppm NO + 500 ppm NO2 for Na–Y and 1000 ppm NO for Ru(3%)/Na–Y), 5% O2, 3% H2O and balance N2. Regeneration gas during rich phase was composed of 3% H2O and balance N2. | ||
Provided that ruthenium particles located on the outside of the zeolite crystals (Fig. 4) performed the NO oxidation, and NOx molecules were trapped inside the cavities of the Na–Y zeolite, at locations typically distant from Ru, the question remained why the rate of NOx release was so strongly dependent on the presence of hydrogen (Fig. 1 and 8).
To better understand the NOx adsorption site, Ru(1%)/Na–Y was subjected to NOx adsorption–desorption cycles at the optimum temperature of 275 °C and investigated using 23Na MAS NMR in NOx saturated state and after regeneration (Fig. 9). The 23Na nucleus has a quadrupole moment, which interacts with the electric field gradient at the nuclear site. When saturated with NOx, the 23Na MAS NMR signal consisted of a narrow signal with Gaussian line shape at ca. −16.5 ppm (Fig. 9a). Such a spectrum is typical of Na+ cations in a symmetric environment like that found in a well hydrated zeolite, where the cations do not directly interact with the framework.47 In the regenerated sample the 23Na MAS NMR signal was broadened and extended to more negative chemical shifts (Fig. 9b). This spectral change implied that some of the Na+ ions were more shielded and that their environment was less symmetric, like in a situation where Na+ resides close to the zeolite framework. The 23Na MAS NMR signal of the regenerated sample indeed strongly resembled a typical NMR pattern of partially dehydrated Na–Y zeolite with Na+ preferentially occupying sites close to 6-ring windows of the host.47,48
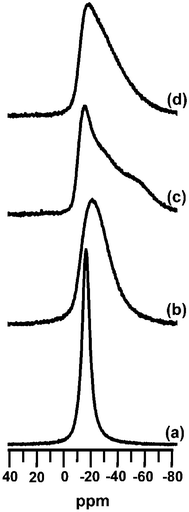 | ||
| Fig. 9 23Na MAS NMR spectra of a Ru(1%)/Na–Y zeolite after NOx adsorption–desorption cycles with 1% H2 during regeneration interrupted after (a) NOx adsorption and (b) regeneration and after NOx adsorption–desorption cycles without H2 during regeneration interrupted after (c) NOx adsorption and (d) regeneration. | ||
Ru(1%)/Na–Y samples exposed to NOx adsorption cycles in absence of hydrogen were also investigated (Fig. 9). Different to in presence of hydrogen, the 23Na MAS NMR signal of the NOx saturated sample showed more asymmetry, typical of a partially hydrated zeolite with framework–sodium interaction (Fig. 9c). The 23Na MAS NMR spectrum of the regenerated adsorbent hardly changed (Fig. 9d). Thus, 23Na MAS NMR revealed that the use of hydrogen for regeneration had a significant impact on the sodium cation distribution. For comparison, Na–Y zeolite (without ruthenium) was used in adsorption cycles at 250 °C using a gas mixture of N2 with 500 ppm NO, 500 ppm NO2, 5% O2 and 3% H2O during adsorption, and N2 with 1% H2 and 3% H2O for regeneration. The 23Na MAS NMR spectra of Na–Y saturated with NOx and after regeneration (Fig. 10) resembled those of Ru(1%)/Na–Y run in absence of hydrogen (Fig. 9).
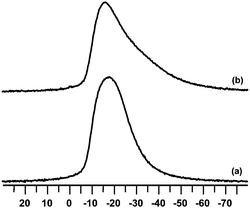 | ||
| Fig. 10 23Na MAS NMR spectra of a Na–Y zeolite after (a) NOx saturation and after (b) NOx release. NOx adsorption–desorption cycles were done with the standard gas composition and at standard reaction conditions. | ||
Here too, the sodium ions showed similar environments before and after NOx desorption. The only species in the adsorbent which could be affected by a redox cycle was ruthenium. Therefore, it was concluded that the reduction of ruthenium caused a dramatic change in Na+ cation environments and that the observed sudden NOx release was directly linked to this Na+ cation migration process.
A drastic change of the cation distribution in a known zeolite framework can be studied by Rietveld refinement in combination with analysis of difference electron density charts of the corresponding powder X-ray patterns. For the convenience of the reader the cation positions in FAU zeolite are shown in Fig. 11. The strategy of Rietveld refinement is provided in the ESI.†
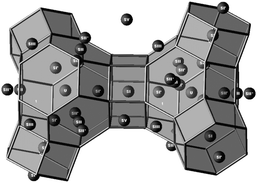 | ||
| Fig. 11 Schematic representation of the cation positions in FAU-type zeolites. | ||
Ru(1%)/Na–Y adsorbent in different states was investigated. Compared to the 3 wt% Ru loaded adsorbent, according to TEM the Ru(1%)/Na–Y sample contained less ruthenium metal particles on the external surface of the zeolite crystals. At this low loading, the ruthenium metal was no longer detectable with XRD (ESI Fig. S6 and S7†) As could be expected from the 23Na MAS NMR experiments, the powder patterns after NOx adsorption and release in the absence of hydrogen very closely resembled each other (ESI, Fig. S8†). The R-factors of the fits, the atomic coordinates, occupation parameters, isotropic type and displacements and symmetry multiplicities are provided in the ESI (Tables S2–S4).†
Indeed, the patterns could satisfactorily be fitted with the cation–water networks known from Na–Y without Ru. In this structure, Na+ ions on site SIII participate not only in network formation with SV and SII ions but also are in interaction with the zeolite framework which readily explained the asymmetry of the NMR signals. A slight displacement of the Na+ ions on SIII was observed upon adsorption of NOx, which caused the more emphasized asymmetry in the 23Na MAS NMR signal in this condition. A representation of the cation distribution can be found in the ESI (Fig. S9).† A very different situation was encountered comparing diffractograms of samples after NOx saturation and release in presence of hydrogen (ESI, Fig. S8†). A drastic change in the patterns clearly indicated very different cation distributions present in the two states of the adsorbent. In the NOx saturated sample, the supercages contained water networks that linked Na+ cations at position SIII with Na+ cations at position SV and SII, similar to those observed in the Na–Y zeolite.29 But in this structure, the cations on SIII were removed exceptionally far from the framework so that almost linear SIII–SV chains with highly symmetric octahedral Na+ environments were formed. Furthermore, the number of cations participating in this network formation, especially on sites SIII and SV, was considerably higher compared to the situation in the absence of hydrogen during cycling (ESI, Table S5†). In total about half of the SV and SIII positions were occupied by linked sodium–water octahedra. About the same number of SII* ions was found, which in all probability also interacted with water molecules of the described SIII–SV chains. The refined number of water molecules was in excellent agreement with the thermogravimetrically determined amount of approximately 80 molecules per unit cell. As the loading of the material with NOx was relatively small (4.8 ± 0.1 mg NOx g−1) corresponding to about two NOx molecules per unit cell, a free refinement of the position of the NOx molecules was not feasible. However, inspection of observed and difference electron density suggested a highly probable site for adsorbed N2O3 species located between an SV, SIII and SII Na+ ion, replacing two water molecules and bridging SV and SIII octahedra. A slight improvement of the quality of refinement indicated this position indeed to be realistic. In the sodalite cages electron density was found on sites SII′, SI′ and also on SI in the hexagonal prisms (Fig. 12).
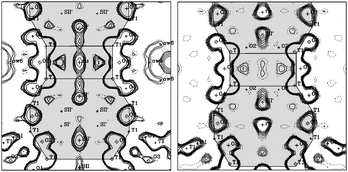 | ||
| Fig. 12 Electron density maps of NOx saturated (left) and regenerated (right) Ru(1%)/Na–Y zeolite. The electron density in the sodalite cage and the hexagonal prism is represented and the cation positions are indicated. | ||
Assignment of the type of ion located on these sites was postponed until the system after NOx desorption was studied in detail. As already indicated by 23Na MAS NMR, the cation distribution after NOx desorption in presence of hydrogen was drastically changed, whereas it remained almost identical in the sample where no hydrogen was present during desorption. According to Rietveld refinement after reductive desorption, almost no Na+ ions remained on SV and only very few SIII ions were localized (ESI, Table S5†). The approximately 3 SIII cations per unit cell now resided very close to the framework, at positions typical for SIII ions in dehydrated Na–Y zeolite and should give rise to asymmetry in the 23Na MAS NMR signal. The low occupation of this site made the failure to detect them via NMR plausible. The majority of cations were now found on SII positions close to the six rings of the sodalite cages. Similar to the sample with adsorbed NOx, some electron density was found on position SI′. Sites SII′ in the sodalite cage and SI in the hexagonal prism were found to be empty (Fig. 12). Instead, a significant electron density was detected in the center of the sodalite cage on site U. This position is not occupied by Na+ ions as their favorite position always is in the vicinity of six-rings (SII, SII′, SI′, SII*). The only candidate for occupation of the SU position is, therefore, a reduced Ru atom. The refined number of Ru atoms on this site was ca. 1.5 atoms per unit cell. With this information, the cation distribution in the sodalite cages of NOx saturated Ru(1%)/Na–Y zeolite was revisited. No indication for electron density on SU was detected which indicated that after exposure to the oxidizing conditions during NOx adsorption, the Ru atom changed place, presumably due to oxidation. As possible positions for Ru, now only site SII′ and SI in the double six ring were in question, as these were found to be unoccupied after desorption and the occupation number on SI′ hardly changed. It turned out to be the best refinement result. The best match of refined and experimental cation content was achieved if Ru was assumed to be on site SI inside the hexagonal cavity. Moving the Ru from SU to SI and increasing its charge from 0 to presumably +3 has several significant consequences. This position is in proximity to SIII positions in the supercage so that cations on this side are pushed into the cage, making the adsorbent ready for NOx adsorption. Furthermore, it can be assumed that in the now empty sodalite cages, Na+ ions will occupy sites SII′ and SI′, again in accordance with the observation. An increase of positive charge in the small cavity system apparently causes a general trend for cations in the large cavities to move away from the framework which can explain the extended chain of sodium–water octahedra and the relatively small number of SII* ions for Na–Y. In turn, exposure to reducing conditions will have the opposite effect. A reduction of Ru in the hexagonal cage is impossible because of its large size. So the Ru ion has to migrate to the sodalite cage. The reduction reduces the charge in the small cage system and Na+ ions now preferably occupy positions close to the framework on SII and SIII. This destroys the adsorption site for N2O3 which is released spontaneously rather than in a slow equilibration process when the water chain is retained in absence of reducing conditions.
This scenario implies that Ru not only assumes the role of catalyzing the oxidation of NO to NO2 on Ru particles. Mono-atomically dispersed Ru species in the framework cavities take an active role in creating and destroying a suitable adsorption site for N2O3. The presence of a bidisperse Ru distribution in Na–Y after redox cycles was already suggested by Verdonck et al.45 However, the fact that this Ru inside the zeolites was not seen by EXAFS nor Mossbauer spectroscopy points out that this Ru fraction indeed is very small. According to Rietveld refinement and elemental analysis, at most 1–2 Ru atoms are present per 8 sodalite cages. However, as every sodalite cage is in direct contact with 4 of the 8 supercages, this small number of Ru atoms can nonetheless have drastic impact on the cation distribution in the whole unit cell. A schematic representation of the proposed mechanism is shown in Fig. 13.
 | ||
| Fig. 13 Representation of the proposed NOx adsorption–desorption mechanism of a Ru/Na–Y zeolite during lean/rich cycles based on Rietveld refinement. During lean phase, NOx is adsorbed as N2O3 (blue molecule) in the Na–H2O network in the supercages of the zeolite. The Ru atom, represented as the purple sphere, is situated in the hexagonal prism. During rich phase, the Ru atom is reduced and takes up a place in the sodalite cage. This migration leads to a redistribution of the Na+ cations in the supercage, resulting in a fast release of the adsorbed N2O3 molecules. | ||
Sulfur poisoning is one of the most important causes leading to deactivation of NOx adsorbents. Ru(3%)/Na–Y zeolite was evaluated using gases spiked with 50 ppm of SO2 in the lean or in the rich phase. The catalyst was first pretreated at 450 °C for 1 h under a gas stream of 5% O2, 12% H2O and balance N2. After the pretreatment, the catalyst was cooled to 250 °C and adsorption–desorption cycles started. The lean gas composition was 1000 ppm NO, 5% O2, 12% H2O and balance N2 and rich gas was composed with 1% H2, 12% H2O and balance N2. Over this entire test, the Ru(3%)/Na–Y zeolite was exposed to 270 mg of SO2 g−1, which should be sufficient to observe poisoning, if any. The adsorption capacity of Ru(3%)/Na–Y was unaltered in presence of SO2 (ESI, Fig. S10 and Table S6†). The sulfur tolerance previously observed with Na–Y29–31 was now also observed with Ru/Na–Y.
In a previous publication on NO and NO2 co-adsorption on Na–Y zeolite, CO2 has been shown not to interfere with the N2O3 adsorption chemistry.29 Although the experimental verification has not been made, NO adsorption on Ru/Na–Y zeolite can be expected to be insensitive to CO2.
Ruthenium is also known to have a strong affinity for carbon monoxide.40 The influence of the presence of carbon monoxide on NOx adsorption capacity was investigated in experiments similar to those of the sulfur evaluation. The amounts of 300 ppm and 3% added to oxidizing and reductive gases, respectively, were typical for these respective gases in automotive exhaust.2 The presence of CO did not alter the adsorption and fast desorption behavior, but the capacity of the adsorbent was affected in a peculiar way. Additions of CO to the rich reductive NOx desorption had no negative impact on the NOx capacity, while a noticeable reduction of the adsorption capacity was observed with CO present during the NOx adsorption phase. While CO could interfere with the catalytic NO oxidation on the RuO2/Ru nanoparticles, the refined positions of the Ru atomic species in the zeolite offer an explantion as well. After NOx adsorption under oxidizing conditions, the Ru ion resides in the hexagonal prism where CO molecules can not access it. Reduction in the following rich phase can occur as usual: Ru migrates to the sodalite cages, the adsorption site in the large cages is destroyed and NOx is released. Hence, the presence of CO during desorption does not affect the functioning of the material. However, under oxidizing conditions in the lean phase, Ru now residing in the sodalite cage should be oxidized and then migrate to the hexagonal prism. But the sodalite cage shares a 6-ring window with the supercages of the zeolite so that interaction with CO could occasionally occur. This interaction now prevents Ru from migrating to the hexagonal prism, which in turn jeopardizes formation of the water network wherein NOx can be adsorbed. The presence of CO during the lean oxidizing phase, therefore, drastically reduces the NOx adsorption capacity of the material. In a practical application, the concentration of CO during lean operation of an engine is, however, expected to be kept as low as possible.
In view of the proposed mechanism (Fig. 13), the influence of the Ru loading on the NOx adsorption cycles (Fig. 7) can be revisited. On the sample with lowest Ru content (0.5 wt%), the NO oxidation step is limiting, explaining why the temperature needs to be raised to 300 °C to reach optimum NOx adsorption capacity (Fig. 7). On the sample with high ruthenium loading (3 wt%), the NOx adsorption capacity is more limited probably because of the disturbance of sodium–water nets in presence of Ru clusters inside the zeolite cavities next to the external surface.
In the here reported NOx adsorption–desorption cycles, isothermal conditions have been used for practical reasons. A practical NOx trap can be subjected to important temperature fluctuations. The existence of a temperature optimum (Fig. 7) does not necessarily imply that the adsorbent will spontaneously release NOx upon a temperature excursion away from the optimum. In absence of reducing agent, the NOx desorption kinetics merely based on competition with water vapor are slow.29 Heating in presence of a wet NOx containing gas to temperatures above 450 °C is needed to evacuate the NOx, on analogy with the behavior of Na–Y.27 In practical NOx traps based on Ru/Na–Y with temperatures fluctuating around the optimum, the NOx adsorption capacity is expected to correspond to the maximum capacity determined in isothermal experiments. The only way of achieving fast desorption is under reducing gas mixture. NOx desorption could then effectively be steered by the lean–rich cycle of the engine.
The curious observation that on Ru/Na–Y zeolite several NOx adsorption cycles are needed before reaching stable behavior can also be explained. On a sample pretreated at 450 °C, bulk RuO2 is present which has ineffective oxidation properties. Several redox cycles are needed to establish the required division of the Ru over SU/SI sites and extraneous core-shell RuO2/Ru clusters. Likewise, a Ru(III) ion exchanged Na–Y adsorbent needs a couple of NOx adsorption cycles before becoming effective. Rietveld refinements of Ru/Na–Y samples after Ru ion-exchange and after pretreatment are provided in ESI (Figs. S11–S13 and Tables S7–S8).†
Experimental procedures
Zeolite Na–Y (Zeocat) was loaded with ruthenium by cation exchange using a 100 ml aqueous solution of RuCl3 (99+%, anhydrous, Acros) to which 3 g of Na–Y powder was added. This suspension was stirred at 80 °C for 5 h. During the loading process, the initial pH was set at 8.5 by addition of ammonia to avoid ruthenium precipitation. Using this procedure, ruthenium in solution was quantitatively taken up by the zeolite as verified via ICP analysis. In the sample notation, the Ru content in wt% is indicated. Ru(3%)/Na–Y is the notation of Na–Y zeolite loaded with 3 wt% of ruthenium. After filtration and washing with de-ionized water, the ruthenium loaded Ru/Na–Y zeolite was dried in static air at 60 °C. Na–Y zeolite was loaded with 3 wt% of Pt, Pd, Rh and Ir metal via ion exchange at 80 °C for 5 h using the following complexes; Pt(NH3)4Cl2·H2O, Pd(NH3)4Cl2·H2O, Rh(NH3)5Cl3 and IrCl3·H2O (Alfa Aesar), followed by filtering, washing and drying at 60 °C. Metal loaded Na–Y zeolite powder was compressed under a hydrostatic pressure of 40 MPa and the compacted tablets were crushed and sieved to obtain pellets of 0.25–0.50 mm for use in an adsorbent bed. The zeolite pellets were pretreated at 450 °C for 1 h under a stream of nitrogen with 5% O2 and 3% H2O, unless stated otherwise.Elemental analysis of the Na–Y zeolite was performed by inductively-coupled plasma atomic emission spectroscopy (ICP-AES analyzed at Bodemkundige Dienst van België v.z.w./Leuven/Belgium). The unit cell composition corresponds to Na52Al52Si140O384 resulting in a Si/Al atomic ratio of 2.7.
Cyclic NOx adsorption–desorption experiments were conducted in a dual-line flow system with fixed adsorbent bed contained in a quartz tube. Gases from cylinders were mixed and water vapor was introduced through a thermostatic water evaporator. The lean, oxidizing gas composition was made up of 1000 ppm NO (Air Liquide, 5 ± 0.2 vol% NO in He), 3% H2O, 5% O2 (Air Liquide, 99.995%) and N2 (Air Liquide, 99.999%). Rich, reducing gas was composed of N2 (Air Liquide, 99.999%) with 3% H2O and 1% H2 (Air Liquide, 99.997%). Switching from lean to rich conditions and vice versa was achieved without flow interruption. The temperature during adsorption and desorption was 250 °C, the total gas flow rate 150 ml STP min−1 and the catalyst volume 0.6 ml (400 mg), corresponding to a volumetric hourly space velocity (VHSV) of 15![[thin space (1/6-em)]](https://www.rsc.org/images/entities/char_2009.gif) 000 h−1. Higher space velocities were obtained by decreasing the catalyst amount. The NOx concentration at the in- and outlet of the adsorbent bed was analyzed using an internally heated chemiluminescence detector (CLD 700 EL ht, Eco Physics). The NH3 concentration was measured via UV spectroscopy (Limas 11HW analyzer); N2O with an Uras 26 NDIR analyzer (both ABB).
000 h−1. Higher space velocities were obtained by decreasing the catalyst amount. The NOx concentration at the in- and outlet of the adsorbent bed was analyzed using an internally heated chemiluminescence detector (CLD 700 EL ht, Eco Physics). The NH3 concentration was measured via UV spectroscopy (Limas 11HW analyzer); N2O with an Uras 26 NDIR analyzer (both ABB).
X-Ray diffraction data were collected on a STOE STADI-P powder diffractometer equipped with a curved Ge(111)-monochromator and a linear position sensitive detector (6° 2θ) with a resolution of about 0.01° 2θ at full width-half maximum (FWHM). All powder samples were sealed in glass capillaries (Hilgenberg) under dry nitrogen atmosphere and were measured at room temperature with Cu Kα1-radiation in the range of 4° ≤ 2θ ≤ 95° in Debye–Scherrer geometry with a step size of Δ 2θ = 0.02°. Aside from determination of the present phases, the structure of Ru/Na–Y was refined after ad- and desorption. Samples with a Ru content of 1 wt% were refined containing less ruthenium particles than the 3 wt% Ru containing sample. Rietveld refinements and Difference Fourier Electron Density Analyses were performed using the GSAS/EXPGUI software package. The absorption correction relied on absorption coefficients calculated based on sample composition and packing density. Cation and water occupation numbers were constrained to account for the experimentally determined unit cell composition (ESI, Table S2†).
23Na MAS NMR spectra were recorded on a Bruker Avance DSX400 spectrometer (9.4 T). 5550 scans were accumulated with a recycle delay of 1 s. The samples were packed under inert atmosphere in 2.5 mm rotors. The spinning frequency of the rotor was 20 kHz. Solid NaCl was used as chemical shift reference.
Ru K edge Extended X-ray Absorption Fine Structure (EXAFS) spectroscopy experiments were carried out at the Dubble beamline BM26A at the European Synchrotron Radiation Facility (ESRF) in Grenoble, France. A double crystal monochromator Si(311) was used. The measurements were performed in transmission mode using optimized ionization chambers as detector. The spectra were calibrated using a Pd foil (1st maximum 1st derivative 24350 eV). The samples were prepared by pressing 0.3 g powder for 10 min at 20 kN into tablets (13 × 2 mm). These tablets were placed into a sample holder with kapton film as an X-ray transparent window. The experiments were performed at room temperature. XAS data processing and EXAFS analysis were performed using IFEFFIT49 with the Horae package50 (Athena and Artemis). The hexagonal close packed structure of Ru metal was used as a fitting model for the Ru particles in the zeolite samples (space group P63/mmc with cell parameters a = b = 270.59 pm c = 428.15 pm, α = β = 90°, γ = 120°).51
TEM measurements were performed using a Philips CM200 FEG microscope operating at 200 kV. The sample was crushed between two glass plates and deposited on a Cu TEM grid containing holey C-film, without any contact with solvent.
In the 99Ru Mossbauer experiment a 99Rh(Ru) source was used. The isotope 99Ru is 12% of naturally occurring ruthenium. This source was produced by proton irradiation at the University at Buffalo cyclotron on enriched 100Ru and 101Ru targets. The production mechanism proceeded by using (p, 2n) and (p, 3n) reaction using 30 MeV protons. The 99Rh source produced 90 keV gamma rays which were resonantly absorbed in the isotope of 99Ru present in the natural Ru in the absorber sample. The sample holder was filled under dry nitrogen atmosphere and contained 24 mg natural Ru/cm2. The sample holder was sealed afterwards. The source and the absorber were both mounted inside a low temperature gas exchange cryostat allowing the experiment to be performed at temperatures below 78 K and near 25 K. The calibration for the velocity of the drive was performed using the inner four lines of the six lines in the standard experiment using Fe foil with a source of 57Co(Rh). The calibration experiment with 99Rh(Ru) versus Ru metal powder established the zero velocity signal.
Conclusion
Ru loaded Na–Y zeolite is a unique NOx adsorbent in which NOx is trapped as N2O3 in sodium–water networks extending in the supercages. Oxidation of NO into NO2 using molecular oxygen is effectively performed at 250 °C by extraneous ruthenium metal particles. The presence of a small amount of Ru atoms corresponding to about one to two atoms per unit cell is crucial for obtaining reversible NOx adsorption with high efficiency. Oxidized ruthenium atoms are positioned inside hexagonal prisms and push sodium cations into the supercages to generate NOx adsorption sites. Upon regeneration through reduction, the ruthenium atom jumps to the sodalite cage, causing sodium cations to regain their positions on the framework and eliminating in this way the adsorption site for NOx. Ru/Na–Y is a unique zeolite adsorbent where relocation of a reducible noble metal atom upon oxidation and reduction governs an adsorption cycle. Practically, the Ru/Na–Y adsorbent may find an application in periodic NOx recirculation systems28 or in combination with a downstream SCR catalyst.52Acknowledgements
Part of this work was performed in the EU project AHEDAT. J. A. M. acknowledges the Flemish Government for long-term structural funding (Methusalem). The work is part of a concerted research action (GOA) and supported by Excellence funding (CECAT). S. H. acknowledges the Flemish FWO for a PhD grant. The FWO/NWO is acknowledged for providing beamtime at the DUBBLE beamline and synchrotron radiation facilities at the European Synchrotron Radiation. We would like to thank Dr Serge Nikitenko for assistance in using beamline BM26A. Mossbauer work was performed under a grant from the USDOE (DE-FG02-03ER46064). David Habermacher is acknowledged for his contribution to data on NOx adsorption-desorption cycles.Notes and references
- (a) J. S. Gaffney and N. A. Marley, Atmos. Environ., 2009, 43, 23–36 CrossRef CAS; (b) P. J. Crutzen and V. Ramananthan, Science, 2000, 290, 299–304 CrossRef CAS; (c) J. H. Seinfeld, Science, 1989, 243, 745–752 CAS; (d) D. Grosjean, Environ. Sci. Technol., 1983, 17, 13–19 CrossRef CAS; (e) J. N. Armor, Appl. Catal., B, 1992, 1, 221–256 CrossRef CAS.
- J. Kaspar, P. Fornasiero and N. Hickey, Catal. Today, 2003, 77, 419–449 CrossRef CAS.
- H. S. Gandhi, G. W. Graham and R. W. McCabe, J. Catal., 2003, 216, 433–442 CrossRef CAS.
- S. Matsumoto, Catal. Today, 1996, 29, 43–45 CrossRef CAS.
- Z. Liu and S. I. Woo, Catal. Rev. Sci. Eng., 2006, 48, 43–89 CrossRef CAS.
- A. Fritz and V. Pitchon, Appl. Catal., B, 1997, 13, 1–25 CrossRef CAS.
- R. Brosius and J. A. Martens, Top. Catal., 2004, 28, 119–130 CrossRef CAS.
- Y. Traa, B. Burger and J. Weitkamp, Microporous Mesoporous Mater., 1999, 30, 3–41 CrossRef CAS.
- A. Grossale, I. Nova, E. Tronconi, D. Chatterjee and M. Weibel, J. Catal., 2008, 256, 312–322 CrossRef CAS.
- I. Nova, C. Ciardelli, E. Tronconi, D. Chatterjee and B. Bandl-Konrad, Catal. Today, 2006, 114, 3–12 CrossRef CAS.
- M. A. Gómez-Garcia, V. Pitchon and A. Kiennemann, Environ. Int., 2005, 31, 445–467 CrossRef CAS.
- S. Roy and A. Baiker, Chem. Rev., 2009, 109, 4054–4091 CrossRef CAS.
- W. S. Epling, L. E. Campbell, A. Yezerets, N. W. Currier and J. E. Parks II, Catal. Rev. Sci. Eng., 2004, 46, 163–245 CrossRef.
- I. Nova, L. Castoldi, L. Lietti, E. Tronconi and P. Forzatti, Catal. Today, 2002, 75, 431–437 CrossRef CAS.
- C. Sedlmair, K. Seshan, A. Jentys and J. A. Lercher, J. Catal., 2003, 214, 308–316 CrossRef CAS.
- C. M. L. Scholz, B. H. W. Maes, M. H. J. M. de Croon and J. C. Schouten, Appl. Catal., A, 2007, 332, 1–7 CrossRef CAS.
- H. Y. Huang, R. Q. Long and R. T. Yang, Energy Fuels, 2001, 15, 205–213 CrossRef CAS.
- R. Burch and T. C. Watling, Appl. Catal., B, 1998, 17, 131–139 CrossRef CAS.
- C. Sedlmair, K. Seshan, A. Jentys and J. A. Lercher, Catal. Today, 2002, 75, 413–419 CrossRef CAS.
- S. Elbouazzaoui, X. Courtois, P. Marecot and D. Duprez, Top. Catal., 2004, 30–31, 493–496 CrossRef.
- C.-Y. Sung, R. Q. Snurr and L. J. Broadbelt, J. Phys. Chem. A, 2009, 113, 6730–6739 CrossRef CAS.
- R. Q. Long and R. T. Yang, J. Catal., 2002, 207, 224–231 CrossRef CAS.
- M. Li, Y. Yeom, E. Weitz and W. M. H. Sachtler, J. Catal., 2005, 235, 201–208 CrossRef CAS.
- K. I. Hadjivanov, Catal. Rev. Sci. Eng., 2000, 42(1), 71–144 CrossRef CAS.
- C. Sedlmair, B. Gill, K. Seshan, A. Jentys and J. A. Lercher, Phys. Chem. Chem. Phys., 2003, 5, 1897–1905 RSC.
- U. Bentrup, A. Brückner, M. Richter and R. Fricke, Appl. Catal., B, 1999, 21, 215–220 CrossRef CAS.
- O. Monticelli, R. Loenders, P. A. Jacobs and J. A. Martens, Appl. Catal., B, 1999, 21, 215–220 CrossRef CAS.
- E. Chaize, D. E. Webster, B. Krutzsch, G. Wenninger, C. M WeibelSh. HodjatiPetit, V. Pitchon, A. Kiennemann, R. Loenders, O. Monticelli, P. A. Jacobs, J. A. Martens and B. Kasemo, SAE982593, 1998 Search PubMed.
- A. Sultana, R. Loenders, O. Monticelli, C. Kirschhock, P. A. Jacobs and J. A. Martens, Angew. Chem. Int. Ed., 2000, 39, 2934–2937 CrossRef CAS.
- C. E. A. Kirschhock, A. Sultana, E. Godard and J. A. Martens, Angew. Chem., Int. Ed., 2004, 43, 3722–3724 CrossRef CAS.
- A. Sultana, D. D. Habermacher, C. E. A. Kirschhock and J. A. Martens, Appl. Catal., B, 2004, 48, 65–76 CrossRef CAS.
- J.-F. Brilhac, A. Sultana, P. Gilot and J. A. Martens, Environ. Sci. Technol., 2002, 36, 1136–1140 CrossRef CAS.
- K. Villani, C. E. A. Kirschhock, D. Liang, G. Van Tendeloo and J. A. Martens, Angew. Chem., Int. Ed., 2006, 45, 3106–3109 CrossRef CAS.
- H. Nijs, P. A. Jacobs and J. B. Uytterhoeven, J. Chem. Soc., Chem. Commun., 1979, 180 RSC.
- J. Verdonck, P. A. Jacobs and J. B. Uytterhoeven, J. Chem. Soc., Chem. Commun., 1979, 181 RSC.
- M. D. Cisneros and J. H. Lunsford, J. Catal., 1993, 141, 191–205 CrossRef CAS.
- W. Mahdi, U. Sauerlandt, J. Wellenbüscher, J. Schütze, M. Muhler, G. Ertl and R. Schlögl, Catal. Lett., 1992, 14, 339–348.
- J. Assmann, V. Narkhede, L. Khodeir, E. Löffler, O. Hinrichsen, A. Birkner, H. Over and M. Muhler, J. Phys. Chem. B, 2004, 108, 14634–14642 CrossRef CAS.
- J. F. M. Denayer, A. Depla, W. Vermandel, F. Gemoets, F. van Buren, J. Martens, C. Kirschhock, G. V. Baron and P. A. Jacobs, Microporous Mesoporous Mater., 2007, 103, 11–19 CrossRef CAS.
- S. Calero, D. Dubbeldam, R. Krishna, B. Smit, T. J. H. Vlugt, J. F. M. Denayer, J. A. Martens and T. L. Maesen, J. Am. Chem. Soc., 2004, 126, 11377–11386 CrossRef CAS.
- G. Maurin, D. F. Plant, F. Henn and R. G. Bell, J. Phys. Chem. B, 2006, 110, 18447–18454 CrossRef CAS.
- E. L. Uzunova, H. Mikosch and J. Hafner, THEOCHEM, 2009, 912, 88–94 CrossRef CAS.
- K. Eguchi, M. Watabe, S. Ogata and H. Arai, J. Catal., 1996, 158, 420–426 CrossRef CAS.
- W. B. Li, R. T. Yang, K. Krist and J. R. Regalbuto, Energy Fuels, 1997, 11, 428–432 CrossRef CAS.
- J. J. Verdonck and P. A. Jacobs, J. Chem. Soc., Faraday Trans. 1, 1980, 76, 403–416 RSC.
- J. Assmann, D. Crihan, M. Knapp, E. Lundgren, E. L. Öffler, M. Muhler, V. Narkhede, H. Over, M. Schmid, A. P. Seitsonen and P. Varga, Angew. Chem., Int. Ed., 2005, 44, 917–920 CrossRef CAS.
- K.-N. Hu and L.-P. Hwang, Solid State Nucl. Magn. Reson., 1998, 12, 211–220 CrossRef CAS.
- G. Engelhardt, M. Hunger, H. Koller, and J. Weitkamp, in Studies in Surface Science and Catalysis, ed. J. Weitkamp, H. G. Karge, H. Pfeifer and W. Hölderich, Elsevier, Amsterdam, 1994, Vol. 84, pp. 421–428 Search PubMed.
- M. J. Newville, J. Synchrotron Radiat., 2001, 8, 322–324 CrossRef CAS.
- B. Ravel and M. J. Newville, J. Synchrotron Radiat., 2005, 12, 537–541 CrossRef CAS.
- V. A. Finkel, M. I. Palatnik and G. P. Kovtun, Phys. Met. Metall., 1971, 32, 231 Search PubMed.
- R. Zukerman, L. Vradman, M. Herskowitz, E. Liverts, M. Liverts, A. Massner, M. Weibel, J. F. Brilhac, P. G. Blakeman and L. J. Peace, Chem. Eng. J., 2009, 155, 419–426 CrossRef CAS.
Footnote |
| † Electronic supplementary information (ESI) available: Experimental plots of the NOx adsorption–desorption behavior. NOx adsorption capacity as function of space velocity and reaction temperature. Comparison of the NOx adsorption capacity of the Ru/Na–Y zeolite, with literature data on alternative formulations. Experimental and calculated χ(k) EXAFS functions and fitting parameters. TEM images and XRD patterns. Representations of the sodium cation distribution. A detailed NOx adsorption–desorption pattern of a Ru(3%)/Na–Y zeolite in presence of SO2. Representation of the occupation numbers received after Rietveld refinement. NOx adsorption capacities. Atomic coordinates, occupation parameters, isotropic type and displacements (Å2) and symmetry multiplicity for Ru(3%)/Na–Y zeolite. CIF files of the Ru(1%)/Na–Y zeolite structures after NOx saturation and after regeneration with and without H2 during regeneration. CIF files of the Ru(3%)/Na–Y zeolite structures after Ru ion-exchange and after pretreatment at 450 °C. CCDC reference numbers 795157–795160. For ESI and crystallographic data in CIF or other electronic format see DOI: 10.1039/c0sc00285b |
| This journal is © The Royal Society of Chemistry 2010 |
