The conformer resolved ultraviolet photodissociation of morpholine†
Thomas A. A.
Oliver
,
Graeme A.
King
and
Michael N. R.
Ashfold
*
School of Chemistry, University of Bristol, Bristol, UK BS8 1TS. E-mail: mike.ashfold@bristol.ac.uk; Fax: +44(117) 925 0612; Tel: +44(117) 928 8312
First published on 12th May 2010
Abstract
Distinct sets of resolved photoproducts arising from the photodissociation of two neutral molecule conformers have been observed using H(Rydberg) atom photofragment translational spectroscopy methods. This study focuses on the photodissociation of morpholine, at many wavelengths between 250 nm and 193 nm. Morpholine, a six-membered saturated heterocycle with the molecular formula HN(CH2CH2)2O, exists as two ground state chair conformers that are distinguished by the orientation of the N–H bond (axial or equatorial) relative to the chair ring. Complementary MP2, QCISD and DFT calculations all predict the equatorial chair conformer to be lower in energy by ∼250 cm−1. CASPT2(8/8) calculations confirm that both conformers have similar electronic structures, and share a common first excited singlet state, arising as a result of electron promotion from the nitrogen lone pair orbital (n) to the 3s/σ* orbital centred on the N–H bond, forming a 1nσ* state. Photoexcitation to the 1nσ* potential energy surface (PES) leads to N–H bond extension, with the dissociating flux passing through a conical intersection with the ground state PES en route to morpholinyl radicals and H atom photoproducts. Careful analysis of the resulting H atom time-of-flight spectra reveals peaks attributable to the population of specific vibrational states of morpholinyl products arising from dissociation of both conformers, enabling determination of the energy difference between the two ground conformers of morpholine as 180 ± 50 cm−1, and the N–H bond strengths in both the axial and equatorial conformers as 33200 ± 50 cm−1 and 33380 ± 50 cm−1, respectively.
1. Introduction
Photodissociation experiments, from their inception, have been aimed not only at discovering and understanding dynamically adiabatic and non-adiabatic processes, but also at controlling them. Femtosecond pump–probe coherent control experiments, wherein the exciting pulse is modified to interact with specific excited state wavefunctions, constructively or destructively, so as to sample different parts of excited state potential energy surfaces (PESs),1,2 constitute one contemporary example. On the nanosecond time scale, vibrationally mediated photodissociation (VMP) – wherein excitation proceeds via a selected excited vibrational level of the ground3 (or excited4,5) state – can influence the electronic branching of photoproducts, or enable specific bond cleavage.6–8 Selective vibrational excitation of reactants in bimolecular scattering experiments has similarly been shown to modify the nascent product distributions.9If, however, the molecule of interest has more than one low-lying conformation, photodissociation will likely yield photoproducts from each of these different conformers. Further, if the photodissociation dynamics of all the conformers are similar, resolving conformer-specific photoproducts will prove to be challenging. Conformers are abundant in nature, with many biological processes only able to occur in specific conformations.10 Thus it is both significant and a worthwhile challenge to seek to detect, and to resolve, photodissociation from different conformers, particularly as gas phase photodissociation experiments move towards studying larger, more biologically relevant and conformationally flexible molecules.11
Prior examples of such studies are rare. Photofragment translational spectroscopy (PTS) studies of the spin–orbit excited iodine atoms resulting from 304 nm photolysis of iodocyclohexane revealed a bimodal kinetic energy distribution, that has been interpreted in terms of dissociation from axial and equatorial chair conformers of the parent. Dissociation of the latter was deduced to result in a greater partitioning of the available energy into internal excitation of the cyclohexyl radical partner.12 Resonance enhanced multiphoton ionisation (REMPI) offers a route to conformer specific ionisation, by tuning the excitation laser wavelength to be resonant with just one specific conformer.11,13–15 For example, 2 + 1 REMPI (via the 3s Rydberg state) enables selective ionization of either the cis or gauche conformer of propanal.14 A second laser pulse (of a wavelength that is unable to ionise the neutral parent conformers) is then used to photodissociate the conformer-selected cation, and the resulting fragment cations monitored by (sliced) velocity map ion imaging methods. The photodissociation dynamics of these cations were found to be conformer dependent. In the case of the gauche conformer, C–H bond cleavage from the carbonyl C atom dominates whereas, in the cis isomer, the main decay channel involves intramolecular rearrangement to the hydroxyallyl cation and subsequent C–H loss from the carbonyl group. Such experiments were only possible over a very limited range of dissociation energies (∼400 cm−1). In the cases of both neutral iodocyclohexane and the propanal cation, distinguishing photoproducts from the respective conformers was simplified by the conformer-specific energy disposals. Had both conformers displayed similar dissociation dynamics, it is unlikely that the available energy resolution would have been sufficient to distinguish their respective photoproducts.
The present study addresses the gas-phase ultraviolet (UV) photochemistry of the neutral morpholine molecule. Morpholine is a six-membered saturated heterocyclic compound, containing both amine and ether functional groups, with the molecular formula: HN(CH2CH2)2O. Morpholine finds uses as a chemical precursor or catalyst in many organic syntheses – due the nucleophilic nitrogen lone pair. It has a large ring strain energy (relative to that in cyclohexane, piperidine and piperazine),16 and exhibits catalytic activity in the cleavage and isomerisation of dinucleotides.17 Substituted morpholines display anaesthetic properties,18 and the morpholine derivative, amorolfine, finds use as an antifungal drug.19
Early infrared (IR) spectroscopy studies in solution established that, like cyclohexane, the ground state geometry of morpholine is a chair conformer. Unlike bare cyclohexane, morpholine has two low-lying conformers, with the N–H bond lying either axial (AX) or equatorial (EQ) relative to the six-membered chair ring (see Fig. 1a).20,21 Evidence for two conformeric forms was supported by early ab initio studies, which predicted the EQ conformer to be the lower energy form and enabled assignment of the room temperature IR spectrum.22 These studies also identified the boat conformer, lying ∼3000 cm−1 higher in energy, which made no contribution to the IR spectrum. However, microwave studies only revealed evidence for the EQ chair conformer.23,24 Sloan and Kewley reconcile this observation by noting that, though the AX and EQ conformers have similar overall dipole moments, μa is ∼4 times larger in the EQ conformer and it is this component that carries the most obvious (a-type) features in the microwave spectrum.23
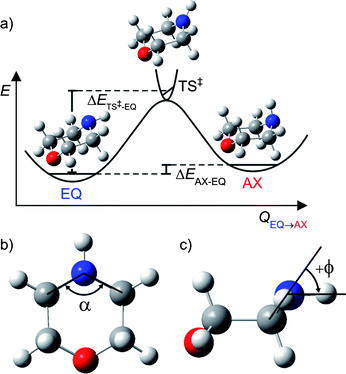 | ||
| Fig. 1 (a) Schematic potential energy profile along the reaction coordinate (QEQ→AX) for interconversion between the EQ and AX conformers of ground state morpholine; (b) definition of α, the C–N–C internal angle; (c) illustration of ϕ, the angle made by the N–H bond with the C–N–C plane. | ||
Little is known about the electronic structure of morpholine, and there is only one reported photodissociation study, at 193 nm.25 This laser induced fluorescence based study revealed the formation of OH products in the ground electronic and vibrational states, with a Boltzmann rotational state population distribution. The mechanism for OH production was presumed to involve initial population of an excited state of the parent molecule and subsequent internal conversion back to the ground state, whereupon the excess internal energy led to C–O ring-opening, hydrogen migration to the oxygen and subsequent C–OH bond cleavage.
Here we report time-of-flight (TOF) spectra of H atom products formed following photoexcitation of a jet-cooled morpholine sample at many different wavelengths (λphot) in the range 250 ≥ λphot ≥ 210 nm, and at 193 nm, measured using the H (Rydberg) atom (HRA)–PTS technique. Structure resolved in these TOF spectra is attributed to the population of specific vibrational levels of the morpholinyl partner fragment formed upon N–H bond fission from both conformers. Supporting density functional theory (DFT), quadratic configuration interaction singles and doubles (QCISD) and Møller–Plesset perturbation theory (MP2) calculations explore the barrier to interconversion between the two ground state conformers and the energy difference between them. Complete active space with second-order perturbation theory using an eight electrons in eight orbitals active space (CASPT2(8/8)) calculations provide a three dimensional PES (as functions of the N–H stretch coordinate (RN–H) and the angle, ϕ, that the N–H bond makes with the C–N–C plane), that illustrates the PE landscape for both conformers in both the ground and first singlet excited states. The latter (1nσ*) state arises as a result of electron promotion from the highest occupied non-bonding (n) orbital (the nitrogen lone pair) to a mixed Rydberg (3s)/antibonding valence (σ*) orbital that increasingly localises on the N–H bond as RN–H is increased. Similarities and differences between the photodissociation dynamics of morpholine and ammonia are discussed in terms of sp2 or sp3 hybridisation at the nitrogen centre.26
2. Experimental methods
The HRA-PTS experimental apparatus has been detailed previously,27 and full details are available online in the ESI.† Briefly, a sample of morpholine (≥99.0%, Sigma Aldrich, room temperature vapour pressure) was seeded in ∼700 Torr of argon and skimmed to form a molecular beam which was intersected by a tunable UV photolysis pulse generated by frequency doubling the output of a Nd-YAG pumped dye laser (250 ≥ λphot ≥ 210 nm) or by use of an ArF excimer laser (193 nm). After a time delay δt = 10 ns, H atom photoproducts in the interaction region (defined by the intersection volume between the photolysis laser radiation and the molecular beam) were tagged using a doubly-resonant two photon excitation scheme involving, first, Lyman-α (121.6 nm) excitation to the 2p state, followed by excitation at ∼366 nm to a high n Rydberg state (n ∼ 80). Any prompt ions formed from unintentional vacuum UV or multiphoton induced ionisation processes are removed by biasing an extractor plate assembly that straddles the interaction region. Tagged H (Rydberg) atoms that recoil with velocities along the TOF axis travel to a Johnston multiplier detector where they are field ionised and their arrival time recorded. The polarisation vector, εphot, of the photolysis laser radiation was ordinarily aligned at an angle θ = 90° to the TOF axis. As before,28 TOF (and thus kinetic energy) dependent recoil anisotropy parameters, β, could be determined by recording spectra with εphot aligned at θ = 0°, 54.7° and 90° to the TOF axis.3. Computational methods
Ground state geometry optimisations and vibrational wavenumbers (with anharmonic corrections) for morpholine and the morpholinyl radical were calculated using DFT and the hybrid functional, B3LYP, with a Pople basis set of triple ζ quality: 6-311+G** in the Gaussian 03 suite.29 QCISD, MP2 as well as the DFT functionals B3LYP, BB1K, BMK, B972, MPWB1K were also used to optimise both ground state conformers and the linking transition state (TS) with the same basis set; these specific functionals were chosen on the basis of their recognised performance at calculating barrier heights.30,31 QCISD with perturbative triples (QCISD(T)) nor coupled-cluster with singles, doubles and perturbative triples (CCSD(T)) calculations were undertaken, due to their high computational cost. Normal mode frequencies were calculated at each optimised geometry allowing the zero-point-energy (ZPE) corrected barrier heights to be computed. This allows determination of the difference in energy of the two lowest energy conformers, ΔEAX–EQ, and the barrier to their interconversion, ΔETS–EQ‡ (see illustration of ΔEs in Fig. 1(a)).Complete active space self consistent field (CASSCF) calculations were performed in MOLPRO Version 2006.1,32 using an 8/8 active space consisting of the C–N–C σ orbital, the ring C–C σ orbital, the N–H σ bond, the nitrogen lone pair, n, and corresponding C–N–C σ* and ring C–C σ* virtual orbitals as well as the nitrogen centred 3s Rydberg orbital that, upon extension of RN–H, evolves into a purely N–H σ*, and a nitrogen centred 3p Rydberg orbital. Dunning's augmented correlation consistent basis set of triple ζ quality: aug-cc-pVTZ was used for nitrogen and oxygen atoms, and a cc-pVTZ basis was used on carbon and hydrogen atoms. Excited states were optimised at the ground state equilibrium RN–H bond length, allowing the rest of the structure to relax using CASSCF(8/8); CASPT2(8/8) single point energies were then taken on these optimised geometries. For all CASPT2 calculations the carbon, oxygen and nitrogen 1s electrons were frozen and a small imaginary level shift was used to avoid intruder state problems. A three dimensional (3-D) PES for the ground (S0) state and first 1nσ* excited state – varying both RN–H and ϕ, the angle made by the N–H bond with the C–N–C plane (see Fig. 1(c)) – were calculated at the same level of theory, but with the ring geometry fixed at that of the ground state EQ conformer (which was found to be very similar to that of the AX conformer).
4. Results
4.1 Computational results
| Method | ΔEAX–EQ/cm−1 | ΔETS–EQ‡/cm−1 |
|---|---|---|
| B3LYP | 231 | 1354 |
| BMK | 272 | 1503 |
| MPWB1K | 259 | 1444 |
| B972 | 206 | 1433 |
| BB1K | 345 | 1545 |
| QCISD | 276 | 1894 |
| MP2 | 212 | 1640 |
The geometry of the TS for all methods found ϕ ∼ 0° (although slightly negative), indicating a transition state lying slightly towards the AX conformer. As expected, the imaginary frequency for the TS was found to be the N–H wag along the reaction coordinate QEQ→AX. This mode has a′ symmetry with respect to the plane of the parent (CS symmetry). The TS also reflects a modest increase in the C–N–C internal angle α (shown in Fig. 1(b)) and lengthening of the N–H bond. This was found to occur in the majority of methods used; the values for RN–H, ϕ and α at each different level of theory are listed in the ESI.†
As Table 1 shows, the forward barrier height along the reaction coordinate QEQ→AX was found to vary between 1354 cm−1 ≤ ΔETS–EQ‡ ≤ 1894 cm−1. DFT based methods yield a mean value <ΔETS–EQ‡> = 1456 cm−1, whereas ab initio based methods give a value some 300 cm−1 higher, <ΔETS–EQ‡> = 1767 cm−1, reinforcing a general finding that DFT based methods tend to underestimate barrier heights.30
Under jet-cooled conditions, and assuming (i) a temperature of ∼15 K (i.e. a mean parent rotational energy of ∼15 cm−1), (ii) that the energy barrier to interconversion lies in the range 1354 cm−1 ≤ ΔETS–EQ‡ ≤ 1894 cm−1 and (iii) that the difference in energy between the conformers is 206 cm−1 ≤ ΔEAX–EQ ≤ 345 cm−1, the parent molecules can be expected to freeze into two conformeric forms and not to interconvert freely.
| State | Optimised excitation energy/eV | |
|---|---|---|
| Conformer | ||
| Equatorial | Axial | |
| 1 nσ* | 5.10 | 5.16 |
| 3p(Rydberg)←n | 6.22 | 6.29 |
Fig. 2 shows the variation in PE (calculated at the CASPT2(8/8) level) for the S0 and 1nσ* states plotted as functions of RN–H and ϕ. Clearly the 1nσ* PES is repulsive with respect to RN–H and, in the vertical Franck–Condon (vFC) region, exhibits a well (∼700 cm−1 in depth at this level of theory) associated with the interaction of the 3s Rydberg state and the N–H σ* valence state. The S0 state shows a double minimum potential at the equilibrium RN–H value, associated with the two conformers at ϕ = −55° and +50°, whereas the 1nσ* state exhibits a single well with a minimum at ϕ = 0°. It is also evident that, upon excitation to the 1nσ* state, passage through the 1nσ*/S0 conical intersection (CI) requires that the N–H bond lies in the C–N–C plane and leads to a common (for both conformers) set of H + morpholinyl(![[X with combining tilde]](https://www.rsc.org/images/entities/char_0058_0303.gif) ) products. If this constraint is not met, i.e.ϕ ≠ 0°, dissociation on the 1nσ* PES will follow the adiabatic path and attempt to reach the H + morpholinyl(Ã) product limit. This asymptote is calculated (at the CASPT2(8/8) level) to lie ∼1.34 eV above the lowest dissociation limit, and thus is energetically accessible only at λphot < ∼220 nm. These PESs are very reminiscent of those of ammonia;26 both 1nσ* states show a shallow (3s Rydberg) well in the vFC region, and both S0 states display a double minimum potential in ϕ. In ammonia, the lowest vibrational level is split into 0+ and 0− components due to the symmetry of the potential associated with the pyramidal inversion. This is not the case in morpholine, since the minima associated with the two ground state conformers are non-degenerate.
) products. If this constraint is not met, i.e.ϕ ≠ 0°, dissociation on the 1nσ* PES will follow the adiabatic path and attempt to reach the H + morpholinyl(Ã) product limit. This asymptote is calculated (at the CASPT2(8/8) level) to lie ∼1.34 eV above the lowest dissociation limit, and thus is energetically accessible only at λphot < ∼220 nm. These PESs are very reminiscent of those of ammonia;26 both 1nσ* states show a shallow (3s Rydberg) well in the vFC region, and both S0 states display a double minimum potential in ϕ. In ammonia, the lowest vibrational level is split into 0+ and 0− components due to the symmetry of the potential associated with the pyramidal inversion. This is not the case in morpholine, since the minima associated with the two ground state conformers are non-degenerate.
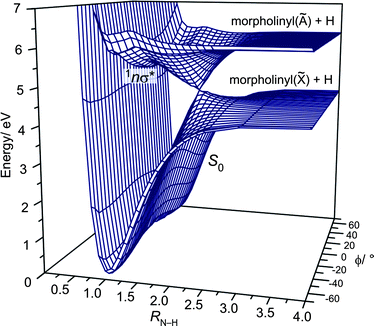 | ||
| Fig. 2 CASPT2(8/8) 3-D PESs for the S0 and 1nσ* states of morpholine plotted as functions of RN–H and ϕ. | ||
4.2 Photoionisation mass spectrometry
The ion TOF mass spectrum obtained at λphot = 250 nm displays one clear mass peak corresponding to m/z 87 (morpholine+). Introduction of Lyman-α photons (and the 365 nm radiation from which they derive) at δt = 10 ns yields an additional large ion signal with m/z 1 (H+), as shown in the ESI.† These are still the only significant mass peaks observed when λphot is reduced to 193 nm.† SenGupta et al. observed OH loss from morpholine.25 Lyman-α photons provide insufficient energy (10.2 eV) to ionise the OH radical, but the absence of any significant yield of any other fragments leads us to conclude that OH loss is likely to be a minor channel.4.3 H(Rydberg) atom photofragment translational spectra
H-atom TOF spectra were recorded in the range 250 ≥ λphot ≥ 210 nm and at 193 nm. These spectra were converted into total kinetic energy release (TKER) spectra viaeqn (1):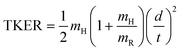 | (1) |
Fig. 3 shows illustrative TKER spectra obtained at five photolysis wavelengths in the range 250 ≥ λphot ≥ 193 nm. At the longest wavelength, λphot = 250.0 nm, the spectrum (Fig. 3(a)) is dominated by a structured feature peaking at TKER ∼6000 cm−1, with a leading edge that extends to TKERmax ∼ 8000 cm−1 and a tail stretching to TKER ∼ 0 cm−1.
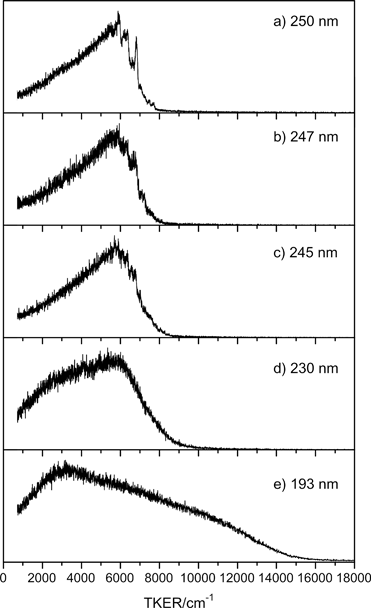 | ||
| Fig. 3 TKER spectra derived from H atom TOF measurements following photolysis of morpholine at λphot = (a) 250.0 nm, (b) 247.0 nm, (c) 245.0 nm, (d) 230.0 nm and (e) 193.3 nm. εphot for all these data was aligned at θ = 90° to the TOF axis. | ||
Excitation at shorter wavelengths, λphot = 247.0 and 245.0 nm (Fig. 3(b) and (c)), yields similar spectra, still with evident vibrational structure and a slight shift in TKERmax. By λphot = 230.0 nm (Fig. 3(d)), the structure has coalesced. The envelope is still peaked at TKER ∼ 6000 cm−1, but the relative yield of slower fragments has increased – possibly indicating additional vibrational excitation of the partner co-fragment. TKER spectra recorded between 230 ≥ λphot ≥ 210 nm (not shown) are broadly similar to that measured at λphot = 230.0 nm. Excitation at λphot = 193 nm (Fig. 3(e)) yields a distribution extending to TKERmax ∼ 16![[thin space (1/6-em)]](https://www.rsc.org/images/entities/char_2009.gif) 000 cm−1, but with a dominant slow component peaking at TKER ∼ 3000 cm−1.
000 cm−1, but with a dominant slow component peaking at TKER ∼ 3000 cm−1.
Converting TKER spectra into spectra of the internal energy (Eint) of the radical co-fragment is normally relatively trivial since it is usually safe to assume that only one species within the molecular beam is responsible for any measured H atom TOF spectrum. Here, however, we expect two conformers to be present, and that both will be able to contribute H atoms to the TOF spectrum. From the CAPST2(8/8) calculations, we know that the AX conformer lies slightly higher in energy, and that both conformers share the same 1nσ* dissociative state and correlate to the same radical products. Thus we might anticipate preferential absorption by the AX conformer at the very longest excitation wavelengths, and that the fastest peak in the TKER spectrum measured at such wavelengths (e.g. λphot = 250 nm) would correspond to formation of H + morpholinyl(, v = 0) products from dissociation of the jet cooled AX conformer. By conservation of energy:
| Ephot + Eint(AX)(morpholine) = TKER + D0(AX)(H–morpholinyl) + Eint(AX)(morpholinyl) | (2) |
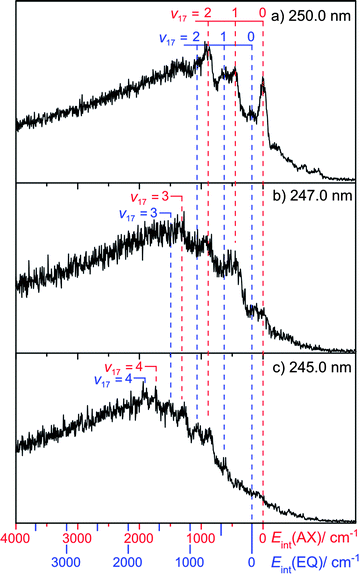
Fig. 4 shows selected TKER spectra re-plotted as functions of Eint, calculated assuming the above D0(AX)(H–morpholinyl) value. Fig. 4(a) shows data recorded at λphot = 250.0 nm. As discussed above, the peak at Eint = 0 is assigned to formation of morpholinyl(, v = 0) products, from photolysis of the AX conformer. Several smaller peaks are evident at negative internal energy (i.e. to the right of Eint = 0). Neither the relative intensities of these peaks, nor the inter-peak spacings, can be reconciled to calculated morpholinyl radical modes (see ESI†). However, they can be understood in terms of photolysis from ground state conformers carrying vibrational excitation in the low frequency N–H wag containing mode, ν21(a′). FC activity in parent mode ν21 is not surprising, given the change in ϕ upon σ*←n excitation.
 | ||
| Fig. 4 Internal energy spectra of morpholinyl radicals formed by photolysis of morpholine at λphot = (a) 250.0 nm, (b) 247.0 nm and (c) 245.0 nm. Peaks are assigned from calculated (B3LYP/6-311+G**) anharmonically corrected wavenumbers listed in the ESI.† | ||
The most intense peaks at Eint > 0 can be assigned to a progression in radical mode ν17, a C–N–C and C–O–C ring breathing motion (see Fig. 5). The calculated minimum energy geometries of both ground state conformers, and of the radical product, are very similar in terms of C–N–C internal angle α, C–O–C internal angle, and the C–C, N–C and O–C bond lengths. The source of this vibrational activity can be understood in terms of forces acting post photo-excitation but prior to encountering the 1nσ*/S0 CI, activated as the hybridisation at the nitrogen centre changes from sp3 to sp2 on σ*←n promotion – with consequent changes in ϕ and α.
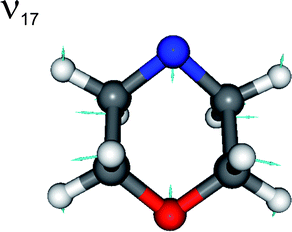 | ||
| Fig. 5 Nuclear motions associated with the ν17 mode of the morpholinyl radical. | ||
This leaves three unassigned peaks in the Eint spectrum (Fig. 4(a)) that are not readily assignable from the calculated vibrational wavenumbers. The spacing between the v = 0(axial) and the next peak in the Eint spectrum is 180 cm−1. Consider the EQ conformer. Its absorption will be slightly blue-shifted relative to that of the AX conformer; it will therefore display a relatively smaller absorption cross-section at the longest excitation wavelengths. D0(H–morpholinyl) will also be slightly larger for the EQ conformer and, at any specific λphot, a given product peak will appear at correspondingly smaller TKER than that from the AX conformer. Thus the 180 cm−1 spacing most likely corresponds to ΔEAX–EQ. Our DFT, QCISD and MP2 calculations place this value in the range 206 cm−1 ≤ ΔEAX–EQ ≤ 345 cm−1, close to that observed. Taking ΔEAX–EQ = 180 cm−1, we assign the three remaining peaks to a progression in product mode ν17 arising from photolysis of the EQ conformer. From this, we determine the bond strength of this conformer as: D0(EQ)(H–morpholinyl) = 33380 ± 50 cm−1.
The Eint spectrum obtained at 247.0 nm (Fig. 4(b)) shows a longer progression, extending to v17 = 3. Guided by these assignments, the Eint spectrum obtained when exciting at 245.0 nm (Fig. 4(c)) is most readily assigned in terms of population of product levels with v17 ≤ 4, but now with little evidence of v = 0 products from photolysis of either the AX or EQ conformers. The extra photon energy is converted not into product translational energy, but into additional internal (vibrational) energy of the morpholinyl radical. No structure attributable to population of any product mode other than ν17 is discerned.
TOF measurements taken at λphot = 249.0 and 230.0 nm, with εphot aligned at θ = 0, 90, 54.7°, reveal that the structured features at highest TKER have an associated recoil anisotropy parameter β ∼ −0.5. This is consistent with the (partial) perpendicular orientation of the calculated (CASPT2) σ*←n transition dipole moment relative to the N–H bond, and implies that bond fission is prompt, occurring on a timescale that is faster than the parent molecular rotational period.
5. Discussion
Introduction of an N–H moiety within a saturated heterocycle allows for conformational complexity; the N–H bond in ground state morpholine can lie axial or equatorial relative to the chair backbone. Such conformational flexibility is not possible in secondary amines constrained within aromatic heterocycles (e.g. imidazole): the N–H bond is instead fixed in the ring plane by conjugation of the nitrogen lone pair into the aromatic π-system.27,33–36 In the case of imidazole, therefore, molecules photo-excited to the equivalent 1πσ* PES pass directly through the 1πσ*/S0 CI (leading to H + imidazolyl() products) without any significant out-of-plane distortion of the ring geometry. The vibrational excitation observed in the imidazolyl radical co-fragments is concentrated in several in-plane a′ modes, reflecting the modest changes in geometry on progression from ground state to radical and are seemingly not influenced by any non-adiabatic dynamics in the vicinity of the 1πσ*/S0 CI.33 The TKER spectra measured following photodissociation of morpholine, in contrast, reveal a progression in a single product mode: ν17. Both conformers of ground state morpholine have ϕ ≠ 0°. Formation of H + morpholinyl() products requires that the dissociating flux traverses the region of the 1nσ*/S0 CI at extended RN–H with ϕ = 0°, i.e. that the N–H bond moves into the C–N–C ring plane, which will likely be accompanied by an expansion of α. This geometry change, which must occur after vertical excitation to the 1nσ* PES but before encountering the 1nσ*/S0 CI, serves to activate the parent nuclear motions that, asymptotically, correlate with product mode ν17. Parallels with the much studied photodissociation dynamics of ammonia following σ*←n excitation are obvious. In the latter case, dissociation to ground state H + NH2() products requires planarity as the dissociating molecule samples the corresponding 1nσ*/S0 CI at extended RN–H, but the topology of the 1nσ* PES also encourages out-of-plane vibrational motion that maps into eventual a-axis rotation of the product NH2.26 Morpholine is a much more rigid, constrained entity. Wagging motion of the N–H group in this case must largely map through into orbital angular momentum of the departing H atom, but the observed activity in product mode ν17 is a reminder of the accompanying change in hybridisation (and minimum energy geometry) at the nitrogen centre. The reduced N–H bond strength in morpholine (relative to that in ammonia) can be understood by recognising that the NH2 radical has no need to make any geometric concessions to minimize ring strain.
Dissociating morpholine molecules that fail to meet the ϕ = 0° constraint in the region of the 1nσ*/S0 CI, will instead encounter an avoided crossing, and attempt to follow the adiabatic PES correlating to H + morpholinyl(Ã) products. The present calculations suggest that this asymptote is open, energetically, once λphot < ∼220 nm. Thus at longer excitation wavelengths, any molecules following this adiabatic potential at large RN–H must be drawn back into the CI region. If the geometry has evolved sufficiently to meet the requirement that ϕ = 0°, the molecule can pass through the CI to the ground state PES – whilst RN–H is extending or compressing. If not, the process will be repeated. The net result of these ‘frustrated’ dissociations is likely to be a delayed ‘trickle’ of H + morpholinyl() products – with, on average, rather low associated TKER. Such dissociation products are evident in Fig. 3(a)–(d) where, in each case, the distribution of product TKERs extends down to ∼0 cm−1.
Formation of electronically excited morpholinyl(Ã) products is certainly possible, on energetic grounds, at λphot = 193 nm. Observation of any such products in Fig. 3(e) is however hampered by slow H atoms formed in association with morpholinyl()high v products, as well as by any H atoms arising from possible (unintended) multiphoton absorptions.34
The TOF-mass spectra measured at λphot = 250 nm and 193 nm reveal little parent ion fragmentation, and a large H+ ion signal only after introduction of Lyman-α radiation. The present CASPT2(8/8) ab initio calculations find no evidence for direct ring-breaking mechanisms in either of the first two excited states of morpholine. This is somewhat surprising, considering that morpholine has a larger ring strain than either cyclohexane or piperidine,16 and has no double bonds to help reinforce the ring. Nonetheless, these findings lend support to the earlier suggestion that OH formation25 is a minor channel, that occurs after internal conversion to the S0 PES.
Finally we note that morpholine provides yet another illustration of the ubiquitous nature of 1πσ* (and 1nσ*) states in driving excited state photochemistry. As in numerous other hydride molecules, excitation to a σ* orbital localised on an X–H (X = N, O, S, P, C) bond results in cleavage of that bond and dynamically determined energy release in the resulting products.37
6. Conclusions
Direct dissociation of two conformers of morpholine has been demonstrated following excitation at numerous wavelengths in the range 250 nm ≥ λphot ≥ 210 nm and at 193 nm. Analysis of the resulting H-atom TOF spectra has allowed determination of the energy splitting between the axial and equatorial conformers of morpholine in its ground electronic state, ΔEAX–EQ = 180 ± 50 cm−1, and the N–H bond strengths of both conformers: D0(AX) = 33200 ± 50 cm−1 and D0(EQ) = 33380 ± 50 cm−1. This study is the first in which two neutral conformers have been photodissociated simultaneously and their respective photoproducts unambiguously distinguished.The photodissociation dynamics of morpholine show parallels with that of ammonia, but with added complications from the two non-degenerate ground state conformers. Upon photo-excitation to the dissociative 1nσ* state, the hybridisation at the nitrogen centre changes from sp3 to sp2 and the N–H bond in both conformers of morpholine will (a) start to extend and (b) move into the C–N–C plane, in order to allow passage through the 1nσ*/S0 CI and dissociation to H + morpholinyl() products. Molecules that fail to meet the ϕ = 0° constraint in the region of this CI will evolve towards H + morpholinyl(Ã) products but, lacking sufficient energy to reach this threshold (λphot < 220 nm), they must revisit the upper cone of the CI and eventually funnel through to the ground state PES and dissociate, yielding H + morpholinyl() products with low TKERs.
The foregoing interpretation is supported by 3-D CASPT2(8/8) calculations. A range of DFT functionals and ab initio methods (QCISD and MP2) were used to predict ZPE corrected values for ΔEAX–EQ and ΔETS–EQ‡. The preferred theoretical results predict ΔEAX–EQ within ∼20 cm−1 of the value determined experimentally. DFT methods were found to perform comparably to ab initio based methods for the ΔEAX–EQ splitting, but to predict consistently lower ΔETS–EQ‡ values; no experimental or theoretical value for this energy barrier to conformer interconversion has been reported previously.
Despite displaying essentially identical photodissociation dynamics, the high resolution afforded by the HRA-PTS technique allows resolution of products arising from the different conformers of morpholine. As the thrust of photodissociation experiments moves towards progressively larger and more biologically relevant systems, the ability to achieve specific product state detection will become ever more necessary. Even with HRA-PTS, however, the resolution is limited, and other methods will be required to allow conformer specific photodissociation studies. One possibility involves selective IR pumping of a vibration (e.g. the N–H stretch) in the conformer of choice. Subsequent UV excitation, at near-threshold energies, would promote just the vibrationally excited subset of the total population (i.e. just the one conformer) to energies above the dissociation limit. As the groups of Crim,3 Suits,4 Kim5 and others have shown, selective vibrational excitation can also cause the molecule to sample different parts of the excited state PES, however, and thereby influence the photodissociation dynamics and the branching within the photoproducts.
Acknowledgements
The authors are grateful to the EPSRC for the award of a programme grant EP/G00224X, and to Professor J. N. Harvey, K. N. Rosser and Dr J. A. Smith for their many and varied contributions to this work.References
- L. Zhu, V. Kleiman, X. Li, P. Shao, K. Lu, K. Trentelman and R. J. Gordon, Science, 1995, 270, 77 CrossRef CAS.
- T. Brixner and G. Gerber, ChemPhysChem, 2003, 4, 418 CrossRef CAS.
- M. L. Hause, Y. H. Yoon and F. F. Crim, J. Chem. Phys., 2006, 125, 174309 CrossRef.
- M. H. Kim, B. D. Keskiw, L. Shen and A. G. Suits, J. Phys. Chem. A, 2007, 111, 7472 CrossRef CAS.
- D.-S. Ahn, J. Lee, J.-M. Choi, K.-S. Lee, S. J. Baek, K. Lee, K.-K. Baeck and S. K. Kim, J. Chem. Phys., 2008, 128, 224305 CrossRef.
- R. L. Vander Wal, J. K. Scott, F. F. Crim, K. Weide and R. Schinke, J. Chem. Phys., 1991, 94, 3548 CrossRef CAS.
- Y. Cohen, I. Bar and S. Rosenwaks, J. Chem. Phys., 1995, 102, 3612 CrossRef CAS.
- Y. Ganot, A. Golan, X. Z. Sheng, S. Rosenwaks and I. Bar, Phys. Chem. Chem. Phys., 2003, 5, 5399 RSC.
- C. J. Annesley, A. E. Berke and F. F. Crim, J. Phys. Chem. A, 2008, 112, 9448 CrossRef CAS.
- R. J. Bridges, M. S. Stanley, M. W. Anderson, C. W. Cotman and A. R. Chamberlin, J. Med. Chem., 1991, 34, 717 CrossRef CAS.
- J. A. Stearns, S. Mercier, C. Seaiby, M. Guidi, O. V. Boyarkin and T. R. Rizzo, J. Am. Chem. Soc., 2007, 129, 11814 CrossRef CAS.
- J. E. Freitas, H. J. Hwang, A. B. Ticknor and M. A. El-Sayed, Chem. Phys. Lett., 1991, 183, 165 CrossRef CAS.
- M. H. Kim, L. Shen and A. G. Suits, Phys. Chem. Chem. Phys., 2006, 8, 2933 RSC.
- M. H. Kim, L. Shen, H. Tao, T. J. Martinez and A. G. Suits, Science, 2007, 315, 1561 CrossRef CAS.
- L. Zhang, Y. Pan, H. Guo, T. Zhang, L. Sheng, F. Qi, P.-K. Lo and K.-C. Lau, J. Phys. Chem. A, 2009, 113, 5838 CrossRef CAS.
- S. P. Verevkin, J. Chem. Thermodyn., 1998, 30, 1069 CrossRef CAS.
- R. Breslow and R. Xu, Proc. Natl. Acad. Sci. U. S. A., 1993, 90, 1201 CAS.
- O. Nieschulz, I. Hoffman and K. Popendiker, Arzneim. Forsch., 1958, 8, 539 CAS.
- A. K. Gupta, D. N. Sauder and N. H. Shear, J. Am. Acad. Dermatol., 1994, 30, 911 CrossRef CAS.
- B. N. Narziev and M. Nurulloev, Zh. Strukt. Khim., 1986, 27, 109 CAS.
- R. A. Friedel and D. S. McKinney, J. Am. Chem. Soc., 1947, 69, 604 CrossRef CAS.
- A. L. Capparelli, J. Maraňon, O. M. Sorarrain and R. R. Figueira, J. Mol. Struct., 1974, 23, 145 CrossRef CAS.
- J. J. Sloan and R. Kewley, Can. J. Chem., 1969, 47, 3453 CrossRef CAS.
- O. Indris, W. Stahl and U. Kretschmer, J. Mol. Spectrosc., 1998, 190, 372 CrossRef CAS.
- S. SenGupta, A. Kumar, P. D. Naik and P. Bajaj, Chem. Phys. Lett., 2008, 465, 197 CrossRef CAS.
- D. H. Mordaunt, M. N. R. Ashfold and R. N. Dixon, J. Chem. Phys., 1996, 104, 6460 CrossRef CAS; D. H. Mordaunt, M. N. R. Ashfold and R. N. Dixon, J. Chem. Phys., 1996, 104, 6472 CrossRef CAS.
- B. Cronin, M. G. D. Nix, R. N. Dixon, R. H. Qadiri and M. N. R. Ashfold, Phys. Chem. Chem. Phys., 2004, 6, 5031 RSC.
- P. A. Cook, S. R. Langford, R. N. Dixon and M. N. R. Ashfold, J. Chem. Phys., 2001, 114, 1672 CrossRef CAS.
- M. J. Frisch, G. W. Trucks, H. B. Schlegel, G. E. Scuseria, M. A. Robb, J. R. Cheeseman, J. A. Montgomery, Jr., T. Vreven, K. N. Kudin, J. C. Burant, J. M. Millam, S. S. Iyengar, J. Tomasi, V. Barone, B. Mennucci, M. Cossi, G. Scalmani, N. Rega, G. A. Petersson, H. Nakatsuji, M. Hada, M. Ehara, K. Toyota, R. Fukuda, J. Hasegawa, M. Ishida, T. Nakajima, Y. Honda, O. Kitao, H. Nakai, M. Klene, X. Li, J. E. Knox, H. P. Hratchian, J. B. Cross, V. Bakken, C. Adamo, J. Jaramillo, R. Gomperts, R. E. Stratmann, O. Yazyev, A. J. Austin, R. Cammi, C. Pomelli, J. Ochterski, P. Y. Ayala, K. Morokuma, G. A. Voth, P. Salvador, J. J. Dannenberg, V. G. Zakrzewski, S. Dapprich, A. D. Daniels, M. C. Strain, O. Farkas, D. K. Malick, A. D. Rabuck, K. Raghavachari, J. B. Foresman, J. V. Ortiz, Q. Cui, A. G. Baboul, S. Clifford, J. Cioslowski, B. B. Stefanov, G. Liu, A. Liashenko, P. Piskorz, I. Komaromi, R. L. Martin, D. J. Fox, T. Keith, M. A. Al-Laham, C. Y. Peng, A. Nanayakkara, M. Challacombe, P. M. W. Gill, B. G. Johnson, W. Chen, M. W. Wong, C. Gonzalez and J. A. Pople, GAUSSIAN 03 (Revision D.01), Gaussian, Inc., Wallingford, CT, 2004 Search PubMed.
- Y. Zhao, N. González-Garcia and D. G. Truhlar, J. Phys. Chem. A, 2005, 109, 2012 CrossRef CAS.
- P. J. Wilson, T. J. Bradley and D. J. Tozer, J. Chem. Phys., 2001, 115, 9233 CrossRef CAS.
- H. J. Werner, P. J. Knowles, R. Lindh, F. R. Manby, M. Schütz, P. Celani, T. Korona, G. Rauhut, R. D. Amos, A. Bernhardsson, A. Berning, D. L. Cooper, M. J. O. Deegan, A. J. Dobbyn, F. Eckert, C. Hampel, G. Hetzer, A. W. Lloyd, S. J. McNicholas, W. Meyer, M. E. Mura, A. Nicklass, P. Palmieri, R. Pitzer, U. Schumann, H. Stoll, A. J. Stone, R. Tarroni, T. Thorsteinsson, MOLPRO, a package of ab initio programs, Version 2006.1, Cardiff, UK, 2006 Search PubMed.
- A. L. Devine, M. G. D. Nix, B. Cronin and M. N. R. Ashfold, J. Chem. Phys., 2006, 125, 184302 CrossRef.
- G. A. King, T. A. A. Oliver, M. G. D. Nix and M. N. R. Ashfold, J. Chem. Phys., 2010, 132, 064305 CrossRef.
- M. G. D. Nix, A. L. Devine, B. Cronin and M. N. R. Ashfold, Phys. Chem. Chem. Phys., 2006, 8, 2610 RSC.
- M. G. D. Nix, A. L. Devine, B. Cronin and M. N. R. Ashold, J. Chem. Phys., 2007, 126, 124312 CrossRef.
- M. N. R. Ashfold, G. A. King, D. Murdock, M. G. D. Nix, T. A. A. Oliver and A. G. Sage, Phys. Chem. Chem. Phys., 2010, 12, 1218 RSC.
Footnote |
| † Electronic supplementary information (ESI) available: Experimental setup, optimised geometry parameters, UV and mass spectra of morpholine and calculated wavenumbers for the normal mode vibrations of both morpholine conformers and the morpholinyl radical. See DOI: 10.1039/c0sc00119h |
| This journal is © The Royal Society of Chemistry 2010 |