Quasi-static particle formation of poly(acrylamide/methacrylic acid) in ethanol by using V-65 as initiator
Ni
Henmei
*,
Min
Wu
,
Min
Li
,
Hualin
Wang
and
Yueming
Sun
School of Chemistry and Chemical Engineering, Southeast University, Southeast University Road 2, Jiangning, Nanjing, 211189, Jiangsu, China. E-mail: Henmei_ni@hotmail.com
First published on 10th March 2010
Abstract
Quasi-static precipitation polymerization of acrylamide (AAm) and methacrylic acid (MAc) in ethanol by using 2,2′-azobis(2,4-diemthylvaleronitrile) (V-65) as initiator was carried out. The effects of initial concentration of initiator and monomers on the kinetics of polymerization were investigated by gravimetry, SEM and HPLC. It was observed that the number of particles was severely dependent on the total initial concentration of monomers, and less affected by the concentration of initiator. The total surface area of the particles was independent of the concentration of initiator, but slightly affected by the initial concentration of monomers. In the range investigated in this paper, the lowest initial concentration of monomers, gave the maximum number of particles, whilst the highest concentration gave the minimum number of particles, but there was no significant difference observed among the total surface area of particles prepared by using various monomer concentrations. The normalized diameter against the initial concentration of monomers was linearly simulated in the range of concentration of monomers, W0, investigated in present system, R′ = 75.4W0 + 149.5. After the induction period, several pairs of curves of conversion vs. polymerization time overlapped. It indicated that the variation of conversion against time mathematically related to  , where Ci,0 was the initial concentration of initiator. HPLC revealed MAc was consumed faster than AAm during the polymerization and a lot of AAm remained in dry particles.
Introduction
The mechanism of emulsion polymerization and dispersion/precipitation polymerization has been argued for decades.1 A representative viewpoint comprehended by Fitch2 was that, briefly, the polymerization initially occurred in the continuous phase which was saturated by the monomer and where initiator molecules existed. The lyophobicity of the polymer chains increased as the polymerization proceeded, thereby the chains precipitated to form nuclei at a critical length. Monomer molecules diffused from the bulk monomer phase via continuous phase to swell the nuclei, thus the main loci of polymerization moved to the swollen nuclei by capture of radicals generated in the continuous phase. The nucleation of mini or nano monomer droplets was also discussed in the conventional mechanisms. An example was the so-called miniemulsion polymerization on which the intensive agitation of ultrasonification was imposed and a large amount of surfactant was added. However, in the other emulsion polymerizations, mini monomer droplets were considered as a part of the break up of bulk monomer phase by the mechanical agitation, thus their contribution to nucleation was negligible due to the smaller number relative to the other species such as micelles and precipitated nuclei.Reviewing the conventional mechanisms, however, we observed that a basic knowledge of thermodynamics was unfortunately ignored, namely that the concentration was dependent on the radius of droplet. It indicated that, in the presence of agitation, monomer in the polymerization system should be nonequilibrated thermodynamically. The concentration of monomer varied moment by moment at any point in the continuous phase due to the existence of numerous monomer droplets with quite different diameters and the situation that the diameters of the individual droplets continuously changed. In the other words, due to the effect of Ostwald ripening, the aggregation of monomer molecules and degradation of monomer aggregates continuously happened throughout the continuous phase in the presence of agitation. Under such a circumstance, the conventional concept of saturated concentration was obviously not applicable, thus it was hard to estimate the critical length of precipitated oligomers, which is one of the basic and important concepts in the conventional mechanisms. Contrarily, it implied that the precipitated oligomers might be not so necessary for the aggregation of monomer molecules, except in the rare case that monomer was unable to nucleate in the presence of other nuclei such as initiator, surfactant or a second monomer, etc. It was the base of new mechanism,3–7e.g. particles originated from the polymerization in mini monomer droplets that were generated thermodynamically, and monomer transfer was by means of incorporation of mini monomer droplets into growing particles. The entry of free radicals was by adsorption on the new (nude) surface of the mini monomer droplets or growing particles. On the other hand, experimentally, it was observed that numerous mini monomer droplets existed in the ab initio system of emulsion and precipitation polymerizations.3,4,8,9 Therefore, recently the mechanistic arguments were concentrated on how to deal with the aggregates of monomer molecules or mini monomer droplets. Kozempel, et al.8 measured the heterophase polymerization of styrene by means of multi-angle laser light scattering (MALLS) and declared that the size of mini monomer droplets was about 200 nm. However, they suggested that mini monomer droplets were not the loci of nucleation since “the hydrophobic gas or bubble layer surrounding the styrene droplets (or the depletion zone of water molecules) prevents the entry of hydrophilic radicals very efficiently but allows the diffusion of the hydrophobic monomer molecules into the water phase”. Anyway, as the authors know, Shen et al.10 first studied the system of MMA-in-methanol polymerization by dynamic light scattering (DLS). It was observed that the size of species abnormally increased from ca. 15 nm up to 250 nm in a very short time, ca. 2–3 min, while heating. They ascribed it to the aggregation of precipitated oligomers.
The mini monomer droplets were sucked up by growing particles. Ni and Kawaguchi3 also observed mini monomer droplets forming before precipitation polymerization by DLS and suggested that they were the origins of particles. Anyway, we have to point out that the spectrometry directly evidenced the in situ formation of mini monomer droplets. However, the value of size and its distribution were mostly dependent on mathematical approaches of simulation. TEM,4 SEM and AFM9 should be applicable for directly observing mini monomer droplets too. By these approaches, the measurement of precise size was possible. However, in these cases, the solid monomer or low-volatile monomer such as 4-vinylpyridine4 was needed to survive the post-treatments.
Additionally, nanoparticles have been prepared, especially by the method of dropwise addition of monomers.5,11–13 Ni et al.5 observed the number of nanoparticles increased as the agitation rate increased while using oil-soluble initiator in the soap-free emulsion polymerization of 4VP/St. Krishnan et al.11 proved this and suggested the mechanism of continuous nucleation. Sajjadi12 reported that the size of particles depended on the addition rate and solubility of monomers under the condition of low surfactant/monomer ratios. In ref. 11–13, a phrase, “starving condition”, was usually used to describe the truth occurring in growing particles. However, unfortunately it was not able to explain why the monomer molecules did not swell the growing particles, instead, they continuously produced new particles. Here, according to the new mechanism,3–5 we considered that these results revealed that the monomer transfer was not by means of defusion, and the aggregation or coagulation of nanoparticles5 did not result in the stable and monodispersed nuclei or particles. Referencing the (mini)emulsion polymerization,1 nanoparticles were likely to be formed by following path: (1) a great number of surface-active oligomers/radicals previously formed in the aqueous solution. The low surface tension of aqueous solution/air allowed a monomer droplet to spread on the surface of solution as large as possible; (2) the higher ratio of interfacial layer/bulk monomer phase allowed the mini monomer droplets to form easily; (3) the number of big monomer droplets was very small or naught, thereby mini monomer droplets could survive for a relatively longer time.
Nevertheless, recently many new techniques for preparing polymeric particles have been developed, such as dynamic swelling,14,15 micro fluidic assembly,16,17 temperature imprint,18 distillation polymerization19,20 and so on. These approaches were not contradictory to the new mechanism logically.
Compared with conventional mechanisms, the mechanism of mini-droplet particle formation was comprehensive. It not only naturally introduced the agitation factor into the process of particle formation, but was also applicable to all the dispersed polymerizations. One might object to it on the basis of that,1,2 in some cases, no affect of the agitation rate was observed on the polymerization rate in emulsion polymerization. However, it was the fact that generally particles could not be prepared without agitation by emulsion polymerization. Moreover, this conclusion was drawn out on the base of conventional mechanisms that the concentration of monomer in particles was presumptively a constant and only the averaged number of radicals per particle varied. These two assumptions might conceal the effect of agitation. Therefore, the effect of agitation will be the emphasis in our future mechanistic studies.
In this paper, we selected the polymerization system of AAm/MAc in ethanol. This system has been widely investigated by the Kawaguchi research group.3,6,21–23 Microgel was prepared by applying different dispersion solvents, temperature, monomer ratios, etc. However, most recently, we observed that microspheres were prepared in the absence of agitation. In order to distinguish it from the conventional polymerization systems, we called this system NO mechanical agitation, as it is a quasi-static polymerization system. It was not only energy-saving, but also allowed us to avoid the complicated effects of agitation on kinetics. Therefore, academically, studies on this system were important for us to understand the more complicated systems where there is agitation, monomer transfer and polymerization additives.
Experimental
Materials
All the reagents and solvents used in this paper were purchased from Wako Pure Chemical Industries, Ltd., Japan. Monomer methacrylic acid (MAc) was purified by distillation under the reduced pressure. Monomer acrylamide (AAm), 2,2′-azobis(2,4-diemthylvaleronitrile) (V-65) and solvent ethanol (EtOH, dehydrated) were used without further purification.Methods
All polymerizations were performed in a 1.5 L sonoreactor (40 kHz, 300 W) (SR-1500, Shinka Industry Co. Ltd., Kawasaki, Japan), equipped with a stainless ultrasonic irradiator, a condenser, a set of nitrogen inlet and a rubber stopper for adding the initiator with a syringe. Quasi-static polymerization was performed as follows: formulated MAc and AAm dissolved in ethanol was added to the reactor, and then deoxygenated by nitrogen bubbling for 1 h at room temperature (24–27 °C). Initiator in 20 ml ethanol was injected and about 5 min later, the nitrogen flow was stopped. Thereafter, 10 min later, 60 °C water was charged into a water jacket, using a water pump. It took about 10 s to fill up the water jacket. At this moment, the measurement of polymerization time started. All the polymerizations were performed for 10 h in order to avoid the gravimetric coagulation of particles.The weight ratio of AAm![[thin space (1/6-em)]](https://www.rsc.org/images/entities/char_2009.gif) :
:![[thin space (1/6-em)]](https://www.rsc.org/images/entities/char_2009.gif) MAc was 3
MAc was 3![[thin space (1/6-em)]](https://www.rsc.org/images/entities/char_2009.gif) :
:![[thin space (1/6-em)]](https://www.rsc.org/images/entities/char_2009.gif) 1 and total amount of reagents was always 800 g (ca. 1 L) in all experiments. The speed of temperature nearby the central irradiator was measured by scratching from the moment that hot water filled up the water jacket (ca. 10 s). It was 0 min, 26 °C; 3.1 min, 45 °C; 6.8 min, 50 °C; 10.6 min, 55 °C; 17.9 min, 60 °C.
1 and total amount of reagents was always 800 g (ca. 1 L) in all experiments. The speed of temperature nearby the central irradiator was measured by scratching from the moment that hot water filled up the water jacket (ca. 10 s). It was 0 min, 26 °C; 3.1 min, 45 °C; 6.8 min, 50 °C; 10.6 min, 55 °C; 17.9 min, 60 °C.
Characterizations
The solid content was determined by gravimetry. Reaction mixture, 3 g, was extracted by a syringe, and then cleaned trice by recycling centrifugation (13,000 rpm/2 min)–redispersion in ethanol–centrifugation, and finally dried under vacuum at room temperature. The samples were weighed at about 24 h for the first time and then returned to vacuum oven until there was no weight loss in two 4-hour-intervals. After this, dried powders were used as samples for scanning electron microscopy (SEM) (JSM-5600, JEOL, Tokyo, Japan), by which SEM diameters of particles were determined.3As usual, the number of particles (/100 g Lx) was calculated by the following equation.
It represented the diameter at 100% conversion. One might ask what happened when X → 0. In fact, in this case, R → 0, too. Therefore, R′ should be the initial diameter of mini monomer droplet, not R′ → ∞. Accordingly, the total surface area of particles at 100% conversion or total surface area of mini monomer droplets was calculated as following in accordance with the new mechanism, provided that the concentration of monomers in continuous phase was negligible.
The molecular weight was evaluated by using HPLC (LC10 Atvp HPLC, Shimazu Co. Ltd., Tokyo, Japan) equipped with a volume-exclusive gel column for use in aqueous phase (TSK-Gel G5000PWXL, Tosoh Co. Ltd, Tokyo, Japan). The buffer solution of acetic acid/sodium acetic acid was used as the elution phase and elution speed was 1.0 ml min−1.
Results and discussion
Particle size
According to the conventional mechanisms,1,2 the number of particles was most important since the polymerization rate was proportional to it. The concentration of initiator affected the number of particles. In spite of this, a qualitative relationship between the amount of initiator and number of particles has not been established so far, let alone a quantitative relation. For example, recent research6,24 revealed that the number of particles was related to the chemical properties of the initiator besides the amount and decomposition rate. In the polymerization system of AAm/MAc in ethanol,6 using dimethyl 2,2-azobisisobutyrate (V-601) as initiator, the number increased with the increase of V-601 concentration, whereas using 4,4-azobis-4-cyanovaleric acid (V-501), the number decreased with the increase of initiator. As for the dispersion polymerization of MMA in methanol,24 the number of particles decreased as AIBN increased. On the other hand, monomer concentration or the amount of monomer has never been considered in the conventional mechanisms because it was assumed that the locus of nucleation was in the aqueous phase where saturated by monomer and the concentration of monomer in growing particles was constant.Therefore, in this paper, we firstly investigated the particle size or number of particles. As shown in Fig. 1, the normalized particle diameter decreased, to some extent, with the increase of V-65. Here, the so-called “normalized diameter” meant the diameter at 100% conversion. Such normalization was based on the following factors: (1) as described in the experimental section, the polymerizations were performed in limited time in order to avoid the gravitational coagulation of particles. Hence, the resultant solid content of various samples was quite different. In these cases, it was well known that strictly the diameters were not comparable without normalization; (2) no secondary particles were observed during the polymerization. As shown in Fig. 1, at 5.0 wt%, the diameter decreased from 754.5 nm of 50 mg/800 g to 472.8 nm of 200 mg/800 g V-65, but after that, diameters were almost constant, even though V-65 increased from 200 to 800 mg/800 g. It seemed that, only in the range of lower concentration of V-65, the effect of initiator was pronounced. On the contrary, as shown in Fig. 2, diameters were greatly affected by the initial concentration of monomers. For example, at the level of 200 mg/800 g V-65, the diameters were 331.6, 472.8 and 724.0 nm, respectively, corresponding to the initial concentration of monomers, 2.5, 5.0 and 7.5 wt%. Meanwhile, the distribution of diameters along the axis of monomer concentration was almost linear in the range of concentration investigated in present paper. R′ = 75.4W0 + 149.5, where W0 was the initial concentration of monomers. It meant that the initial concentration of monomer was a dominant factor over the diameter of the particles, which in turn determines the number of particles. This result was unpredictable in accordance with the conventional mechanisms. One might ask what R′ = 149.5 meant when W0 = 0. As an answer, we must remark that this equation was the result of a linear simulation artificially in the range of concentration investigated in present paper. In addition, it was part of our suggestion that there was a critical concentration below which this equation was not applicable. Therefore, R′ = 149.5 might be the diameter at the critical concentration.
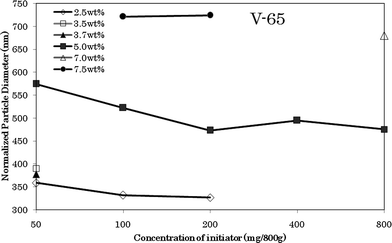 | ||
| Fig. 1 Effects of amount of V-65 on the normalized diameter of particles. | ||
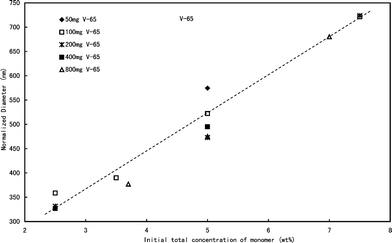 | ||
| Fig. 2 Effects of initial concentration of monomers on the normalized diameter of particles. | ||
It should be noted that the distribution of particle size was monodispersed (see SEM photos later). The average root square deviation of size was less than 3%. Moreover, even when the SEM diameters were directly cited, i.e., without normalization, similar results were also obtained because mathematically, the difference in the cubic root of the solid content was small, even though the solid contents were quite different. Anyway, we must emphasize that the normalization was based on an assumption, namely neglecting the monomer dissolved in the continuous phase because we had no way of knowing the diameters of the droplets so far. According to the new mechanism,3–5 the real diameters of droplets at the lower concentration of monomers should be smaller than the normalized diameters.
Total particle surface area
The total surface area and number of particles are denoted in Fig. 3. The number of particles was inversely proportional to the cube of the normalized diameter, whilst the total surface was inversely proportional to the normalized diameter. As shown in Fig. 3, the number of particles was determined by the initial concentration of monomer too, regardless or less related to the concentration of V-65. The lowest concentration of monomers, 2.5 wt%, gave the maximum number of particles, whilst the highest concentration of monomers, 7.5 wt%, produced the minimum number of particles. The maximum number was generally ca. 3.5 times as much as the minimum one. On the other hand, the change of total surface area of particles was surprising. As shown in Fig. 3, the total surface area was the minimum when the concentration of monomers was the lowest, 2.5 wt%, regardless of the concentration of V-65. It indicated that the greater number of particles did not mean the larger surface area. Contrarily, the surface area was just dependent on the initial concentration of monomers, rather than the number of particles. Meanwhile, at the higher concentration, the surface area changed little with the variation of concentration. Certainly, compared with the change of particle number, the difference of total surface area between the maximum and minimum was smaller. For example, at 2.5 wt%, the total surface area was about 7.0, whilst at 7.5 wt%, the total surface area was ca. 10.0. Moreover, as we stressed above, due to the assumption that the monomer in the continuous phase was ignored, the real diameter of the droplets at 2.5 wt% should be smaller than the normalized one. Taking into account this factor, therefore, the difference between the maximum and minimum total surface area of the mini monomer droplets should actually be much smaller than those denoted in Fig. 3, whereas the difference of particle number should be much bigger. This was the reason that the normalized diameter was almost directly proportional to the initial concentration of monomers.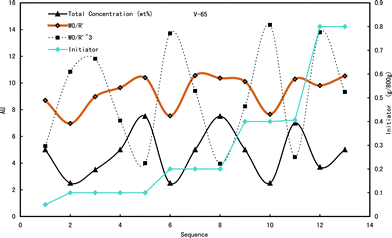 | ||
| Fig. 3 The number and total surface area of particles prepared under various conditions. Note: the orange line, W0/R′, denotes the total surface area; the dotted line, W0/R′3, denotes the number of particles in 100 g latex. | ||
The evidence that the number and total surface area of particles were independent of the concentration of initiator was straightforward enough to prove that there was no relationship between the particle formation and the precipitation of oligomers in the continuous phase.
Conversion of monomer to particle vs. polymerization time
Fig. 4 shows SEM photos of particles prepared by quasi-static polymerization. It was observed that the size of particles was monodispersed and at least in apparentness, there was no difference from those6,21,22 prepared with the mechanical agitation. | ||
| Fig. 4 SEM photos of particles prepared by quasi-static polymerization. | ||
The curves of conversion vs. polymerization time are shown in Fig. 5. There was an induction period at the beginning of the polymerization, but it was short, about several minutes. We considered that it was an interesting topic, thus will further discuss it in detail in the future. Here, briefly, it was dependent on both the concentration of initiator and monomer. More monomer or initiator rendered the induction period to be shorter. On the other hand, referencing Fig. 3, it was obvious that the greater number of particles did not result in the higher increase rate of conversion, which completely contradicted the prediction of conventional mechanisms.1,2 For example, the number of particles was the maximum at 2.5 wt% (Fig. 3), whereas the increase rate of conversion of 1094 (200 mg, 2.5 wt%) was much slower than that of 1095 (200 mg, 7.5 wt%) (Fig. 5). Furthermore, it was observed that some curves overlapped. It indicated that with the same product of  , the variation of conversion against time was the same, where Ci,0 was the initial concentration of V-65. For example, as shown in Fig. 5, pairs of curves, 1100 (100 mg V-65, 3.5 wt%) and 1094 (200 mg V-65, 2.5 wt%), 1090 (100 mg V-65, 5 wt%) and 1196 (400 mg V-65, 2.5 wt%), etc, overlapped in most of the polymerization time. An exception was 1099 (50, 5.0 wt%) which deviated from 1100 (100, 3.5 wt%) and 1094 (200, 2.5 wt%), though all
  . It is probably ascribed to the small amount of V-65.
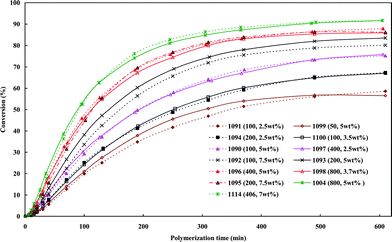 | ||
| Fig. 5 Solid content vs. polymerization time. Quasi-static polymerization; the numbers, such as 50 and 100 etc, in the parentheses are the milligrams of initiator added to the total 800 g reaction mixture. | ||
The relationship between conversion and  may be reminiscent of the polymerization rate in bulk polymerization. However, we should remark that the overlapped curves were only observed in the quasi-static polymerization, namely under the condition that the initiator molecules (including free-radicals) and monomer molecules accessed the growing particles by completely free-diffusion. If the mechanical stirring is imposed, the situation would be complicated. Therefore, the hypothesis that the particle formed by the polymer was created in the continuous phase was not supported.18–20,25
Paine26,27 developed a multibin kinetic model for the aggregation of precipitated radicals or unstabilized particles in dispersion polymerization, based on diffusion-controlled particle aggregation described by Smoluchowski28 and Frenklach.29 The stabilized particles whose surfaces were completely covered by grafted polyvinylpyrrolidone (PVP) chains did not aggregate. Assuming ideal core-shell structures in which the main monomer formed the core, and dispersant the shell, Paine26 quantitatively simulated the role of the stabilizer molecules at the particle formation stage. It explained the results of particle size data fairly well, with reasonable kinetic and coverage parameter values, in the dispersion polymerization of styrene in ethanol with PVP dispersant.27 Many other dispersion polymerization systems with homopolymer dispersants appear to be explained too, except for the frequently observed direct particle size dependence on initiator concentration.30 In fact, Paine's model26 was clearly a mini monomer droplet in the initial stage of the particle and the core-shell growth was one of consequences in the mechanism of mini monomer droplet particle formation, provided that the initiator molecules were dominantly partitioned in the continuous phase or adsorbed on the surface of mini monomer droplets. However, they did not consider the possibility of partition of initiator. On consideration of the situation under stirring (which will be reported later), we think, in the present paper, the initiator of V-65 was dominantly partitioned in the continuous phase and/or on the surface of mini monomer droplets.
HLPC results
Molecular weight of poly(AAm-co-MAc) was very difficult to estimate by GPC. The reason was that the segment of MAc was polyelectrolyte, whereas PAAm was not. Therefore, the peak of copolymer was not only dependent on pH, but also to the amount of AAm segments. Fig. 6 shows an example of HPLC spectra at different pH. PAAm (MW, 10,000) and polyacrylic acid (PAc) (MW, 15,000) available at hand was eluted (PAAm and PAc were prepared by free-radical polymerization and the molecular weight was measured by viscometry). As shown in Fig. 6a, pure PAAm had two peaks, i.e. a big single peak at 19.6 min and a negligible shoulder at 22.3 min, at pH 7.5. These two peaks slightly moved to 19.5 and 22.7 min at pH 10.4, respectively. Taking account into the error, we considered that PAAm was not affected by pH. As for PAc, there were three main peaks at pH 7.5, i.e., a shoulder at 16.5, a big single peak at 19.5 and a smaller peak at 22.7 min, whereas at pH 10.4, the shoulder disappeared and the smaller peak separated into two peaks that respectively located at 22.9 and 23.7 min. Obviously, the peaks at 22.9 and 23.7 min represented PAc with the lower molecular weight. However, for the mixture of PAc and PAAm, it was observed that the shoulder at 16.5 min did not appear at pH 7.5. Moreover, the main peaks of PAc and PAAm were not observed. They incorporated and moved to 20.0 min at pH 7.5. Furthermore, the onset of peak moved to the longer retention time relative to the onsets of both pure PAc and PAAm. It indicated that PAc with the higher molecular weight strongly interacted with PAAm. This result was coincident to ref. 31, 32 and also to our work3 that the interaction of AAm/MAc was intensive even in the buffer solution. However, the peak of PAc with the lower molecular weight still existed. It meant that the interaction was related to the length of chains.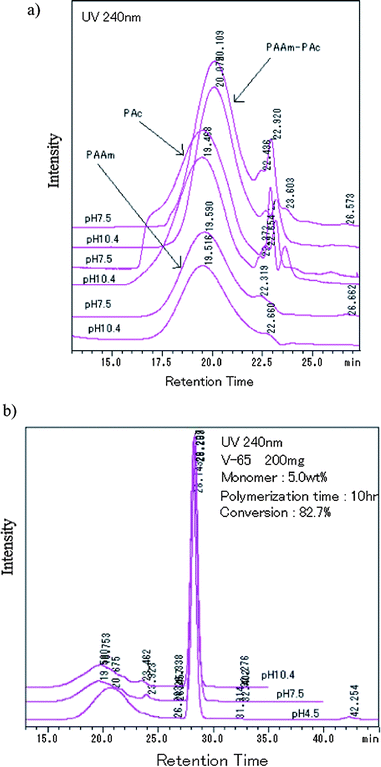 | ||
| Fig. 6 HPLC spectra of PAc-PAAm (a) and poly(MAc-co-AAm) at different pH (b). (a) Interaction of polyAAm/polyacrylic acid and (b) effect of pH. | ||
Fig. 6b shows HPLC spectra of a sample at different pH. It was observed that, at first, the peak in the vicinity of 23.3 min at pH 7.5 and pH 10.4 moved to 42.3 min when pH = 4.5. As discussed above, obviously, this peak was assigned to the polymer with the lower molecular weight and dominated by segments of MAc. At lower pH, the dissociating degree of MAc was lower, thus chains shrunk and were withheld for a longer time in the column. The peak of AAm (28.1 min) was very intensive and did not alter with pH change, ascribing to AAm residue in dry particles which exhibiting strong absorbance. The main peak of polymer moved to the shorter retention time as the pH increased. It was attributed to the dissociation of MAc units in polymer. Finally, at pH 7.5 and pH 10.4, there was a shoulder peak (20.7 min) appeared. We considered that the shoulder should be attributed to the contribution of mono PAAm and/or segments of AAm in copolymer because it did not move as pH increased.
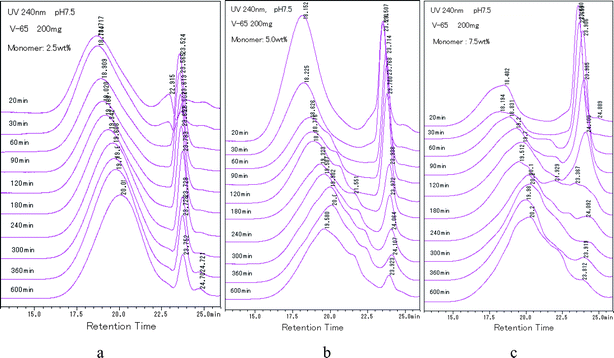
Fig. 7 shows the HPLC spectra of polymer at pH 7.5 sampled during the polymerization. The initial concentration of monomer was 2.5, 5.0 and 7.5 wt%, respectively. The following results were obtained from the diagrams.
(1) Generally, the main peak of polymer in all samples moved to the longer retention time as polymerization proceeded. Two explanations were possible. One was that, as usual, the molecular weight decreased. The other one was the increase of the PAAm component including segments of AAm in the copolymer. The latter was directly supported by the above results.
(2) The relative intensity of the peak at 23.3 min (polymer enriched in MAc) decreased with the propagation of polymerization. The decreasing rate was dependent on the initial concentration of monomer (Fig. 7 b and c). For example, at 2.5 wt%, the peak of 23.3 min was considerably intensive, in spite of the fact that the polymerization was performed for 600 min, whereas at 7.5 wt%, the peak almost disappeared at about 180 min.
(3) As shown in Fig. 7a, at 2.5 wt%, shoulder peaks did not appear even though the solid content was as high as 67.3% at 600 min. However, at 7.5 wt%, the shoulder peak appeared soon after polymerization started (30 min, 10.3% solid content) (Fig. 7c), and at 5.0 wt%, it appeared at 60 min, 13.2%.
Fig. 8 shows the HPLC spectra of samples prepared by using various amount of initiator. Comparing Fig. 8a with Fig. 7b, we observed that adding more initiator did not render the shoulder to appear earlier, but made the shoulder peak higher. The effect of amount of initiator on the intensity of the peak at 23.3 min was not pronounced. Fig. 8b shows the HPLC spectra of samples which kinetic curves overlapped (Fig. 5). The overlapped pairs were 1094 (200 mg, 2.5 wt%) and 1110 (100 mg, 3.5 wt%), 1097 (400 mg, 2.5 wt%) and 1090 (100 mg, 5.0 wt%). The three overlapped curves were 1095 (200 mg, 7.5 wt%), 1096 (400 mg, 5.0 wt%) and 1098 (800 mg, 3.7 wt%). However, we did not observe any similarity among their HPLC spectra. Instead, irrespective of the amount of initiator, the shoulder peak just appeared in the spectra of samples prepared with the initial concentration of monomers higher than 2.5 wt%. It was coincident to result (3). An exception was Run 1098 (800 mg, 3.7 wt%) in that the amount of initiator was the largest. Moreover, the main single peak of 2.5 wt% including Run 1098 was located at a retention time longer than 20 min. It was coincident with the above results that there was less component of PAAm in the particles, compared to the samples prepared with higher concentration of monomers.
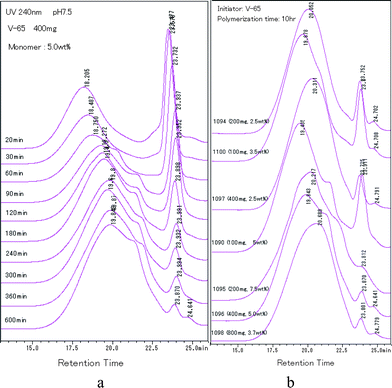 | ||
| Fig. 8 HPLC spectra of particles prepared by 400 mg, 5.0 wt% (a) and particles with overlapped solid content curves (b). | ||
A question arose from the above results, namely why did the polymer enriched in MAc with the lower molecular weight disappear at the higher initial concentration of monomers, whilst it did not disappear at 2.5 wt%? Or correspondingly, why the polymer enriched in AAm changed inversely? To answer this question, the first problem we should solve was where it formed, and then what its fate was. Jiang et al.24 suggested that the polymer of shorter chain length formed at the initial stage of dispersion polymerization resulted from the unstable nuclei generated in the continuous phase. It coagulated with particles. However, this suggestion was not able to explain the above results because at 2.5 wt%, the shorter polymer chains formed throughout the polymerization, whereas at 7.5 wt%, the formation process stopped soon after the polymerization. Moreover, it could not explain the variation of polymer enriched in AAm. Therefore, on the base of our new mechanism, we considered that the different changing patterns of peaks were attributed to the different partition status of monomers in the system. As shown in Fig. 9, the system was homogeneous before heating (Fig. 9 I). The mini monomer droplets of monomers formed prior to the polymerization3,6 (Fig. 9 II). The concentration of monomers in the continuous phase was determined by the diameter of droplets in accordance with the Laplace equation. Hence, at 2.5 wt%, the concentration in the continuous phase was the highest due to the smallest size. Initiator molecules distributed in the system according to their properties. That is to say, they could be partitioned in the continuous phase, droplets and/or the interface according to their chemical properties. In present system, we considered V-65 was dominantly partitioned in the continuous phase and/or adsorbed on the surface of mini monomer droplets. When the reaction started, the oligomer chains enriched in MAc were able to grow longer than those enriched in AAm before precipitation or adsorption on the surface of the growing particles (Fig. 9, III). This was supported by the above result that MAc was consumed faster than AAm. Therefore, at 2.5 wt%, they were continuously formed in the continuous phase throughout the polymerization, whereas they disappeared soon after polymerization started at 7.5 wt% due to the lowest concentration in the continuous phase. The disappearance of oligomers at 7.5 wt% also implied that the fate of these oligomers might be grafted or incorporated into the polymer of particles. The shoulder peak was dominantly contributed to by the polymerization of AAm in particles. It was supported by the above results that there were a lot of AAm remained in the dry particles. That was why the shoulder peak appeared soon after the polymerization started at 7.5 wt%, whereas it did not appear at 2.5 wt% due to high concentration of AAm in the continuous phase. Anyway, even though, there were many problems unclear at recent stage.
 | ||
| Fig. 9 Scheme of particles formation. | ||
Conclusions
Quasi-static precipitation polymerization of acrylamide (AAm) and methacrylic acid (MAc) in ethanol by using 2,2′-azobis(2,4-diemthylvaleronitrile) (V-65) as the initiator was investigated. In contrast to the prediction of the conventional mechanism that the number of particles solely depends on the concentration of initiator, in this paper, we observed that the total initial concentration of monomers was the dominant factor in determining the number of particles, but the concentration of initiator affected it less. The total surface area of the resultant particles was evaluated firstly in the mechanism studies of particle formation. It was independent of the concentration of initiator, but slightly affected by the initial concentration of monomers. The lowest initial concentration of monomers gave the maximum number of particles, whilst the highest concentration gave the minimum number of particles, but there was no significant difference observed among the total surface area of particles prepared by using various monomer concentrations. The concept of normalized diameter was firstly suggested in this paper. It was found that the normalized diameter was almost linearly correlated to the initial concentration of monomers in the range of concentration of monomers, W0, investigated in present system, R′ = 75.4W0 + 149.5. We should remark that the linear relationship of the normalized diameter with initial concentration of monomers was not affected by stirring and only found in the limited range of concentration. Comprehensively considering the limits of concentration22 within which the particle were prepared, we think that these results were consistent with the hypothesis that the primary particles were mini monomer droplets and the thermodynamic factors dominated their formation. On the other hand, after the induction period, curves of conversion vs. polymerization time with the same overlapped. It indicated that the variation of conversion against time was fatally related to
  . HPLC revealed MAc was consumed faster than AAm during the polymerization and a lot of AAm remained in dry particles. The reason was likely to be that the soluble PMAc favored MAc and AAm to access the active center by diffusion, but not the insoluble PAAm. The polymer enriched in MAc was generated in the continuous phase. Hence, it formed throughout the polymerization at 2.5 wt% due to the highest concentration of monomers in the continuous phase, whereas its formation stopped soon after the polymerization started at 7.5 wt%. This polymer was grafted or incorporated into the polymer of particles by adsorption on the surface of growing particles. The conclusion drawn from quasi-static polymerization system were believed to be helpful for the further kinetic studies of more complicated dynamic systems, in which there were agitation factor, stabilizer substances and additionally monomers transfer between the monomer bulk phase and growing particles.
References
- P. A. Lovell and M. S. El-Aasser, Emulsion Polymerization and Emulsion Polymers, New York, Wiley, 1997 Search PubMed.
- R. M. Fitch, Polymer Colloids, A Comprehensive Introduction, Academic Press, New York, 1997 Search PubMed.
- H.-M. Ni and H. Kawaguchi, J. Polym. Sci., Part A: Polym. Chem., 2004, 42(11), 2823 CrossRef CAS.
- H.-M. Ni, G.-H Ma, M. Nagai and S. Omi, J. Appl. Polym. Sci., 2001, 82, 2679 CrossRef CAS.
- H.-M. Ni, Y.-Z. Du, G.-H. Ma, M. Nagai and S. Omi, Macromolecules, 2001, 34(19), 6577 CrossRef CAS.
- H.-M. Ni and H. Kawaguchi, J. Polym. Sci., Part A: Polym. Chem., 2004, 42(11), 2833 CrossRef CAS.
- H.-M. Ni, G.-H. Ma, M. Nagai and S. Omi, J. Appl. Polym. Sci., 2001, 82, 2692 CrossRef CAS.
- S. Kozempel, K. Tauer and G. Rother, Polymer, 2005, 46, 1169 CrossRef CAS.
- T. Yamamoto, Y. Kanda and K. Higashitani, Langmuir, 2004, 20, 4400 CrossRef CAS.
- S. Shen, E. D. Sudol and M. S. El-Aasser, J. Polym. Sci., Part A: Polym. Chem., 1994, 32, 1087 CAS.
- S. Krishnan, A. Klein, M. S. El-Aasser and E. D. Sudol, Polym. React. Eng., 2003, 11(3), 359 Search PubMed.
- S. Sajjadi, Langmuir, 2007, 23, 1018 CrossRef CAS.
- C. D. Anderson, E. D. Sudol and M. S. El-Aasser, Macromolecules, 2002, 35, 574 CrossRef CAS.
- M. Okubo, E. Ise and T. Yamashita, J. Polym. Sci., Part A: Polym. Chem., 1998, 36, 2513 CrossRef CAS.
- H. Minami, H. Kobayashi and M. Okubo, Langmuir, 2005, 21, 5655 CrossRef CAS.
- R. F. Shepherd, J. C. Conrad, S. K. Rhodes, D. R. Link, M. Marquez, D. A. Weitz and J. A. Lewis, Langmuir, 2006, 22, 8618 CrossRef CAS.
- T. Nisisako and T. Torii, Adv. Mater., 2007, 19, 1489 CrossRef CAS.
- R. Takekoh, W.-H. Li, N. A. D. Burke and H. D. H. Stover, J. Am. Chem. Soc., 2006, 128, 240 CrossRef CAS.
- F. Bai, X.-L. Yang and W.-Q. Huang, Macromolecules, 2004, 37, 9746 CrossRef CAS.
- F. Bai, X.-L. Yang, R. Li, B. Huang and W.-Q. Huang, Polymer, 2006, 47, 5775 CrossRef CAS.
- Y. Kamijo and H. Kawaguchi, MS Thesis, Keio University, 1989.
- H.-M. Ni, H. Kawaguchi and T. Endo, Colloid Polym. Sci., 2007, 285, 819 CrossRef CAS.
- S. Kawaguchi and K. Ito, Adv. Polym. Sci., 2005, 175, 299 CAS.
- S. Jiang, E. D. Sudol, V. L. Dimonie and M. S. El-Aasser, Macromolecules, 2007, 40, 4910 CrossRef CAS.
- J. S. Downey, G. McIsaac, R. S. Frank and H. D. H. Stöver, Macromolecules, 2001, 34, 4534 CrossRef CAS.
- A. Paine, Macromolecules, 1990, 23, 3109 CrossRef CAS.
- A. J. Paine, J. Colloid Interface Sci., 1990, 138, 157 CrossRef CAS.
- M. V. Smoluchowski, Z. Phys. Chem., 1917, 192, 129 Search PubMed.
- M. Frenklach, J. Colloid Interface Sci., 1985, 108, 237 CrossRef CAS.
- E. Tsuchida and K. Abe, Adv. Polym. Sci., 1982, 45, 1.
- E. A. Bekturov and L. A. Bimendina, Adv. Polym. Sci., 1981, 41, 99 CAS.
- S. K. Chatterjee, M. Chhabra and S. Johri, J. Polym. Sci., Part A: Polym. Chem., 1994, 32, 1169 CrossRef CAS.
| This journal is © The Royal Society of Chemistry 2010 |


