Deciphering the photophysics of 5-chlorosalicylic acid: evidence for excited-state intramolecular proton transfer
Received 4th September 2009, Accepted 30th October 2009
First published on 1st December 2009
Abstract
A detailed photophysical study of a pharmaceutically important chlorine-substituted derivative of salicylic acid viz., 5-chlorosalicylic acid (5ClSA), has been carried out by steady-state absorption, emission and time-resolved fluorescence spectroscopy and compared with its parent molecule salicylic acid (SA). A large Stokes-shifted emission band with negligible solvent polarity dependency indicates the spectroscopic signature of excited-state intramolecular proton transfer reaction. Presence of various ground-state species has been confirmed by a thorough investigation in different solvents and by pH variation experiments. Quantum chemical calculation by ab initio Hartree–Fock (HF) and Density Functional Theory (DFT) methods yields results consistent with experimental findings. Particularly, evaluation of potential energy surfaces for the S0 and S1 states across the proton transfer coordinate reveals distinct theoretical support for the inoperativeness of the GSIPT reaction as well as the occurrence of ESIPT process. The less favourable ESIPT reaction in 5ClSA is due to reduction of ground-state intramolecular hydrogen bond strength and excited-state negative charge density at the acceptor (–COOH) oxygen atom and increase of the excited-state barrier with respect to SA.
1. Introduction
The pioneering work of Weller1 in the middle of the last century envisaged a new arena of research in the field of photochemistry out of the unique observation of excited-state intramolecular proton transfer (ESIPT) reaction in methyl salicylate. Since then a great deal of research has been directed to the study of photoinduced proton transfer processes along intramolecular hydrogen bonds (IMHBs) both in the condensed phase as well as in the gas phase and supersonic jets.2–17 The photophysics of intramolecular hydrogen bonds in aromatic systems has captured special attention because of its essential role for the functionality of so-called photostabilizers,18,19 which are in wide technical use for the protection of organic polymers against degradation by the UV components of sunlight.20,21 The four-level photophysical scheme of PT reactions promotes the application of photostabilizers in proton transfer lasers,22,23 UV filters,24 and facilitates their use as probes for investigating various biological and biomimicking environments.25–29 Such a vast range of applications has enormously contributed in making the study of the unique phenomenon of ESIPT an active and dynamic subject of research. The study of the ESIPT reaction still continues to throw challenges, primarily because of the inherently complicated physical (e.g., quantum nature) and chemical (cleavage and formation of H-bonds and subsequent nuclear rearrangement with inversion in the thermodynamic stability) nature of the process. Such complexities have always acted in the direction of supplying immense fuel to the study of ESIPT process even in some of very simple and prototype systems such as salicylic acid (SA) and related compounds.30–45The present work concerns the photophysical behaviour of a simple salicylic acid derivative viz., 5-chlorosalicylic acid (5ClSA), from experimental and theoretical standpoints. Although quite a few reports have appeared in the literature on the study of the substitution effect on ESIPT of SA, these have mainly focused on substitution at the IMHB ring site.32,33,40 Studies looking at the effect of substitution on the aromatic nucleus are, however, scarce.42 The present study is thus designed to look into the effect of chlorine substitution on the benzene ring on the photophysics of SA.
Most of the 5-substituted derivatives of SA are important starting materials in pharmaceutical and other industries. 5-Hydroxysalicylic acid is used successfully in rheumatoid arthritis, infection-induced rheumatic fever and gout, and 5-sulfosalicylic acid is used for the determination of proteins. 5-Aminosalicylic acid is an important starting material for preparation of azo dyes, and 5-chloro and 5-bromosalicylic acids are well known fungicides.46,47 Thus a detailed photophysical investigation of 5ClSA has immense significance and relevance. Although there is a report on the fluorescence properties of 5ClSA,46 that study does not cast light on the photophysics of 5ClSA in detail. In the present work, the various species present in the ground and excited states of 5ClSA are confirmed by a thorough spectroscopic investigation including variation of pH and solvent polarity. Furthermore, computational results at the Hartree–Fock (HF) and Density Functional Theory (DFT) levels of theory are found to correlate well the experimental findings. Overall, the present study intends to see whether or not chloro substitution at the 5-position of the benzene nucleus perturbs the photophysics of SA noticeably, with particular emphasis on the ESIPT process.
2. Materials and methods
2.1 Materials
5-Chlorosalicylic acid was purchased from SRL (India) and was used after repeated crystallization from EtOH. Spectroscopic-grade solvents such as methylcyclohexane (MCH), acetonitrile (ACN), tetrahydrofuran (THF), dioxane (DOX), dichloromethane (DCM), chloroform (CHCl3), n-butanol (BuOH), isopropanol (iPrOH), methanol (MeOH), ethanol (EtOH) and dimethyl sulfoxide (DMSO) were purchased from Spectrochem (India) and were used after proper distillation. Sulfuric acid (H2SO4) and sodium hydroxide (NaOH) from E-Merck, and triethylamine (TEA) and trifluoroacetic acid (TFA) from Spectrochem (India), were used as received. Triply-distilled water was used for preparing aqueous solutions.2.2 Absorption and emission measurements
The absorption and emission measurements were carried out using a Hitachi UV-Vis U-3501 spectrophotometer and Perkin-Elmer LS-50B fluorimeter, respectively. In all measurements the sample concentration was maintained in the range 10−7–10−8 M in order to avoid aggregation and reabsorption effects. Only freshly prepared solutions were used for spectroscopic study and all experiments were carried out at room temperature (300 K) unless otherwise stated.Fluorescence quantum yield (Φf) was determined using β-naphthol as the secondary standard (Φf = 0.23 in methylcyclohexane)2,3,5,7 in the following equation:
| |  | (1) |
where
A denotes the fluorescence area under the curve, Abs denotes absorbance,
n is the refractive index of the medium and Φ is the fluorescence quantum yield, and subscripts ‘s’ and ‘r’ denote the studied sample and reference, respectively.
Fluorescence lifetimes were obtained from time-resolved intensity decays by time-correlated single-photon counting (TCSPC) using a nanosecond diode laser at 295 nm (IBH, nanoLED-07) as the light source to trigger the fluorescence of 5ClSA, and TBX-04 as the detector, and the signals were collected at the magic angle (54.7°). The decays were deconvoluted using IBH DAS-6 decay analysis software. The excellence of the fits was judged by χ2 criteria and visual inspection of the residuals of the fitted function to the data. Mean (average) fluorescence lifetime (<τf>) for the biexponential decay was determined from the decay time constants (τ) and the pre-exponential factors (α) using the following equation5
| |  | (2) |
2.3 Computational procedures
The ground-state structural calculations for various possible conformations of 5ClSA were computed using Hartree–Fock (HF) theory and density functional theory (DFT) at the B3LYP/6-311G** level using GAUSSIAN 03W suite of programmes.48 The ground-state intramolecular proton transfer (GSIPT) curves were evaluated using the fully optimized B3LYP/6-311G** geometries at fixed Od–H1 distances over the range 0.93–1.83 Å.2,3,7,30 The excited-state potential energy curves (PECs) were obtained by calculating the Franck–Condon transition energies for the B3LYP/6-311G** ground-state optimized structures at fixed Od–H1 distances using time-dependent density functional theory (TDDFT/6-311G**). The Franck–Condon curves for the proton transfer process were obtained by adding the TDDFT/6-311G** excitation energies to the corresponding GSIPT curves.2,3,7,30,44 This type of approach has been successfully reported in several recent papers for studying ESIPT reactions.2,3,7,8,30,44,45 However, several other methods have also been reported for elucidation of PES for the proton transfer reaction.49,50 The CASSCF study on the ESIPT reaction of 2-(2′-hydroxyphenyl)benzotriazole predicts that the true reaction path passes through a twisted geometry.49 Sobolewski et al. employed successfully CASSCF and CIS electronic structure method to study proton transfer in 7-hydroxy-1-indanone and related compounds, and they have compared the results of CASSCF and CASPT2 with the TDDFT method.50 The strength of the IMHB (EIMHB) was estimated from the energy difference between fully optimized molecular structures of the E-form and the non-hydrogen bonded form (with the –OH or –COOH group rotated 180° from that in the hydrogen-bonded conformation).2,3,7,303. Results and discussion
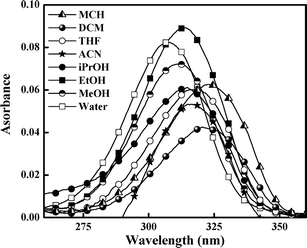
The absorption spectra of 5ClSA recorded in different organic solvents are displayed in Fig. 1 and the corresponding spectroscopic parameters are collected in Table 1. The main absorption band of 5ClSA centers at ∼320 nm along with another hump at higher energy region in the range of 305–310 nm. This small hump is, however, not equally prominent in all solvents. The assignment of the observed spectral features rests on a comparison with the absorption spectra of salicylic acid (SA). Bisht et al.43 studied the excitation spectra of SA (monomer) under supersonic nozzle expansion conditions and found the S1←S0 transition to have its origin at 335.35 nm and 311.52 nm. They assigned the bands for E-form and R-form of SA (as in Chart 1), respectively. The two absorption bands in 5ClSA are blue shifted with respect to SA due to the electron-withdrawing inductive effect of chlorine atom. A direct analogy therefore drives us to attribute the higher-energy (305–310 nm) and the lower energy (∼320 nm) bands of 5ClSA, respectively, to the R- and E-forms (Chart 1). However, two distinctly resolved absorption bands (due to two species) are lacking in the present study, rather a broad spectrum is obtained, which is a commonly encountered characteristic of condensed phase spectra and might well be entrusted on the extensive solute-solvent interactions contributing to the broadening of the spectrum. It is thus not surprising that the absorption bands of the two absorbing species (E- and R-forms) are overlapped within the same arena of a single broad spectrum.
Table 1 Spectroscopic parameters for 5ClSA in different solvents as obtained from absorption and emission measurements
| Solvent | Absorption λ (nm) | Emission λ (nm) | Quantum yield (K-form) |
|---|
| MCH | 322 | 380, 453 | 0.039 |
| ACN | 285, 316 | 415 | 0.187 |
| ACN + TEA | 298 | 407 | — |
| ACN + TFA | 314 | 436 | — |
| DCM | 322 | 370, 460 | 0.067 |
| THF | 321 | 350, 450 | 0.142 |
| DMF | 308, 353 | 404 | — |
| BuOH | 315 | 423 | 0.455 |
| iPrOH | 315 | 421 | 0.289 |
| EtOH | 313 | 416 | 0.261 |
| MeOH | 312 | 347, 415 | 0.166 |
| Water | 308 | 420 | 0.301 |
| DMSO | 305, 350 | 406 | 0.120 |
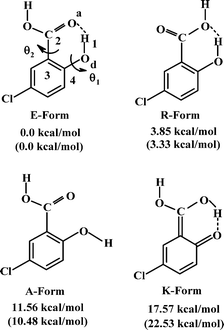 |
| | Chart 1 Schematic of computed ground-state low-energy structures and their energies for 5ClSA at DFT//B3LYP/6-311G** and HF/6-311G** (in parentheses) levels (energies with respect to the E-form are given) | |
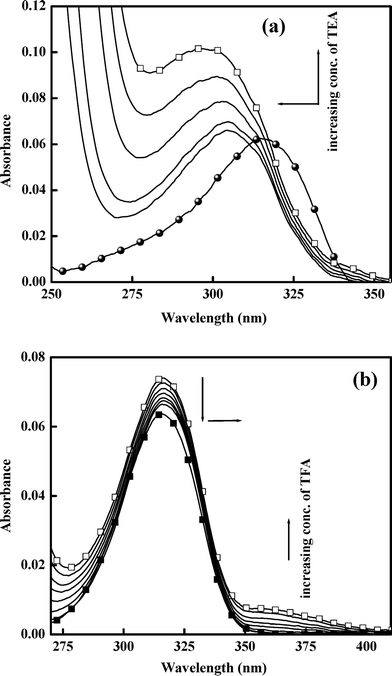 |
| | Fig. 2 Effect of addition of (a) base (TEA) and (b) acid (TFA) on the absorption spectra of 5ClSA in ACN medium at room temperature. | |
On the other hand, addition of TFA to an ACN solution of 5ClSA shows little decrease of intensity coupled with a slight red-shift of the absorption maxima from ∼316 nm to ∼314 nm (Fig. 2b). This red-shift could be due to formation of a protonated species. However, the fact that the magnitude of spectral modification caused by lowering the pH is on a much reduced scale with respect to that resulting from raising the pH (addition of TEA) indicates a greater sensitivity of 5ClSA towards reaction with a base, as expected given the acidic nature of the compound itself. Similar results are observed during pH variation experiments in other media also (water, MeOH; data not shown). These findings are also consistent with other studied systems.2,7,19,30,42 Again, our assignments of spectral response of 5ClSA towards variation of pH at moderate values is further reinforced through a direct comparison with SA. The SA molecule exhibits a blue-shift of absorption wavelength (∼310 nm to ∼300 nm in MCH) upon addition of base (TEA), with the effect being reversed, i.e. a red-shift (∼310 nm to ∼318 nm) upon treatment with acid (TFA; data not shown).
The emission profile of 5ClSA (Fig. 3a) displays an attractive feature in terms of producing a large Stokes-shifted emission band in all types of solvents when excited at λabsmax. This is regarded as the “spectroscopic signature” of the ESIPT reaction, i.e. a manifestation of the marked difference between E- and K-forms with respect to electronic structure and stability, since the emission observed in the range 420–440 nm is coming from the K-form (Scheme 1). However, in non-interacting or less interacting solvents like MCH, DCM, THF etc., a distinct dual emission is observed, with the higher energy band being located in the 360–375 nm wavelength region. This is attributable to the local emission from the R-form of 5ClSA (Scheme 1). It is, however, interesting to note that the prominence of the dual emission fades in more polar and protic solvents due to extensive solute–solvent interactions (of various forms and magnitudes, such as dipole–dipole interactions, intermolecular H-bond formation etc.) coming into play. This leads to broadening of the spectrum, and the emission from the R-form becomes obscured. In the present case too, a direct comparison with emission spectral characteristics of SA strengthens our spectral assignments of 5ClSA. In SA the operation of the ESIPT reaction is also manifested through a large Stokes-shifted emission in all types of solvents, centered at 425–456 nm region together with a high energy emission band at ∼350 nm from the R-form of SA (data not shown). Here also the emission bands of 5ClSA are slightly blue shifted compared to SA due to the presence of chlorine atom.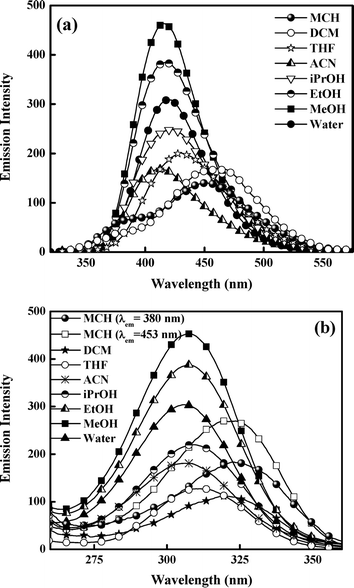 |
| | Fig. 3 (a) Emission (λex≈ 310 nm) and (b) excitation (λex= λmaxem) spectra of 5ClSA in various solvents at room temperature. | |
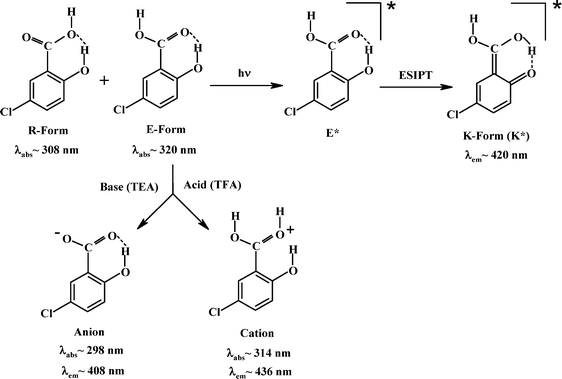 |
| | Scheme 1 The ground- and excited-state species of 5ClSA and a schematic of its photophysics. | |
Fig. 3b reveals that the excitation spectra obtained in all solvents are a faithful replication of the corresponding absorption spectra, indicating that the origin of the tautomer (K-form) emission is through excitation of the E-form.
3.4 Effect of variation of pH on emission spectra
As in the case of absorption spectra, the pH variation experiments on the emission profile also yielded some interesting results. As seen in Fig. 4a, the emission maximum is shifted to the blue (λem∼415 nm to ∼407 nm) with concomitant intensity enhancement with increasing pH of the medium (addition of TEA in ACN solution of 5ClSA). This is due to the formation of the anion of 5ClSA on being treated with a base, TEA (Scheme 1). Conversely, addition of an acid (TFA in ACN solution of 5ClSA, Fig. 4b) gave the reverse effect, i.e. a red shift (λem∼415 nm to ∼436 nm) of emission maxima coupled with a decrease of the tautomer emission intensity. This observation is understandable, since addition of an acid will result in protonation of 5ClSA (Scheme 1), thereby arresting the operation of ESIPT in the protonated species, as reflected in reduction of the tautomer emission intensity. However, some residual tautomer emission is present even at an appreciable acid concentration, and this is argued based on the idea that some of the protonated species undergo deprotonation following photoexcitation, thus becoming responsible for the still-present tautomer emission. It is noteworthy that very similar observation was found with SA under same experimental conditions. Treatment with TEA results in blue shift of the emission maxima of SA from ∼456 nm in MCH to ∼423 nm with a simultaneous intensity increase. This ∼423 nm emission band is formally attributed to the anionic species formed upon deprotonation of the –COOH group of SA, whereas the result of addition of TFA in MCH solution of SA is suppression of tautomer (PT) emission (∼456 nm), with subsequent enhancement of the higher energy emission from the R-form (∼375 nm) (data not shown). Therefore, a direct comparison of 5ClSA with its parent molecule SA stands in strong support of our present findings and assignments.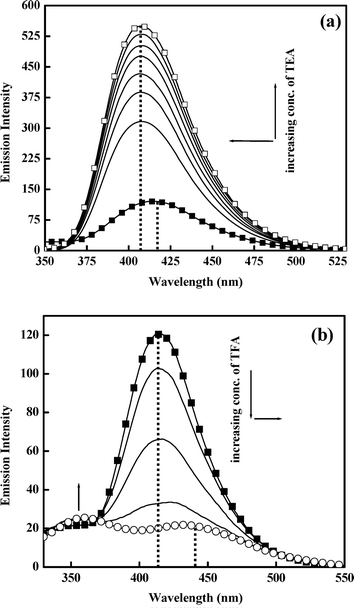 |
| | Fig. 4 Effect of addition of (a) base (TEA) (λex = 316 nm) and (b) acid (TFA) (λex = 316 nm) on the emission spectra of 5ClSA in ACN medium. | |
3.5 Fluorescence quantum yield
Table 1 lists the fluorescence quantum yields of 5ClSA in solvents of different polarities as measured relative to recrystallized β-naphthol using eqn (1). The high magnitude of quantum yields for the red-shifted emission probably points towards a greater transition cross-section of the K*-form. Later on we found that the computed oscillator strength for K*-form is higher than that of the E*-form. The probability of E* emission should be small, as the ESIPT reaction is inherently ultrafast in nature and the oscillator strength for the S1←S0 transition of the E* state is low. Moreover, Table 1 shows that the quantum yield values decrease with increasing H-bond forming ability of the solvents. This is ascribed to opening up of the radiationless deactivation channels that operate via intermolecular H-bonds formed between 5ClSA and the protic solvents.3.6 Fluorescence lifetime measurements
Fluorescence lifetime measurements often serve as a sensitive indicator of the local environment of a fluorophore, and are responsive to excited-state interactions.2–8 This technique provides an efficient way to address and monitor sensitive issues like differential degrees of solvent relaxation around a fluorophore, the presence of more than one chemical entity in a solution, and so forth. Thus in order to achieve a deeper insight into the photophysics of the investigated compound 5ClSA, we have recorded the fluorescence lifetime in various solvents. The typical decay profile is presented in Fig. 5 with the corresponding fitting parameters being summarized in Table 2. The fluorescence decay patterns in all types of solvents (except water) are found to be best fitted to a biexponential function with acceptable values of χ2. Scrutiny of the data presented in Table 2 reveals that the results follow a qualitatively similar pattern during monitoring the fluorescence decay at either of the two emission wavelengths (shorter wavelength corresponding to the R-form and longer wavelength to the K-form of 5ClSA; see Chart 1), reflecting the presence of a fast major component and a slow minor component. In analogy with the literature,1–16 the faster component seems attributable to the K*-form produced through an intrinsic proton exchange reaction in photoexcited 5ClSA, and thus the slower component is responsible for the R*-form. Such a proposition, at one extreme, justifies the inherent ultrafast nature of the ESIPT reaction, as also supported by the drastic reduction of the energy barrier to ESIPT following photoexcitation (Fig. 6, Section 3.7). On the other, a major contribution from the K*-form seems to verify the observation that on the S1 surface the thermodynamic stability of the E- and K-forms are virtually inverted (Fig. 8, Section 3.7), leading to greater stability of the latter (because of the operation of the ESIPT reaction). The situation is, however, found to be different in an aqueous medium, yielding monoexponential decay with a longer lifetime (Table 2). The fluorescence decay behaviour of 5ClSA is indeed found to be in excellent alignment with those of the parent compound SA, which exhibits a biexponential decay with a fast major component and a slow minor component (in ACN: α1 = 0.80 ns, τ1 = 0.402 ns, α2 = 0.20 ns, τ2 = 4.16 ns and <τ> = 3.09 ns, χ2 = 1.11; in MeOH: α1 = 0.87 ns, τ1 = 0.42 ns, α2 = 0.13 ns, τ2 = 5.24 ns and <τ> = 3.56 ns, χ2 = 1.05) attributable to the K*- and R*-forms, respectively.
Table 2 Fluorescence lifetimes of 5ClSA in various solvents at room temperature
| Solvent (λem) | α1 | α2 | τ1 (ns) | τ2 (ns) | <τ> (ns) | χ2 |
|---|
| MCH (380 nm) | 0.86 | 0.14 | 2.18 | 4.73 | 2.58 | 1.13 |
| MCH (455 nm) | 0.56 | 0.44 | 1.78 | 3.65 | 2.93 | 1.08 |
| DCM (455 nm) | 0.92 | 0.08 | 1.19 | 5.60 | 2.47 | 1.02 |
| DOX (460 nm) | 0.89 | 0.11 | 1.57 | 6.99 | 3.49 | 0.93 |
| ACN (415 nm) | 0.54 | 0.46 | 1.26 | 5.30 | 4.42 | 1.02 |
| Water (420 nm) | 1.00 | — | 7.28 | — | — | 1.06 |
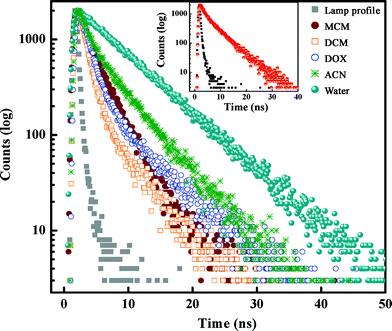 |
| | Fig. 5 Time-resolved fluorescence decays of 5ClSA in various solvents (λex = 295 nm and λmonitored = λem). Inset shows the decay profile for λmonitored = λem = 380 nm (R-form) in MCH. | |
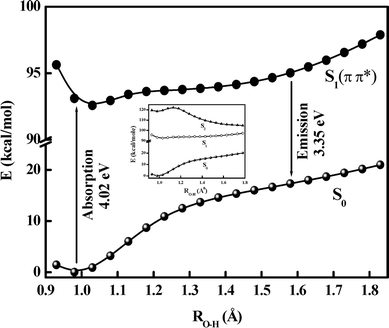 |
| | Fig. 6 Plot of energy (kcal mol−1) vs. Od–H1 coordinate (Å). GSIPT curve (S0) and ESIPT Franck–Condon curves (S1) for 5ClSA calculated at the DFT/B3LYP/6-311G** level. Inset shows a combined view of the PECs for the S0, S1 and S2 states. | |
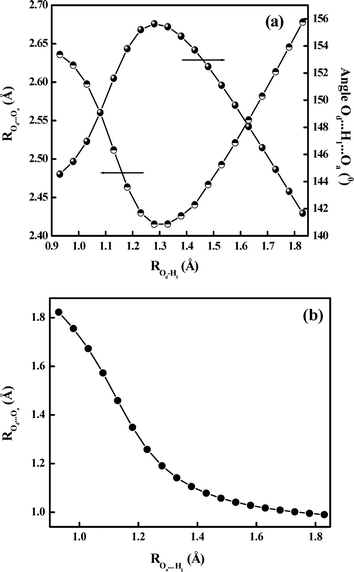 |
| | Fig. 7 Variation of (a) Od⋯Oa distance and Od⋯H1⋯Oa angle and (b) Oa⋯H1 distance with PT reaction coordinate (Od–H1 distance) in the S0-state, as calculated at the DFT/B3LYP/6-311G** level. | |
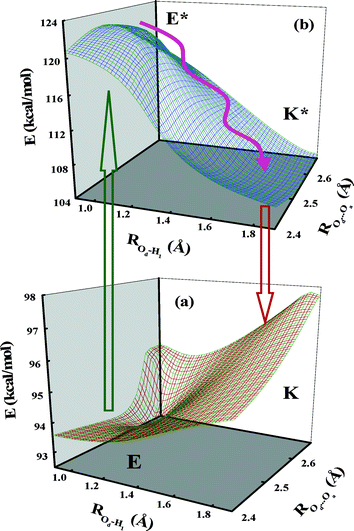 |
| | Fig. 8 Three-dimensional potential energy surfaces for the (a) ground and (b) excited states plotted as a function of Od–H1 and Od⋯Oa distances for the PT reaction in 5ClSA. | |
3.7 Computational details
3.7.1 Structural and electronic changes associated with ESIPT. The conformational landscapes of 5ClSA are explored in the electronic ground state by the HF method with the 6-311G** basis set and the DFT method with the B3LYP hybrid functional and 6-311G** basis set to achieve an initial insight into the photophysics of the compound and the ESIPT reaction. The structural parameters for the E- and K-forms at both levels are collected in Table 3. Out of all possible low energy conformers of 5ClSA, the E-form is predicted to be the most stable ground-state form (Chart 1) as expected due to extra stabilization gained from the six-membered IMHB ring. Table 3 shows the optimized parameters for the ground-state (GS) and excited-state (ES) geometries of 5ClSA calculated at the HF/6-311G** level of theory. Lengthening of the Od–H1 bond from 0.949 Å (GS) to 0.967 Å (ES) and shortening of Od⋯Oa distance from 2.661 Å to 2.579 Å together with increase of ∠Od⋯H1⋯Oa angle from 140.653° to 146.978° as a result of transition from the ground to the excited state are in line with translocation of the proton from the –OH to the –COOH group following photoexcitation. The Od⋯Oa distance and ∠Od⋯H1⋯Oa angle for the K-form are found to be closer to the corresponding excited-state parameters of the E-form (E*), which is an indication of the ESIPT reaction.
Table 3 Optimized ground and excited-state structural parameters (distances in Angstroms, angles in degrees) for 5ClSA relevant to the ESIPT reaction, as obtained from calculations at the HF and CIS levels using the 6-311G** basis set, and the DFT level using the B3LYP hybrid functional and the 6-311G** basis set
| Parameter | HF level | DFT level |
|---|
| E-form | K-form | E-form | K-form |
|---|
| Ground state | Excited state | Ground state | Ground state | Ground state |
|---|
| Od–H1 | 0.949 | 0.967 | 1.600 | 0.982 | 1.600 |
| H1⋯Oa | 1.858 | 1.714 | 0.986 | 1.753 | 1.024 |
| Oa–C2 | 1.195 | 1.219 | 1.280 | 1.224 | 1.299 |
| C2–C3 | 1.475 | 1.430 | 1.386 | 1.467 | 1.401 |
| C3–C4 | 1.398 | 1.473 | 1.447 | 1.416 | 1.460 |
| C4–Od | 1.326 | 1.294 | 1.232 | 1.339 | 1.263 |
| ∠Od⋯H1⋯Oa | 140.653 | 146.978 | 147.478 | 145.543 | 149.003 |
| ∠C3–C4–Od | 124.070 | 119.765 | 122.466 | 123.227 | 122.637 |
| ∠H1⋯Oa–C2 | 100.94924 | 99.84873 | 107.66463 | 100.578 | 106.358 |
| Dipole moment (Debye) | 0.9751 | 0.8056 | — | — | — |
Photoexcitation of 5ClSA necessarily imparts some significant modification of the electronic charge density on the heavy atoms of the molecule, a repercussion of which is the operation of the ESIPT reaction. Thus, close inspection of the charge distribution over the atoms (particularly the atoms constituting the ESIPT site) highlights another aspect of the process. The increase of negative charge distribution on the O-atom of the –COOH group (−0.518 in GS to −0.545 in ES) together with a decrease of the same on the O-atom of the –OH group (−0.447 in GS to −0.428 in ES) (computed at the HF/6-311G** level according to the Mulliken scheme) also predicts favourable translocation of the proton in the excited surface. In the case of SA, at the same level of calculation, the negative charge increase at the O-atom of the acid group is from −0.524 in GS to −0.553 in ES and the decrease at the O-atom of OH group is from −0.451 in GS to −0.431 in ES. It is found that the numerical magnitude of the decrease in calculated negative charge density at the donor O-atom (OH group) is the same in both cases, but the increase in negative charge density at the acceptor O-atom (acid group) is greater in the case of SA than 5ClSA. This is ascribed to the electron-withdrawing inductive effect of the chlorine atom in 5ClSA. This implies a more favourable excited-state PT in SA than in 5ClSA. Also, such modification of electronic charge distribution following photoexcitation indicates that the molecule probably attains a delocalized state on the excited surface, which then relaxes to the K-form via transfer of the proton from –OH to –COOH. The transition from ground to excited state is found to exert an insignificant effect on the change of dipole moment (Table 3). This seems to corroborate experimental findings in terms of no significant dependency of the red-shifted emission wavelength upon medium polarity.2–4,7,19,30
3.7.2 Potential energy surfaces for the proton transfer reaction. The photophysics of 5ClSA with special attention to the ESIPT reaction can be best understood by investigating the potential energy surface (PES) along the PT reaction coordinate. This section thus deals with construction of the potential energy curves (PECs) utilizing the well-known “distinguished coordinate” approach19,30,44,45 with OH bond elongation as the primary reaction coordinate.30,36,40,44,45 The minimum-energy paths (MEPs) connecting the two stable structures in each electronic state have been calculated to identify the major coordinates involved in the PT process, and the results are displayed in Fig. 6. For the S0 state, all of the other degrees of freedom are relaxed without imposing any symmetry constraints. Analysis of the PECs in Fig. 6 reveals that on the S0 surface the E-form resides on the global minimum. The high instability of the K-form in the ground state coupled with the repulsive nature of the S0 state PEC dictates the nonviability of the ground-state intramolecular proton transfer (GSIPT) reaction in 5ClSA. As seen in Fig. 6, the S1 surface has an asymmetric double-well nature, with the barrier along the proton transfer coordinate being significantly reduced. This indicates not only that the GSIPT process might not operate, but also the feasibility of an ESIPT process in 5ClSA. These results are consistent with experimental findings and also are in line with similar systems.2–4,19,30,36,44,45 Furthermore, it is fascinating to note that our theoretical computations do not deviate much from those including high-level calculations,9,34 at least in respect of predicting the nature of PES and the overall photophysics of the compound. As long as the PEC of the parent compound SA is concerned, qualitatively a very similar nature of both S0 and S1 state PECs is obtained. In SA (at the same level of theory: DFT//B3LYP/6-311G**), the operation of the GSIPT reaction is negated by the repulsive nature of the S0 PEC, which poses a barrier height of ∼0.55 eV. At the same time, photoexcitation to the S1 surface results in drastic depletion of the barrier height (∼0.018 eV) to the ESIPT process. Furthermore, the PEC for the S0 state of SA predicts that the E-form is the global minimum, and the S1-surface is found to have a double-well character as a result of inversion of thermodynamic stability of the E- and K-forms. These results are also found to agree with other reports on this well-known system SA.30,36,39,40Fig. 6 shows the variation of the Od⋯Oa distance and the ∠Od⋯H1⋯Oa angle as a function of PT coordinate (i.e. Od–H1 distance), to show that the occurrence of PT involves significant deformation of the entire molecular framework. As seen in the figure, the Od⋯Oa distance contracts to a minimum and the ∠Od⋯H1⋯Oa angle increases to a maximum before relaxing to the K-form. This may be the reason why the S0 and S1 surfaces are quite distinct with respect to their gross appearances and also why the S1-surface minima are relatively shallow and located at a larger OH distance than S0-surface minimum (Fig. 6). A crossover point between E- and K-forms is obtained at ROH∼ 1.3 Å. This mirror-image plot verifies the adoption of the relaxed scan procedure for evaluation of PECs, as otherwise a frozen or unrelaxed calculation (i.e. elucidation of PECs only by varying the PT coordinate, Od–H21 bond distance, keeping all other geometry parameters fixed) must have entailed some obvious errors.44Fig. 7 shows that the PT is dominated by a large change of distance between the two heteroatoms. The transfer mechanism can be described in three consecutive phases associated with the three regions in the S1 MEP energetics, viz., E* minimum, barrier, and K* minimum (Fig. 6). In the first phase the Od⋯Oa distance decreases (from 2.63591 to 2.41520 Å) along with a shortening of the Oa⋯H1 distance (from 1.82254 to 1.19075 Å), while the Od–H1 bond is elongated much less (+0.3 Å). At the barrier, the Od⋯Oa distance attains a minimum and the Od–H1 bond character changes to a Oa–H1 bond character. Finally, the heteroatoms separate again and the proton remains with the Oa atom. The temporal evaluation of the S1 geometry starts from the FC-point (with the geometry of E), and when the system passes through the E* geometry, it has already gained considerable momentum, which is sufficient to carry it over the small barrier to K*, thus allowing ESIPT. The large gradient of PES at the FC point is the driving force that initiates the ultrafast PT process.
Fig. 8a and b depict the 3D PESs for the S0 and S1 states towards the ESIPT process in 5ClSA. As seen in the figure, the transformation from E- to K-form on the S0-surface involves a transition state (TS) with high barrier energy. The E-form is located at a global minimum on the S0-surface, whereas quite the reverse pattern occurs for the S1-surface, i.e., the stability of E- and K-forms (precisely E*- and K*-forms) are exchanged and the process of transformation faces a vanishingly small barrier. Thus our experimental findings on the ESIPT reaction receive considerable support from theoretical computations.
Variation of oscillator strength on traversing from the E*- to the K*-form as a function of ROd–H1 distance in the S1 state (Fig. 9) supports the high quantum yield of the K*-form (as seen in Section 3.5), since the oscillator strength for K*-form is much greater than that of the E*-form.
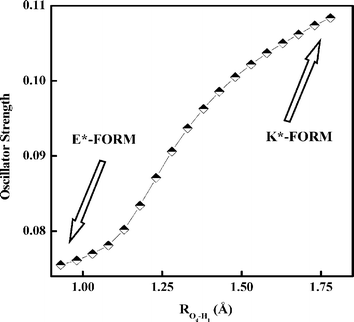 |
| | Fig. 9 Variation of oscillator strength with PT reaction coordinate (Od–H1 distance) in the S1 state as computed at the TDDFT/B3LYP/6-311G** level. | |
3.7.3 Molecular orbital analysis. The nodal plane concept of a π-system molecular orbital to rationalize the phenomenon of ESIPT was first developed by Nagaoka and Nagashima and has been successfully extended to various systems to a commendable degree of fruition.51–53 Analysis of the HOMO and LUMO shows that the HOMO is a π-orbital with bonding character primarily across the C2–C3–C4 bond and antibonding character across the C4–Od and C2–Oa bonds for both E- and K-forms. As observed in Fig. 10, the HOMO of both E- and K-forms consists of a large electronic density projection over the Od-atom along with bonding character along the Od–H1 axis. Thus, transfer of the proton does not lead to any further stabilization through electronic redistribution. In contrast, the LUMO is of π* character, and excitation of an electron from the HOMO to the LUMO in the E-form leads to specific localization of the π-electron density over the IMHB ring with antibonding character along the C4–Od and C2–Oa bond axes. Transfer of a proton in the excited state produces a LUMO in which the Oa-atom undergoes an enrichment of electronic density projection and a reduction of the same over the Od-atom. The presence of a nodal plane between the C4–Od and C2–Oa bonds prevents electron delocalization involving the aromatic nucleus, thereby forbidding the reversal of proton transfer in the excited state.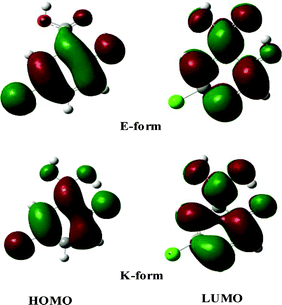 |
| | Fig. 10 Molecular orbital pictures (HOMO–LUMO) of the E- and K-forms of 5ClSA as obtained from the DFT/B3LYP/6-311G** level of calculation. | |
3.7.4 Calculation of EIMHB. As seen in Fig. 11, DFT calculations yield energies for different conformations of 5ClSA produced by variation of torsional angle (θ) at the hydroxyl and carboxyl sites separately. The strength of IMHB (EIMHB) for the A form (Chart 1) has been found to be ∼11.56 kcal mol−1 (10.48 kcal mol−1 at the HF/6-311G** level) by rotating the phenolic OH group out of the H-bonded configuration and computing the energy difference between the closed form (E) and open form (A) (Fig. 11a).7,30 A similar calculation has been carried by rotating the –COOH functional moiety, and the strength of IMHB (EIMHB) for the R-form is found to be ∼3.85 kcal mol−1 (3.33 kcal mol−1 at HF/6-311G** level). The difference in EIMHB seems to account for the presence of a weak H-bonding interaction in the R-form. A similar calculation at the DFT level for SA shows an IMHB of 11.63 kcal mol−1 and 3.79 kcal mol−1 for the A-form and R-form, respectively. This means a stronger IMHB in SA compared to that in 5ClSA in the ground state, affording further verification to the proposition of a more favourable ESIPT in SA than in 5ClSA. The electron-withdrawing inductive effect of the chlorine atom may be responsible for such a weakening of IMHB strength. According to Zadorozhny and Ischenzo,54 the intramolecular hydrogen bond energy (EIMHB) can be expressed by the relation:  , where ΔνC
![[double bond, length as m-dash]](https://www.rsc.org/images/entities/char_e001.gif) O and KC
O and KC![[double bond, length as m-dash]](https://www.rsc.org/images/entities/char_e001.gif) O are the magnitudes of the spectral shift and proportionality constant coefficient, respectively (reported value of KC
O are the magnitudes of the spectral shift and proportionality constant coefficient, respectively (reported value of KC![[double bond, length as m-dash]](https://www.rsc.org/images/entities/char_e001.gif) O = 9.6 × 10⁻⁴ mol kJ−1).54 Relative to the model compound benzoic acid (νC
O = 9.6 × 10⁻⁴ mol kJ−1).54 Relative to the model compound benzoic acid (νC![[double bond, length as m-dash]](https://www.rsc.org/images/entities/char_e001.gif) O = 1745 cm−1), a red-shift of the C
O = 1745 cm−1), a red-shift of the C![[double bond, length as m-dash]](https://www.rsc.org/images/entities/char_e001.gif) O stretching frequency in both cases of SA (Δν = 82 cm−1) and 5ClSA (Δν = 70 cm−1) is indicative of the presence of IMHB in the compounds. The calculated value of IMHB energy stands at 12.28 kcal mol−1 and 10.41 kcal mol−1, respectively for SA and 5ClSA. Apart from showing an excellent agreement with computed results, the experimental values of IMHB energies are found to strongly complement our proposition of a weaker IMHB in 5ClSA.
O stretching frequency in both cases of SA (Δν = 82 cm−1) and 5ClSA (Δν = 70 cm−1) is indicative of the presence of IMHB in the compounds. The calculated value of IMHB energy stands at 12.28 kcal mol−1 and 10.41 kcal mol−1, respectively for SA and 5ClSA. Apart from showing an excellent agreement with computed results, the experimental values of IMHB energies are found to strongly complement our proposition of a weaker IMHB in 5ClSA.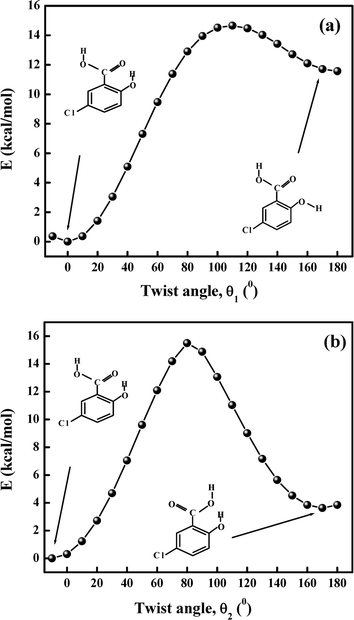 |
| | Fig. 11 Variation of energy during the transformation (a) from the E to the A form of 5ClSA by changing the angle θ1 and (b) from the E to the R form by changing the angle θ2 at the DFT//B3LYP/6-311G** level of calculation. | |
4. Summary
The detailed photophysics of 5ClSA have been investigated using absorption and emission spectroscopy and quantum chemical calculation and compared with its parent molecule SA. The two absorption bands in non-interacting and less interacting solvents confirm the presence of two conformers of 5ClSA, namely the E- and R-forms, as was found for SA. The lack of prominence of two humps in the absorption spectra with increasing solvent polarity and/or H-bonding property seems to be attributable to the enhanced degree of solute–solvent interaction coming into play through the operation of dipole–dipole interactions, intermolecular H-bonding etc. Appearance of a large Stokes-shifted emission with negligible sensitivity towards moderate polarities indicates the operation of the ESIPT process in 5ClSA. Dual emission in non-interacting or less interacting solvents originates from the R-form (higher energy band) and the tautomer, the K-form (lower energy band). Both the absorption and emission bands in 5ClSA are blue-shifted with respect to SA due to the electron-withdrawing inductive effect of the chlorine atom. Computational results predict the occurrence of an intramolecularly hydrogen-bonded lowest-energy E-form and a low-energy R-form in the ground state. Evaluation of the PES predicts the non-viability of a GSIPT reaction, as it has to pass through a high-energy barrier, whereas the feasibility of an ESIPT reaction is manifested by a noticeable reduction of the barrier in the S1-surface. Together with this, modification of structural parameters and the electron density distribution at the IMHB ring site are also in accord with the occurrence of proton transfer on the excited-state surface. Our assignments of all experimental and theoretical findings receive sound support from a direct comparison with the parent compound SA, with simultaneous exploration of the fact that a chloro substitution at the 5-position of the aromatic nucleus has some impact on the overall photophysics of SA, at least qualitatively. The electron-withdrawing inductive influence of the chlorine substitution seems to be reflected through the modulated hydrogen bond strength, charge density and proton transfer barrier of 5ClSA relative to SA. At the same time, we are optimistic that the detailed photophysical study of this pharmaceutically significant compound will have a positive effect in the understanding of its future applications.
Acknowledgements
NG acknowledges DST, India (Project no. SR/S1/PC/26/2008) and CSIR, India (Project no. 01(2161)07/EMR-II) for financial support. BKP and AS gratefully acknowledge the Council of Scientific and Industrial Research, New Delhi, India, for a research fellowship. The authors are indebted to Ms. Deboleena Sarkar and Prof. Nitin Chattopadhyay of Jadavpur University, Calcutta, India, for fluorescence lifetime measurements.References
-
(a) A. H. Weller, Prog. React. Kinet., 1961, 1, 187–214 CAS;
(b) H. Beens, K. H. Grellmann, M. Gurr and A. H. Weller, Discuss. Faraday Soc., 1965, 39, 183–193 RSC.
- R. B. Singh, S. Mahanta, S. Kar and N. Guchhait, Chem. Phys., 2007, 331, 373–384 CrossRef CAS.
- R. B. Singh, S. Mahanta, S. Kar and N. Guchhait, J. Photochem. Photobiol., A, 2008, 200, 325–333 CrossRef CAS.
-
(a) S. Mahanta, R. B. Singh, S. Kar and N. Guchhait, Chem. Phys., 2007, 324, 742–752;
(b) R. B. Singh, S. Mahanta, S. Kar and N. Guchhait, Chem. Phys., 2007, 331, 189–199 CrossRef CAS.
- J. R. Lakowicz, Principles of Fluorescence Spectroscopy, Plenum, New York, 1999 Search PubMed.
- P. Chowdhury, S. Panja and S. Chakravorti, J. Phys. Chem. A, 2003, 107, 83–90 CrossRef CAS.
- H. Mishra, H. C. Joshi, H. B. Tripathi, S. Maheshwary, N. Sathyamurthy, M. Panda and J. Chandrasekhar, J. Photochem. Photobiol., A, 2001, 139, 23–36 CrossRef CAS.
- J. Catalan and J. L. G. de Paz, J. Phys. Chem. A, 2008, 112, 904–114 CrossRef CAS.
- A. L. Sobolewski and W. Domcke, Chem. Phys., 1998, 232, 257–265 CrossRef CAS.
- D. D. Pant, H. C. Joshi, P. B. Bisht and H. B. Tripathi, Chem. Phys., 1994, 185, 137–144 CrossRef CAS.
- T. Yahagi, A. Fujii, T. Ebata and N. Mikami, J. Phys. Chem. A, 2001, 105, 10673–10680 CrossRef CAS.
- K. Sakota and H. Sekiya, J. Phys. Chem. A, 2005, 109, 2722–2727 CrossRef CAS.
- P. B. Bisht, M. Okamoto and S. Hirayama, J. Phys. Chem. B, 1997, 101, 8850–8855 CrossRef CAS.
- Y. Matsuda, T. Ebata and N. Mikami, J. Phys. Chem. A, 2001, 105, 3475–3480 CrossRef CAS.
- J. Catalan, P. Perez, J. C. del Valle, J. L. G. de Paz and M. Kasha, Proc. Natl. Acad. Sci. U. S. A., 2002, 99, 5793–5798 CrossRef CAS.
- J. Catalan, P. Perez, J. C. del Valle, J. L. G. de Paz and M. Kasha, Proc. Natl. Acad. Sci. U. S. A., 2002, 99, 5799–5803 CrossRef CAS.
- L. L. Premvardhan and L. A. Peteanu, J. Photochem. Photobiol., A, 2002, 154, 69–79 CrossRef CAS.
- A. L. Sobolewski and W. Domcke, Phys. Chem. Chem. Phys., 2006, 8, 3410–3417 RSC.
- J. Catalan and J. C. del Valle, J. Am. Chem. Soc., 1993, 115, 4321–4325 CrossRef CAS.
- J. Catalan, J. C. del Valle, R. M. Claramunt, D. Sanz and J. Doctor, J. Lumin., 1996, 68, 165–170 CrossRef CAS.
- H. J. Heller and H. R. Blattmann, Pure Appl. Chem., 1973, 36, 141 CrossRef CAS.
- P. T. Chou, M. L. Martinez and J. H. Clements, Chem. Phys. Lett., 1993, 204, 395–399 CrossRef CAS.
- P. T. Chou, D. MxMorrow, T. J. Aartsna and M. Kasha, J. Phys. Chem., 1984, 88, 4596–4599 CrossRef CAS.
- M. E. Balmer, H.-R. Buser, M. D. Muller and T. Poiger, Environ. Sci. Technol., 2005, 39, 953–962 CrossRef CAS.
- R. B. Singh, S. Mahanta and N. Guchhait, J. Photochem. Photobiol., B, 2008, 91, 1–8 CrossRef.
- R. B. Singh, S. Mahanta and N. Guchhait, Chem. Phys. Lett., 2008, 463, 183–188 CrossRef CAS.
- P. Chowdhury and S. Chakravorti, Chem. Phys. Lett., 2004, 395, 103–108 CrossRef CAS.
- K. Sahu, D. Roy, S. K. Mondal, R. Karmakar and K. Bhattacharyya, Chem. Phys. Lett., 2005, 404, 341–345 CrossRef CAS.
- S. Sutton, N. L. Campbell, A. I. Cooper, M. Kirkland, W. J. Frith and D. J. Adams, Langmuir, 2009, 25, 10285–10291 CrossRef CAS.
- S. Maheshwary, A. Chowdhury, N. Sathyamurthy, H. Mishra, H. B. Tripathi, M. Panda and J. Chandrasekhar, J. Phys. Chem. A, 1999, 103, 6257–6262 CrossRef CAS.
- A. Mitsuzuka, A. Fujii, T. Ebata and N. Mikami, J. Phys. Chem. A, 1998, 102, 9779–9784 CrossRef CAS.
- A. U. Acuna, F. Amat-Guerri, J. Catalan and F. Gonzalez-Tablas, J. Phys. Chem., 1980, 84, 629–631 CrossRef CAS.
- L. A. Helmbrook, J. E. Kenny, B. E. Kohler and G. W. Scott, J. Phys. Chem., 1983, 87, 280–289 CrossRef.
- R. W. Gora, S. J. Grabowski and J. Leszczynski, J. Phys. Chem. A, 2005, 109, 6397–6405 CrossRef CAS.
- J. D. Coe and T. J. Martinez, J. Phys. Chem. A, 2006, 110, 618–630 CrossRef CAS.
- H. Mishra, S. Maheshwary, H. B. Tripathi and N. Sathyamurthy, J. Phys. Chem. A, 2005, 109, 2746–2754 CrossRef CAS.
- E. A. El-Hakam Abou El-Nasr, A. Fujii, T. Yahagi, T. Ebata and N. Mikami, J. Phys. Chem. A, 2005, 109, 2498–2504 CrossRef.
- G. S. Denisov, N. S. Golubev, V. M. Schreiber, Sh. S. Shajakhmedov and A. V. Shumkhina, J. Mol. Struct., 1997, 436, 153–160 CrossRef.
- D. M. Friedrich, Z. Wang, A. G. Joly, K. A. Peterson and P. R. Callis, J. Phys. Chem. A, 1999, 103, 9644–9653 CrossRef CAS.
- F. Lahmani and A. Zehnacker-Rentien, J. Phys. Chem. A, 1997, 101, 6141–6147 CrossRef CAS.
- L. Rodriguez-Santiago, M. Sodupe, A. Oliva and J. Berntran, J. Am. Chem. Soc., 1999, 121, 8882–8890 CrossRef CAS.
- I. P. Pozdnyakov, A. Pigliucci, N. Tkachenko, V. F. Plyusnin, E. Vauthey and H. Lemmetyinen, J. Phys. Org. Chem., 2009, 22, 449–454 CrossRef CAS.
- P. B. Bisht, H. Petek, K. Yoshihara and U. Nagashima, J. Chem. Phys., 1995, 103, 5290–5307 CrossRef CAS.
- R. de Vivie-Riedle, V. D. Waele, L. Kurtz and E. Riedle, J. Phys. Chem. A, 2003, 107, 10591–10599 CrossRef CAS.
- J. A. Organero, M. Moreno, L. Santos, J. M. Liuch and A. Douhal, J. Phys. Chem. A, 2000, 104, 8424–8431 CrossRef CAS.
- L. Kozma, I. Hornak, I. Eroshtak and B. Nemet, Z. Prikladnoi Spektr., 1991, 53, 259–265 Search PubMed.
- M. Lukeman, D. Veale, P. Wan, V. Ranjit, N. Munasinghe, John and E. T. Corrie, Can. J. Chem., 2004, 82, 240 CrossRef CAS.
- M. J. Frisch et al., Gaussian 03, Revision B.03, Gaussian, Inc., Pittsburgh, PA, 2003 Search PubMed.
- A. L. Sobolewski, W. Domcke and C. Hattig, J. Phys. Chem. A, 2006, 110, 6301–6306 CrossRef CAS.
- M. J. Paterson, M. A. Robb, L. Blancafort and A. D. DeBellis, J. Am. Chem. Soc., 2004, 126, 2912–2922 CrossRef CAS.
- S-i. Nagaoka and U. Nagashima, Chem. Phys., 1996, 206, 353–362 CrossRef CAS.
- S-i. Nagaoka, J. Kusunoki, T. Fujibuchi, S. Hatakenaka, K. Mukai and U. Nagashima, J. Photochem. Photobiol., A, 1999, 122, 151–159 CrossRef CAS.
- S-i. Nagaoka, A. Nakamura and U. Nagashima, J. Photochem. Photobiol., A, 2002, 154, 23–32 CrossRef CAS.
-
(a) B. A. Z. Zadorozhny and I. K. Ischenzo, Opt. Spectrosc. (Engl. Trans.), 1965, 19, 306–308 Search PubMed;
(b) S. Tobita, M. Yamamoto, N. Kurahayashi, R. Tsukagoshi, Y. Nakamura and H. Shizuka, J. Phys. Chem. A, 1998, 102, 5206–5214 CrossRef CAS.
|
| This journal is © The Royal Society of Chemistry and Owner Societies 2010 |
Click here to see how this site uses Cookies. View our privacy policy here. 



 , where ΔνC
![[double bond, length as m-dash]](https://www.rsc.org/images/entities/char_e001.gif) O and KC
O and KC![[double bond, length as m-dash]](https://www.rsc.org/images/entities/char_e001.gif) O are the magnitudes of the spectral shift and proportionality constant coefficient, respectively (reported value of KC
O are the magnitudes of the spectral shift and proportionality constant coefficient, respectively (reported value of KC![[double bond, length as m-dash]](https://www.rsc.org/images/entities/char_e001.gif) O = 9.6 × 10⁻⁴ mol kJ−1).54 Relative to the model compound benzoic acid (νC
O = 9.6 × 10⁻⁴ mol kJ−1).54 Relative to the model compound benzoic acid (νC![[double bond, length as m-dash]](https://www.rsc.org/images/entities/char_e001.gif) O = 1745 cm−1), a red-shift of the C
O = 1745 cm−1), a red-shift of the C![[double bond, length as m-dash]](https://www.rsc.org/images/entities/char_e001.gif) O stretching frequency in both cases of SA (Δν = 82 cm−1) and 5ClSA (Δν = 70 cm−1) is indicative of the presence of IMHB in the compounds. The calculated value of IMHB energy stands at 12.28 kcal mol−1 and 10.41 kcal mol−1, respectively for SA and 5ClSA. Apart from showing an excellent agreement with computed results, the experimental values of IMHB energies are found to strongly complement our proposition of a weaker IMHB in 5ClSA.
O stretching frequency in both cases of SA (Δν = 82 cm−1) and 5ClSA (Δν = 70 cm−1) is indicative of the presence of IMHB in the compounds. The calculated value of IMHB energy stands at 12.28 kcal mol−1 and 10.41 kcal mol−1, respectively for SA and 5ClSA. Apart from showing an excellent agreement with computed results, the experimental values of IMHB energies are found to strongly complement our proposition of a weaker IMHB in 5ClSA.
