Photophysics and photochemistry of dyes bound to human serum albumin are determined by the dye localization
Emilio Alarcóna, Ana Maria Edwardsa, Alexis Aspeeb, Faustino E. Moranc, Claudio D. Borsarellic, Eduardo A. Lissi*b, Danilo Gonzalez-Nilod, Horacio Pobleted and J. C. Scaianoe
aFacultad de Química, Departamento de Química Física, Pontificia Universidad Católica de Chile, Santiago, Chile
bDepartamento de Ciencias del Ambiente, Facultad de Química y Biología, Universidad de Santiago de Chile, USACH, Av. Bernardo O'Higgins, 3363, Santiago, Chile. E-mail: Eduardo.lissi@usach.cl
cInstituto de Química del NOA (INQUINOA-CONICET), Facultad de Agronomía y Agroindustrias, Universidad Nacional de Santiago del Estero, Santiago del Estero, Argentina
dCentro de Bio-informática, Universidad de Talca, Chile
eFaculty of Science, 10, Marie Curie, K1N 6N5, University of Ottawa, Canada
First published on 2nd December 2009
Abstract
The photophysics and photochemistry of rose bengal (RB) and methylene blue (MB) bound to human serum albumin (HSA) have been investigated under a variety of experimental conditions. Distribution of the dyes between the external solvent and the protein has been estimated by physical separation and fluorescence measurements. The main localization of protein-bound dye molecules was estimated by the intrinsic fluorescence quenching, displacement of fluorescent probes bound to specific protein sites, and by docking modelling. All the data indicate that, at low occupation numbers, RB binds strongly to the HSA site I, while MB localizes predominantly in the protein binding site II. This different localization explains the observed differences in the dyes' photochemical behaviour. In particular, the environment provided by site I is less polar and considerably less accessible to oxygen. The localization of RB in site I also leads to an efficient quenching of the intrinsic protein fluorescence (ascribed to the nearby Trp residue) and the generation of intra-protein singlet oxygen, whose behaviour is different to that observed in the external solvent or when it is generated by bound MB.
Introduction
Singlet oxygen (1O2) is a non-radical reactive oxygen species (ROS) extensively studied in the last decade due to its generation and role in a series of physiological processes.1–5 Principal targets of 1O2 in biological environments are proteins, mainly due to the efficient reactivity of 1O2 towards several amino acid residues and the large intrinsic protein concentration.6,7 The primary 1O2-mediated oxidation products in proteins are long-lived hydroperoxides,8–12 which in turn can be the source of free radicals in metal-catalyzed reactions, extending the initial damage to other protein sites and/or cellular targets.13–15 In addition, 1O2 can be easily produced by UV or visible light irradiation in the presence of photosensitizers.16 Rose bengal (RB) and methylene blue (MB) (Scheme 1) are among several natural and synthetic compounds used as photosensitizers, and are frequently employed for the photoinduced generation of 1O2,8–12,17–19 taking advantage of their high water solubility and quantum yield of 1O2 generation, ΦΔ.20,21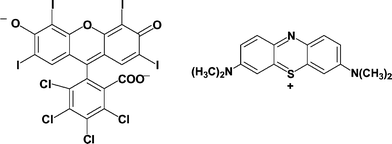 | ||
| Scheme 1 Chemical structure of rose bengal (RB; left) and methylene blue (MB; right). | ||
Several studies have employed human serum albumin (HSA) as a protein oxidation model.22–25 HSA is composed of 585 amino acids and with high alpha-helix content (67%). This protein reaches concentrations of ca. 0.6 mM in human plasma and its most important biological function is the transport of free fatty acids, as well as an extraordinarily broad range of molecules, including pharmaceutical drugs and photodynamic therapy agents.26–28 The crystallographic analysis of HSA has shown three homologous helical domains (I–III), with the whole structure stabilized by 17 disulfide bridges.29 This native conformation of the protein provides two principal binding sites for aromatic and heterocyclic molecules, called the Sudlow's sites I and II,30,31 which are located in sub-domains IIA and IIIA, respectively.32
The association of a photosensitizer molecule to a protein could modify both the photophysics and photochemistry of the dye, and the photooxidation mechanism of the macromolecule, a phenomenon that can be particularly important for albumins due to their high physiological concentrations and binding capacity.33,34 The incorporation of the dye molecule in the protein structure could lead to an alternative mechanism of photooxidation mediated by direct interaction of the dye with the protein and/or could comprise a site-specific type II photooxidation mechanism. Recently,35 we reported the photophysical and photochemical properties of RB associated with HSA. The results obtained were explained in terms of an efficient association of RB to both sites I and II of the protein, accompanied by the spectroscopic absorbance and emission modification together with a diminution of ΦΔ.
Bartlett and Indig19 employed MB as photosensitizer in the 1O2-mediated oxidation of bovine serum albumin (BSA). These authors proposed a change in the mechanism of oxidation due to the incorporation of the dye in the protein structure, but the characteristics of the binding of MB to BSA were not reported. Recently, Hu et al.36 studied the interaction of MB with HSA using the intrinsic fluorescence quenching of Trp 214 due to MB addition, obtaining an binding constant of 1 × 10⁵ M−1.
In dye-photosensitized protein oxidation the oxygen accessibility to the binding site can be an important factor in order to understand the main photooxidative mechanism. Vanderkooi et al.37–39 have performed a series of works in order to determine the oxygen accessibility to different proteins employing the oxygen quenching of Trp triplet phosphorescence as a sensor for oxygen accessibility. These authors concluded that the oxygen migration through well-structured cores of globular proteins could be slowed down over 1000 times in comparison to diffusion in water. In this work we report the photochemistry of two dyes, MB and RB, bound to HSA, with particular emphasis on the generation and fate of 1O2 in the dye-protein binding site.
Material and methods
Materials
Rose bengal (RB), methylene blue (MB), human serum albumin free of lipids, 99% (HSA), deuterium oxide, NaCl, NaHPO4, Na2HPO4, dansyl amide (DNSA) dansyl sarcosine (DS), S-naproxene, and S-warfarine were purchased from Sigma-Aldrich. All experiments were performed at 25 °C in phosphate buffer saline (PBS) 100 mM at pH 7.4, employing Milli-Q water and/or in deuterated PBS 100 mM, pD 7.4.Steady-state spectroscopic measurements
Absorption spectra were registered using a Hewlett Packard 8453 UV-visible spectrophotometer (Palo Alto, CA, USA) and/or a Cary-100 UV-Visible spectrophotometer. Fluorescence emission measurements were carried out in a Perkin Elmer LS-55 (Beaconstield, UK) or a Hitachi F-2500 (Kyoto, Japan) spectrofluorimeters, both equipped with a temperature-controlled 1.0 cm path cell holder.Quenching of the intrinsic Trp fluorescence by methylene blue
In order to assure a complete hydration process, all protein solutions were stabilized for 1 h before the measurements. The HSA concentration was adjusted to 10 μM using ε = 35![[thin space (1/6-em)]](https://www.rsc.org/images/entities/char_2009.gif) 353 cm−1 M−1 at 280 nm.33 The tryptophan (Trp) fluorescence quenching elicited by addition of MB aliquots (up to 50 μM) was performed with a fast scan speed (1000 nm min−1) and a slit width of 2.5 nm to minimize photobleaching of the protein. In order to minimize Tyr emission interference, excitation was carried out at 295 nm and the Trp emission was measured at 350 nm. All emission intensities were corrected for light absorption at 295 and 350 nm by MB, with the expression:40
353 cm−1 M−1 at 280 nm.33 The tryptophan (Trp) fluorescence quenching elicited by addition of MB aliquots (up to 50 μM) was performed with a fast scan speed (1000 nm min−1) and a slit width of 2.5 nm to minimize photobleaching of the protein. In order to minimize Tyr emission interference, excitation was carried out at 295 nm and the Trp emission was measured at 350 nm. All emission intensities were corrected for light absorption at 295 and 350 nm by MB, with the expression:40| Fcorr = Fnc× 10(A295+A350)/2 | (1) |
Competitive binding tests
Displacement of bound dansylsarcosine (DS) and dansylamide (DNSA) was assessed as previously described.35 Briefly, the change in the fluorescence intensity of the dansyl probes (λexc = 350 nm and λem = 470 nm) resulting from MB addition to a solution of HSA and dansyl complex (2 μM : 2 μM) was determined. All measurements were carried out at 25.0 ± 0.5 °C. Similar procedures were carried out to assess the displacement of RB by S-naproxen and S-warfarin (RB 10 μM; HSA 10 μM).41,42Dialysis measurements
The extent of association of MB to albumin was evaluated by dialysis. Briefly, solutions in PBS were prepared and vortexed for 45 s. The samples were then incubated in dialysis tubing cellulose membrane (MW > 12 kDa, Sigma-Aldrich) for 24 h in darkness at room temperature. Afterwards the concentration of free MB was calculated by absorbance measurements (εmax = 74![[thin space (1/6-em)]](https://www.rsc.org/images/entities/char_2009.gif) 000 M−1 cm−1) at 665 nm and the bound concentration of the dye was registered by difference. All measurements were carried out at 25.0 ± 0.5 °C.
000 M−1 cm−1) at 665 nm and the bound concentration of the dye was registered by difference. All measurements were carried out at 25.0 ± 0.5 °C.Time-resolved measurements
The RB samples were excited using the second harmonic from a Surelite II, Nd-YAG laser (532 nm, ca 10 ns, 3.5 mJ per pulse) for NIR emission, transient spectra and singlet oxygen measurements. MB measurements were carried out using a Surlite OPO Plus (pump with a Nd-YAG 355 nm) at 670 nm; 3.5 mJ per pulse for singlet oxygen emission or with the third harmonic from a Surelite II, Nd-YAG laser (355 nm, ca 10 ns, 10 mJ per pulse) for dye transient absorption measurements. In all cases, fused silica cells with a path length of 1.0 cm were employed.Methylene blue transient absorption spectra were recorded with an LFP 111 laser-flash photolysis system (Luzchem Inc., Ottawa, Canada). To minimize degradation of the sample, less than 10 single laser shots were averaged. All measurements were performed in aqueous PBS 100 mM, pH 7.4, N2-saturated solutions.
Singlet oxygen phosphorescence emission
The singlet oxygen phosphorescence decay traces after the laser pulse for RB and/or MB were registered at 1270 nm employing a Peltier-cooled (−62.8 °C) Hamamatsu NIR detector operating at 750 V coupled to a computer-controlled grating monochromator. The photocurrent from the PMT was stored on a digital oscilloscope (Tektronix TDS 2012). Signal rise times as short as 50 ns were measured using the amplifier SR-445 from Stanford Research. Primary data were acquired and analyzed with a customized Luzchem Research LFP-111 system. Measurements were performed in deuterated PBS (100 mM, pD 7.4) at room temperature. In order to prevent photodegradation of the sample, less than 10 shots were employed to obtain each decay profile.Docking simulations
The RB and MB structures were built using GaussView 3.09 software43 and their geometric optimization was performed with B3LYP/6-31G* and RESP (restrained electrostatic potential fitting).44 The HSA docking simulation was performed considering a flexible tryptophan residue (Trp-214) and carried out with an AutoDock4.3 software.45 The protein structure was taken from the protein data bank (1E78) with a crystalline resolution at 2.6 Å, as reported by Carter and He.29Results and discussion
Binding features of MB and RB to HSA
A pseudo-binding constant Kb between a low molecular weight dye (D) and HSA can be defined by: | (2) |
In order to assess the binding extent of MB to HSA we performed dialysis experiments. The data obtained, plotted as the number of bound dyes per protein as a function of the free dye concentration, are shown in Fig. 1. From this plot we obtain Kb = (1.5 ± 0.2) × 105 M−1, a value similar to that reported by Hu et al.36 from Trp fluorescence quenching by added dye. This binding constant implies that ca. 67% of dye is bound in presence of 10 μM HSA and that, under physiological conditions (HSA = 0.6 mM), less than 1.6% of the dye would remain free in solution.
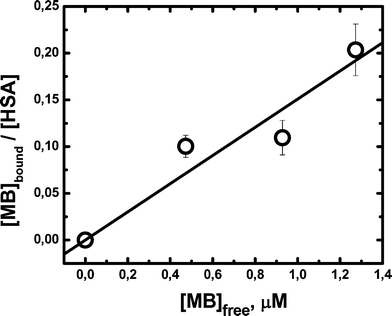 | ||
| Fig. 1 Adsorption isotherm measured by dialysis. The HSA concentration varied from 0 to 10 μM. MB = 1.5 μM. All the measurements were performed in PBS buffer 100 mM, pH 7.4 at 25.0 ± 0.5 °C. Bars indicate the standard error of four independent determinations. | ||
Protein addition to MB aqueous solutions changed both the absorbance and fluorescence spectra of the dye (data not shown) only slightly, even at high HSA concentration ([HSA] = 30 μM) where the photosensitizer is almost completely incorporated into the protein. The similarity between the spectra obtained for the free and bound MB suggests that the association takes place in a protein region readily accessible to the solvent. In order to characterize the main association site of MB to HSA, competitive binding in the presence of the fluorescent dyes dansyl amide (DNSA) and dansyl sarcosine (DS) was performed, Fig. 2. These probes bind specifically to sites I and II of HSA, respectively.30,31 The decrease of the DS fluorescence can be considered as indicative of a competitive binding of MB to the site II of the protein, which expels the dansyl probe to the bulk aqueous solvent. Instead, the DNSA fluorescence increase could be related to conformational changes in site I promoted by the incorporation of MB into site II. A similar behaviour has been described by Sudlow et al.,30,31 in a series of works aimed at establishing the association locus of several drugs to HSA. From the DS fluorescence diminution, it can be estimated, as a lower limit, that the association constant to site II is ca. (1.3 ± 0.4) × 105 M−1 by considering that ca. 15% of this probe is displaced at 2.0 μM analytical concentration of the dye. This value agrees very well with that obtained by dialysis experiments, confirming that MB association mostly takes place at the protein's site II. This is compatible with the affinity of this site for positively charged solutes.46,47
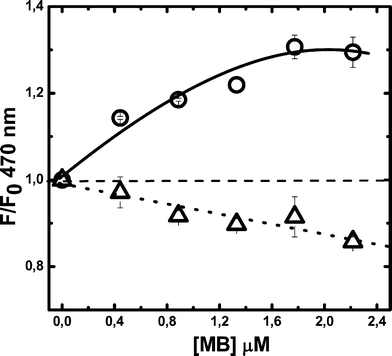 | ||
| Fig. 2 Changes in DS and DNSA fluorescence elicited by MB addition to previously formed fluorophore–HSA complexes. Experiments were carried out at pH 7.4 and complexes were preformed employing 2 μM HSA and 2 μM of DNSA (○) or DS (△). Emission: 470 nm; excitation: 350 nm. Bars correspond to the standard error of three independent determinations. | ||
The fluorescence quenching of the single Trp-214 residue in sub-domain IIA by MB was also evaluated, Fig. 3. The data, plotted according to the classical Stern–Volmer (SV) equation, show a noticeable downward curvature. From the initial linear region of the plot, a SV constant KSV = (3.60 ± 0.02) × 104 M−1 at 25 °C can be estimated. By considering a fluorescence lifetime of ca. 4.5 ns for the HSA-Trp residue,48 we estimate a bimolecular quenching constant kq≈ 8 × 10¹² M−1 s−1. This value is ca. three orders of magnitude higher than that expected for a diffusion-controlled process in water (≈5 × 10⁹ M−1 s−1). This implies that quenching must take place by a static mechanism involving ground state complex formation and/or a resonance quenching promoted by the binding of MB molecules in the proximity of the Trp-214 residue.
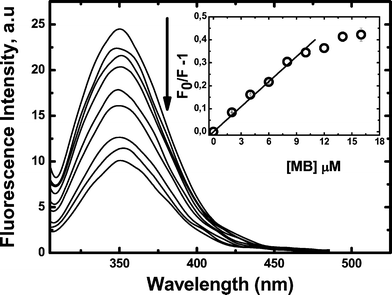 | ||
| Fig. 3 Intrinsic HSA (10 μM) fluorescence quenching due to MB addition. Excitation: 295 nm; emission: 350 nm. Inset shows the Stern–Volmer plot as a function of MB concentration. All measurements were performed in triplicate in PBS buffer 100 mM, pH 7.4 at 25.0 ± 0.5 °C. All fluorescence values were corrected by MB absorption at the excitation and emission wavelengths. | ||
Fig. 3 shows that for 10 μM HSA almost twenty percent of the intrinsic Trp-214 fluorescence was quenched by the addition of 6 μM MB. If we consider that quenching must involve at least one MB bound to the protein bearing the excited Trp, this implies that at least 2 μM of the MB is bound to albumin, leaving less than 4 μM as free MB in the external medium. From these data, an association constant value of 5.0 × 10⁴ M−1 can be estimated (see Table 1).
| Property | Free RB | Bound RB | Free MB | Bound MB |
|---|---|---|---|---|
| a Ratio between the values of the association constant derived from fluorescence quenching and physical separation.b Strong downward curvature in the Stern–Volmer plot.c Data from ref. 35.d Data from ref. 16. | ||||
| Fluorescence yield (ΦFL) | 0.017 | 0.18 | 0.040 | 0.038 |
| ET30 for the ground state/kcal mol−1 | 63.1 | 45.6c | 63.1 | 63.1 |
| ET30 for the singlet state/kcal mol−1 | 63.1 | 43.3c | 63.1 | 63.1 |
| Association constant/μM−1 | — | 1.6 ± 0.2 | — | 0.15 ± 0.02 |
| Efficiency of Trp fluorescence quenching by bound moleculea | — | 0.71 | — | 0.33 |
| Displacement of DS and/or DNSA | — | Both | — | DS |
| Displacement of RB by naproxen and/or warfarin | — | warfarin | — | — |
| Triplet lifetime/μs | 40 ± 5.0 (N2) | 130 ± 10 (N2) | 23 ± 2.0 (N2) | 10 ± 1.0 (N2) |
| <2 (air)c | ∼25 (air)c | <2 (air) | <2 (air) | |
| Triplet quantum yield (ΦT) | 0.90c | 0.45 ± 0.04c | 0.52 | 0.40 ± 0.05 |
| Apparent quenching constant of the triplet by oxygen/109 M−1 s−1 | 1.5 ± 0.1 | 0.1 ± 0.07 | 1.3 ± 0.2 | 1.8 ± 0.7 |
| Singlet oxygen lifetime/μs | 66 ± 3.0 | 68 ± 5.0 | 65 ± 3.0 | 17 ± 2.0 |
| Apparent rate constant for singlet oxygen quenching by azide/109 M−1 s−1 | 0.57 ± 0.09 | b | 0.60 ± 0.03 | 0.80 ± 0.06 |
| Singlet oxygen rise time/μs in air equilibrated solution | <1 | ∼20 | <1 | <1 |
| Singlet oxygen quantum yield (ΦΔ) | 0.76d | 0.33 ± 0.03 | 0.52 | 0.45 ± 0.05 |
In static quenching processes, the KSV value corresponds to the total binding constant of the quencher to the protein if a bound quencher totally suppresses the intrinsic protein fluorescence. If this condition is not fulfilled, the SV constant underestimates the Kb value. A comparison of the data obtained from quenching experiments with Kb values reported in Table 1 show that the KSV value for the MB quenching of the intrinsic Trp fluorescence is almost four-times smaller than the Kb values estimated by dialysis and dansyl displacement experiments. This can be due to the rather large distance (ca. 30 Å) between Trp-214 and the protein site II.49 This would reduce the quenching efficiency of the bound dye and could explain the downward curvature of the SV-plot, Fig. 3.
Interestingly, the MB-binding features to HSA are noticeably different to those reported for RB.35 The anionic RB strongly binds to HSA with Kb = 1.5 × 10⁶ M−1, implying almost full binding of the dye (ca. 97%) by 10 μM HSA. Furthermore, from the absorption and emission spectra of bound RB molecules it was concluded that the adsorbed dye senses a microenvironment whose polarity (measured by its ET30 value50) is similar to that of DMSO.35 This conclusion is compatible with a predominant binding to the less polar site I. In order to further assess the main binding site of RB we evaluate its displacement by S-naproxen and S-warfarin, Fig. 4. These drugs selectively bind to sites I and II of HSA with Kb = 1.2 × 10⁶ M−1 and 3.3 × 10⁵ M−1, respectively.41,42 The data shown in Fig. 3 suggest a preferential association of RB to site I, with Kb≈ 1 × 10⁶ M−1. In addition, the quenching of intrinsic Trp fluorescence by RB was almost linear and the KSV obtained was similar to the Kb estimated from microfiltration experiments.35 This agreement and the linearity of the plot is compatible with a predominant binding of this dye to site I, region where the Trp residue is located.51
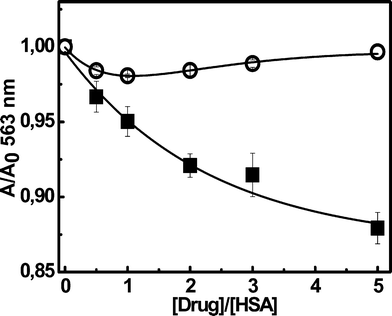 | ||
| Fig. 4 Changes of 10 μM RB absorbance at 563 nm in presence of 10 μM HSA resulting from S-naproxen (■) or S-warfarin (○) addition. All the measurements were performed in PBS buffer 100 mM, pH 7.4 at 25.0 ± 0.5 °C. Bars correspond to the standard error of three independent determinations. | ||
All the above results would indicate that RB predominantly binds to site I; this is fully consistent with the affinity of this site for large molecules bearing delocalized negative charges.33 However, displacements of bound DS and DNSA by RB were interpreted in terms of similar binding affinities of the dye for type I and II sites.35 A plausible explanation of the previous data could be a not specific displacement of DS bound to site II, promoted by conformational change in HSA elicited by bonding of the dye to site I.
Predominant binding sites for MB and RB were also assessed by docking simulations.45 The results obtained are shown in Fig. 5. In agreement with the above considerations, the docking shows that RB is located in Sudlow's site I (sub-domain IIA) cavity, very close to Trp 214, while MB is associated to site II (sub-domain IIIA). The rather large distance to the Trp 214 residue is compatible with the smaller efficiency of the intrinsic fluorescence quenching by this dye. A similar behaviour was described recently by Yue et al.,52 studying the binding of magniferin to HSA, and Zhang et al., describing the specific binding of gallic acid to site I of HSA.53
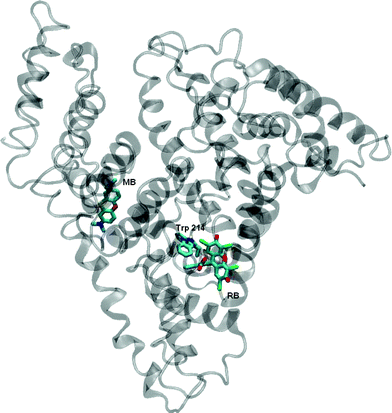 | ||
| Fig. 5 Localization of RB and MB obtained by docking modelling. The position of the Trp 214 moiety is also indicated. | ||
In conclusion, the binding of both dyes to HSA shows different characteristics. In particular, the anionic RB binds strongly to HSA (Kb = 1 × 10⁶ M−1), preferentially to site I. On the other hand, binding of the cationic MB is weaker (Kb = 1.5 × 10⁵ M−1) and takes place predominantly at the site II of HSA. This binding difference could lead to different photobehaviours of the bound dyes. With the aim of obtaining information about the effect of site association on the photophysical behaviour of the photosensitizers we measured their triplet lifetimes in the absence and in the presence of different protein concentrations.
Excited state properties of MB and RB bound to HSA
Fig. 6 shows the effect of HSA addition on the decay profile of MB and RB triplet states in N2 saturated solutions. In the case of MB, HSA addition leads to the diminution of the initial absorbance change (ΔA0) measured at 420 nm associated with absorption by 3MB*.21 Furthermore, the increment of HSA concentration produces a shortening of the apparent triplet lifetime, obtained by exponential fitting of the triplet absorption decay, from 23 μs in buffer solution to 11 μs in the presence of 40 μM HSA (ca. 86% of bound dye). Similar results have been described previously by Cardoso et al., using riboflavin and bovine whey protein.54 In particular, the shorter triplet lifetime could indicate a significant non-static intra-protein triplet deactivation. The decrease of the triplet initial absorbance elicited by the protein addition is probably due to static quenching and/or a decrease in the triplet molar absorption coefficient at the measuring wavelength.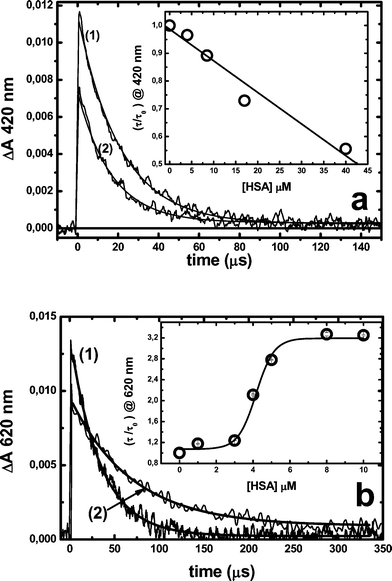 | ||
| Fig. 6 Effect of the HSA addition on RB and MB triplet lifetimes. Triplet concentrations were evaluated by their absorption at 420 nm or 620 nm for MB 28 μM or RB 10 μM, respectively. (a) MB triplet absorption decay in the (1) absence or (2) presence of 18 μM HSA; (b) RB triplet absorption decay in the (1) absence or (2) presence of 10 μM HSA. The inset in both figures shows triplet lifetimes as a function of protein concentrations. All measurements were performed in N2-saturated solutions. | ||
On the other hand, an increase of the lifetime of 3RB* takes place when the dye is bound to the protein, Fig. 6b.35 In this system the triplet lifetime increases from 40 μs in buffer to 130 μs under conditions in which it can be considered that all the dye is bound to the protein and multi-occupation is minimal. Interestingly, at lower protein concentrations (<3 μM), even when most dye molecules are bound to HSA, the apparent triplet lifetime only increases to ca. 50 μs. Similar behaviour was observed for the singlet state lifetime of RB, i.e.1RB*, which increases from 120 ps to 450 ps for RB in buffer or bound to the protein, respectively, Fig. 7. It is interesting that also shorter singlet lifetimes are obtained at lower protein concentrations, in spite of a predominant association to HSA (see Fig. 5). Both sets of results can be explained in terms of self-quenching and/or the presence of binding sites of different affinity and micropolarity. In particular, the data can be explained if at low (n < 1) occupancy the probes are almost exclusively bound to sites of high affinity and relatively low micropolarity (site I).
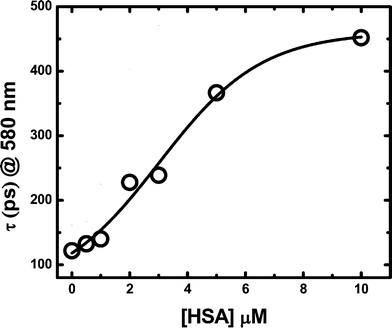 | ||
| Fig. 7 Effect of HSA addition upon the excited singlet RB lifetime. Fluorescence intensity was measured at 580 nm after laser flash lamp excitation at 532 nm. All measurements were performed in PBS buffer 100 mM pH 7.4 with 10 μM RB. | ||
On the other hand, addition of HSA (up to 50 μM) to a MB solution (28 μM) renders only a small (<10%) diminution in fluorescence yield, without noticeable changes in the shape and position of the band (data not shown). These results agree with the report of Bartlett and Indig19 who, employing BSA, a protein with 74% of homology in the amino acid chain to HSA,55 found only modest changes in the fluorescence emission at high protein![[thin space (1/6-em)]](https://www.rsc.org/images/entities/char_2009.gif) :
:![[thin space (1/6-em)]](https://www.rsc.org/images/entities/char_2009.gif) MB ratios.
MB ratios.
Effect of oxygen on the triplet lifetime of MB and RB incorporated in HSA
Both RB and MB triplets are efficiently quenched by molecular oxygen O2 in aqueous solution with rate constants of 1.5 × 10⁹ M−1 s−1 and 1.0 × 10⁹ M−1 s−1 for RB and MB, respectively. These values are close to the diffusion controlled limit.56 Different behaviours were observed when MB and RB are incorporated to HSA. In fact, O2 readily quenches 3MB* even in the presence HSA (30 μM) concentrations at which most of the dye (82%) is bound to the protein. The estimated rate constant is close to that measured in buffer solution, and therefore it could be assumed that MB binds to a HSA region with relatively free accessibility of both O2 and solvent molecules. In the case of RB, the quenching rate constant of 3RB* by O2 was determined as kq3 = 1 × 10⁸ M−1 s−1 by measuring the decay of the phosphorescence emission at 960 nm, under conditions that most of the dye is bound to the protein and n < 1, Fig. 8. This value was nearly 15 times smaller than that measured in buffer solution, indicating that HSA reduces the O2 accessibility to the region where RB is incorporated. Similar behaviour has been described for other compounds incorporated to globular proteins.35,45,46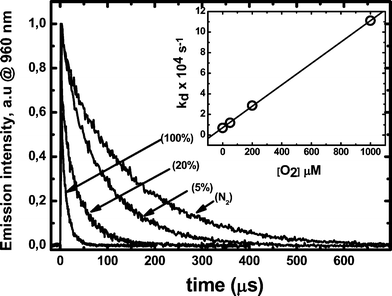 | ||
| Fig. 8 Triplet RB phosphorescence time profile measured at 960 nm of 10 μM of dye in presence of 10 μM HSA at different oxygen concentrations. The inset shows the change of 1/τ as a function of oxygen concentration. All measurements were performed in deuterated PBS 100 mM buffer pD 7.4. | ||
Singlet oxygen generation and decay in the presence of HSA
Fig. 9 shows singlet oxygen (1O2) phosphorescence profiles at 1270 nm obtained after laser excitation of MB or RB in deuterated buffer solutions normalized by the respective dye absorbance value at the laser excitation wavelength. In these experiments, the absorbance at the excitation wavelengths was between 0.3 and 0.5 for RB and 0.7 ± 0.1 for MB. For both photosensitizers in buffer solution, the 1O2 lifetime was very close to that reported in the literature (ca. 68 μs).47 However, after addition of 10 μM of HSA, clear differences in both systems were observed.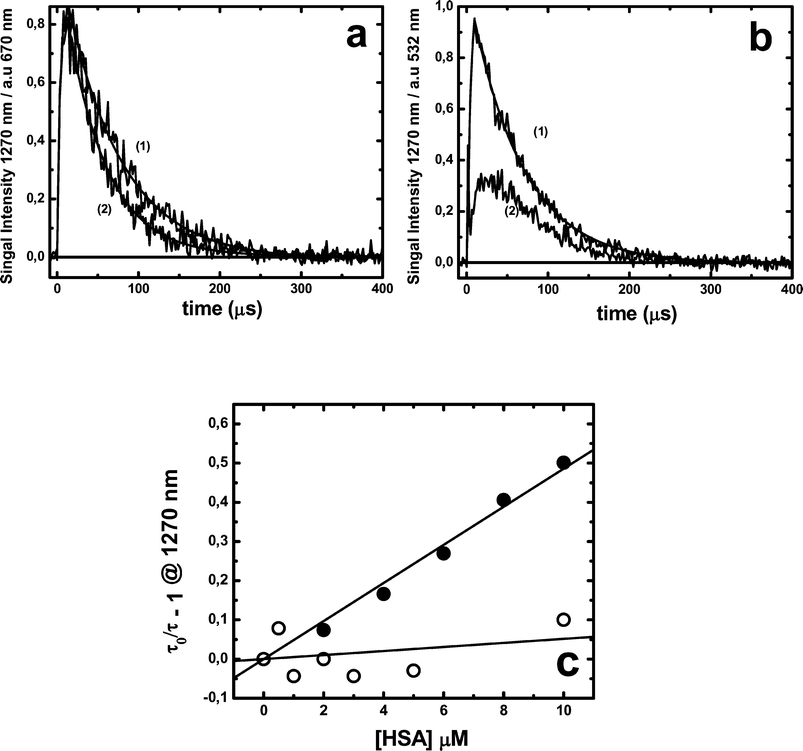 | ||
| Fig. 9 Photosensitized emission of singlet oxygen measured at 1270 nm after laser excitation (3 mJ) at 532 nm for 10 μM RB or (4 mJ) at 670 nm for 10 μM MB. (a) MB alone (1) or with 10 μM HSA (2); (b) RB alone (1) or with 10 μM HSA (2); (c) Stern–Volmer plot of the singlet oxygen lifetime plotted as a function of protein concentration for MB (●) or RB (○). All measurements were performed in air-equilibrated deuterated PBS 100 mM buffer pD 7.4. | ||
Results obtained with MB show that the presence of HSA does not modify either the initial 1O2 phosphorescence intensity or its rise time, but reduces its decay time, implying a dynamic quenching behaviour (Fig. 9a and 9c). Furthermore, similar quenching efficiency of 1O2 by sodium azide was observed in the absence and presence of 10 μM HSA, Fig. 10a. These results indicate that 1O2 is generated in a protein environment that allows either the quencher accessibility or the free diffusion of 1O2 to the bulk solvent during its decay time.
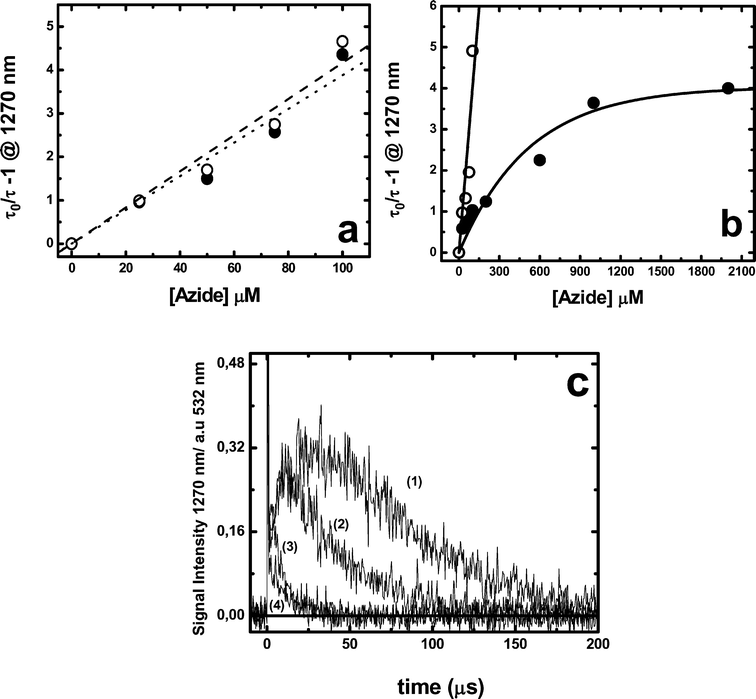 | ||
| Fig. 10 Stern–Volmer plots of singlet oxygen lifetimes plotted as a function of sodium azide concentration. Singlet oxygen concentration was estimated by its phosphorescence measured at 1270 nm for: (a) 10 μM MB without (○) or with 10 μM HSA (●); (b) 10 μM RB without (○) or with 10 μM HSA (●); (c) singlet oxygen emission profiles produced by 10 μM RB in presence of 10 μM HSA without (1) or with 25 μM (2), 100 μM (3) or 2000 μM (4) azide. All measurements were performed in deuterated PBS 100 mM buffer pD 7.4 air-equilibrated solutions. | ||
Results obtained employing RB as photosensitizer show noticeable differences in the presence of HSA: (i) an increment of the rise time of 1O2 phosphorescence accompanied by a decrease in the initial intensity (see Fig. 9b); (ii) the 1O2 lifetime was nearly independent on the HSA concentration and similar to that obtained in deuterated buffer solutions; and (iii) the 1O2 quenching by sodium azide renders a SV plot with a strong downward curvature, Fig. 10b.
These results can be explained in terms of the differences in the binding extent of both dyes to the protein. In fact, the respective Kb values allowed calculation that at 10 μM HSA ca. 66% of MB is associated to the protein while 94% of RB is bound to HSA. However, this difference in the free and bound dyes does not explain either the protein or sodium azide concentration effects, Fig. 9 or 10, respectively. These results could be rationalized if, when RB is bound to HSA, the 1O2 formation and decay are dominated by a slower intra-protein diffusion of both ground and singlet oxygen, due to the RB binding to the relatively buried site I.
In order to quantitatively evaluate parameters associated to the molecular oxygen intra-protein diffusion, kinetic profiles of 1O2 growths and decays were fitted to those expected for consecutive pseudo-first order processes:
 | (3) |
 | (4) |
Fitting of 1O2 profiles to eqn (4) renders a value of kr at a given oxygen concentration. These fittings were performed employing Kaleida-Graph® software. The value of kQ (0.7 × 10⁸ M−1 s−1) was obtained from the slope of a krvs. oxygen concentration plot (inset Fig. 11). The value obtained is close to that derived from the quenching of RB triplets bound to HSA from phosphorescence decays (Fig. 8). Furthermore, the estimated value of kd (1.47 × 10⁴ s−1) renders an intra-protein 1O2 lifetime of ca. 67 μs.
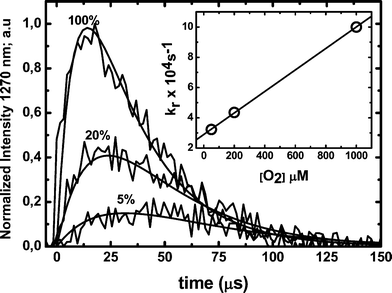 | ||
| Fig. 11 Singlet oxygen emission profiles obtained after laser pulses (3 mJ) at 532 nm of 10 μM RB in presence of 10 μM HSA at different oxygen concentrations. The solid lines represent the signal fitting with eqn (4). The inset shows the rise in kr as a function of dissolved oxygen concentration. All measurements were performed in air equilibrated solutions in deuterated PBS 100 mM buffer, pD 7.4. | ||
The intra-protein lifetime estimated in the previous section includes the intra-protein decay and the diffusion of a fraction of the produced singlet oxygen to the protein periphery and/or the external solvent where it can be quenched by azide. This inhomogeneity in the singlet oxygen population explains the curvature of the data given in Fig. 10a that implies a singlet oxygen lifetime of ca. 15 μs in the presence of high azide concentrations. This interpretation is in agreement with time-resolved measurements obtained in the presence of azide (Fig. 10c). The data obtained for the bound dyes under conditions of low occupancy (n < 1) are summarized in Table 1.
Conclusions
At low occupation numbers, RB binds strongly to HSA site I, while MB localizes predominantly in the protein binding site II. This different localization explains the observed differences in the dyes’ photochemical behaviour. In particular, the environment provided by site I is less polar and considerably more protected from oxygen. The localization of RB in site I leads to an efficient quenching of the intrinsic protein fluorescence (ascribed to the nearby Trp residue) and the generation of intra-protein singlet oxygen, whose behaviour is different from that observed in the external solvent or when it is generated by bound MB.Acknowledgements
This work was supported by FONDECYT-Chile (1070285 and AT-24080017 grant). E. A. gratefully acknowledges CONICYT-Chile for a doctoral fellowship. C. D. B. thanks the Argentinean funding agencies CONICET and ANPCyT. A. M. E. thanks VRAID-PUC Puente Grant 03/2008. J. C. S. thanks the Natural Sciences and Engineering Research Council of Canada (NSERC), CFI and the Government of Ontario.References
- J. R. Kanofsky, Singlet oxygen production by lactoperoxidase, J. Biol. Chem., 1983, 258(10), 5991–5993 CAS.
- J. R. Kanofsky, J. Wright, G. E. Miles-Richardson and A. I. Tauber, Biochemical requirements for singlet oxygen production by purified human myeloperoxidase, J. Clin. Invest., 1984, 74(4), 1489–1495 CrossRef CAS.
- J. R. Kanofsky, Singlet oxygen production by chloroperoxidase-hydrogen peroxide-halide systems, J. Biol. Chem., 1984, 259(9), 5596–5600 CAS.
- M. J. Steinbeck, A. U. Khan and M. J. Kanjorski, Extra cellular production of singlet oxygen by stimulated macrophages quantified using 9,10-diphenylanthracene and beryline in a polystyrene film, J. Biol. Chem., 1993, 268, 15649–15654 CAS.
- J. R. Kanofsky, H. Hoogland, R. Wever and S. J. Weiss, Singlet oxygen production by human eosinophils, J. Biol. Chem., 1988, 263(20), 9692–9696 CAS.
- M. J. Davies, The oxidative environment and protein damage, Biochim. Biophys. Acta, Proteins Proteomics, 2005, 1703(2), 93–109 CrossRef CAS.
- M. J. Davies, Singlet oxygen-mediated damage to proteins and its consequences, Biochem. Biophys. Res. Commun., 2003, 305(3), 761–770 CrossRef CAS.
- A. Wright, W. A. Bubb, C. L. Hawkins and M. J. Davies, Singlet oxygen-mediated protein oxidation: evidence for the formation of reactive side chain peroxides on tyrosine residues, Photochem. Photobiol., 2002, 76(1), 35–46 CrossRef CAS.
- P. E. Morgan, R. T. Dean and M. J. Davies, Inhibition of glyceraldehyde-3-phosphate dehydrogenase by peptide and protein peroxides generated by singlet oxygen attack, Eur. J. Biochem., 2002, 269(7), 1916–1925 CrossRef CAS.
- M. Gracanin and M. J. Davies, Inhibition of protein tyrosine phosphatases by amino acid, peptide, and protein hydroperoxides: potential modulation of cell signaling by protein oxidation products, Free Radical Biol. Med., 2007, 42(10), 1543–1551 CrossRef CAS.
- P. E. Morgan, R. T. Dean and M. J. Davies, Protective mechanisms against peptide and protein peroxides generated by singlet oxygen, Free Radical Biol. Med., 2004, 36(4), 484–496 CrossRef CAS.
- A. Wright, C. L. Hawkins and M. J. Davies, Photo-oxidation of cells generates long-lived intracellular protein peroxides, Free Radical Biol. Med., 2003, 34(6), 637–647 CrossRef CAS.
- H. Y. Shrivastava and U. N. Balachandran, Protein degradation by peroxide catalyzed by chromium (III): Role of coordinated ligand, Biochem. Biophys. Res. Commun., 2000, 270(3), 749–754 CrossRef CAS.
- E. R. Stadtman and B. S. Berlett, Reactive oxygen-mediated protein oxidation in aging and disease, Chem. Res. Toxicol., 1997, 10(5), 485–494 CrossRef CAS.
- K. Kim, S. G. Rhee and E. R. Stadtman, Nonenzymatic cleavage of proteins by reactive oxygen species generated by dithiothreitol and iron, J. Biol. Chem., 1985, 260(29), 15394–15397 CAS.
- I. E. Kochevar and R. W. Redmond, Photosensitized production of singlet oxygen, Methods Enzymol., 2000, 319, 20–28 CAS.
- D. Severino, H. C. Junqueira, M. Gugliotti, D. S. Gabrielli and M. S. Baptista, Influence of negatively charged interfaces on the ground and excited state properties of Methylene Blue, Photochem. Photobiol., 2003, 77(5), 459–468 CrossRef CAS.
- D. Gabrielli, E. Belisle, D. Severino, A. J. Kowaltowski and M. S. Baptista, Binding, aggregation and photochemical properties of methylene blue in mitochondrial suspensions, Photochem. Photobiol., 2004, 79(3), 227–232 CrossRef CAS.
- J. A. Bartlett and G. L. Indig, Effect of Self-association and Protein Binding on the Photochemical Reactivity of Triarylmethanes. Implications of Noncovalent Interactions on the Competition between Photosensitization Mechanisms Type I and Type II, Photochem. Photobiol., 1999, 70(4), 490–498 CrossRef CAS.
- D. C. Neckers, Rose Bengal (Review), J. Photochem. Photobiol., A, 1989, 47(1), 1–29 CrossRef CAS.
- J. P. Tardivo, A. D. Giglio, C. S. d. Oliveira, D. S. Gabrielli, H. C. Junqueira, D. B. Tada, D. Severino, R. d. F. t. Turchiello and M. S. Baptista, Methylene blue in photodynamic therapy: From basic mechanisms to clinical applications, Photodiagn. Photodyn. Ther., 2005, 2(3), 175–191 CrossRef CAS.
- B. Zhao, J. Xie and J. Zhao, Binding of hypocrellin B to human serum albumin and photo-induced interactions, Biochim. Biophys. Acta, Gen. Subj., 2005, 1722(2), 124–130 Search PubMed.
- M. Korínek, R. Dedic, A. Molnár and J. Hála, The influence of human serum albumin on the photogeneration of singlet oxygen by meso-tetra(4-sulfonatophenyl)porphyrin. An infrared phosphorescence study, J. Fluoresc., 2006, 16(3), 355–359 CrossRef CAS.
- P. Vorobey, A. E. Steindal, M. K. Off, A. Vorobey and J. Moan, Influence of Human Serum Albumin on Photodegradation of Folic Acid in Solution, Photochem. Photobiol., 2006, 82(3), 817–822 CrossRef CAS.
- N. Shishido, K. Nakayama and M. Nakamura, Porphyrin-induced photooxidation of conjugated bilirubin, Free Radical Res., 2003, 37(10), 1061–1067 CrossRef CAS.
- U. Kragh-Hansen, Structure and ligand binding properties of human serum albumin (Review), Dan. Med. Bull., 1990, 37(1), 57–84 Search PubMed.
- U. Kragh-Hansen, Quantitative analyses of the interaction between calcium ions and human serum albumin, Clin. Chem., 1993, 39(2), 202–208 CAS.
- B. Honore, Conformational changes in human serum albumin induced by ligand binding, Phamacol. Toxicol., 1990, 66(2), 7–26 Search PubMed.
- X. M. He and D. C. Carter, Atomic structure and chemistry of human serum albumin, Nature, 1992, 358(6383), 209–215 CrossRef.
- G. Sudlow, D. J. Birkett and D. N. Wade, The characterization of two specific drug binding sites on human serum albumin, Mol. Pharmacol., 1975, 11(6), 824–832 CAS.
- G. Sudlow, D. J. Birkett and D. N. Wade, Further characterization of specific drug binding sites on human serum albumin, Mol. Pharmacol., 1976, 12(6), 1052–1061 CAS.
- M. Dockal, M. Chang, D. C. Carter and F. Ruker, Five recombinant fragments of human serum albumin-Tools for the characterization of the warfarin binding site, Protein Sci., 2000, 9(8), 1455–1465 CrossRef CAS.
- T. Peters, All about albumin proteins, Academic press, New York, 1st edn, 1996 Search PubMed.
- E. Alarcón, A. M. Edwards, A. M. Garcia, M. Muñoz, A. Aspée, C. D. Borsarelli and E. A. Lissi, Photophysics and photochemistry of Zinc Phthalocyanine/Bovine serum albumin adducts, Photochem. Photobiol. Sci., 2009, 8(2), 255–263 RSC.
- E. Alarcón, A. M. Edwards, A. Aspée, C. D. Borsarelli and E. A. Lissi, Photophysics and photochemistry of rose bengal bound to human serum albumin, Photochem. Photobiol. Sci., 2009, 8(7), 933–943 RSC.
- Y.-J. Hu, W. Lia, Y. Liua, J.-X. Donga and S.-S. Qua, Fluorometric investigation of the interaction between methylene blue and human serum albumin, J. Pharm. Biomed. Anal., 2005, 39(3–4), 740–745 CrossRef CAS.
- J. Nibbs, S. A. Vinogradov, J. M. Vanderkooi and B. Zelent, Flexibility in proteins: tuning the sensitivity to O2 diffusion by varying the lifetime of a phosphorescent sensor in horseradish peroxidase, Photochem. Photobiol., 2004, 80(1), 36–40 CrossRef CAS.
- M. Khajehpour, I. Rietveld, S. Vinogradov, N. V. Prabhu, K. A. Sharp and J. M. Vanderkooi, Accessibility of oxygen with respect to the heme pocket in horseradish peroxidase, Proteins: Struct., Funct., Genet., 2003, 53(3), 656–666 CrossRef CAS.
- S. Papp, T. E. King and J. M. Vanderkooi, Intrinsic tryptophan phosphorescence as a marker of conformation and oxygen diffusion in purified cytochrome oxidase, FEBS Lett., 1991, 283(1), 113–116 CrossRef CAS.
- M. Kubista, R. Sojback, S. Ericksson and B. Albinsson, Experimental correction for the inner-filter effect in fluorescence spectra, Analyst, 1994, 119(3), 417–419 RSC.
- B. Honore and R. Brodersen, Albumin binding of anti-inflammatory drugs. Utility of a site oriented versus a stoichiometric analysis, Mol. Pharmacol., 1984, 25(1), 137–150 CAS.
- T. C. Pinkerton and K. A. Koeplinger, Determination of warfarin-human serum albumin protein binding parameters by an improved Hummel-Dreyer high-performance liquid chromatographic method using internal surface reversed-phase columns, Anal. Chem., 1990, 62(19), 2114–2122 CrossRef CAS.
- R. Dennington II, T. Keith, J. Millam, K. Eppinnett, W. Lee Hovell and R. Gilliland, GaussView 3.09, Semichem, Inc: Shawnee Mission, Kansas, 2003 Search PubMed.
- A. Pigache, P. Cieplak and F. Y. Dupradeau, in Automatic and highly reproducible RESP and ESP charge derivation: Application to the development of programs RED and X RED, 227th ACS National Meeting, California, 2004, California, 2004 Search PubMed.
- G. M. Morris, D. S. Goodsell, R. S. Halliday, R. Huey, W. E. Hart, R. K. Belew and A. J. Olson, Automated docking using a Lamarckian genetic algorithm and an empirical binding free energy function, J. Comput. Chem., 1998, 19(14), 1639–1662 CrossRef CAS.
- V. Peyre, V. Lair, V. André, G. le Maire, U. Kragh-Hansen, M. le Maire and J. V. Møller, Detergent binding as a sensor of hydrophobicity and polar interactions in the binding cavities of proteins, Langmuir, 2005, 21(19), 8865–8875 CrossRef CAS.
- I. Petitpas, C. E. Petersen, C. E. Ha, A. A. Bhattacharya, P. A. Zunszain, J. Ghuman, N. V. Bhagavan and S. Curry, Structural basis of albumin-thyroxine interactions and familial dysalbuminemic hyperthyroxinemia, Proc. Natl. Acad. Sci. U. S. A., 2003, 100(11), 6440–6445 CrossRef CAS.
- F. C. Raymond, G. V. Gerald and N. Alexander, Fluorescence Decay Times: Proteins, Coenzymes, and Other Compounds in Water, Science, 1967, 156(3777), 949–951 CrossRef CAS.
- R. Artali, G. Bombieri, L. Calabi and A. Del Pra, A molecular dynamics study of human serum albumin binding sites, Farmaco, 2005, 60, 6–7.
- C. Reichardt, Solvents and solvent effects in organic chemistry, VCH, New York, 2nd edn, 1990 Search PubMed.
- S. Sugio, A. Kashima, S. Mochizuki, M. Noda and K. Kobayashi, Crystal structure of human serum albumin at 2.5 Å resolution, Protein Eng., Des. Sel., 1999, 12(6), 439–446 CrossRef CAS.
- Y. Yue, X. Chen, J. Qin and X. Yao, Characterization of the mangiferin–human serum albumin complex by spectroscopic and molecular modeling approaches, J. Pharm. Biomed. Anal., 2009, 49(3), 753–759 CrossRef CAS.
- Y. Zhang, L. Dong, J. Li and X. Chen, Studies on the interaction of gallic acid with human serum albumin in membrane mimetic environments, Talanta, 2008, 76(2), 246–253 CrossRef CAS.
- D. R. Cardoso, D. W. Franco, K. Olsen, M. L. Andersen and L. F. Skibsted, Reactivity of Bovine Whey Proteins, Peptides, and Amino Acids toward Triplet Riboflavin as Studied by Laser Flash Photolysis, J. Agric. Food Chem., 2004, 52(21), 6602–6606 CrossRef CAS.
- J. Steinhardt, J. Krijn and J. G. Leidy, Differences between Bovine and Human Serum albumins: Binding isotherms, optical rotatory dispersion, viscosity, hydrogen ion titration, and fluorescence fffects, Biochemistry, 1971, 10(22), 4005–4015 CrossRef CAS.
- S. L. Murov, I. Carmichael and G. L. Hug, Handbook of photochemistry, Mercel Decker Inc, New York, 2nd edn, 1993 Search PubMed.
- S. Nonell and S. E. Braslavsky, Time-Resolved Singlet Oxygen Detection, Methods Enzymol., 2000, 319, 37–49 CAS.
- J. Baier, T. Fuss, C. Pöllmann, C. Wiesmann, K. Pindl, R. Engl, D. Baumer, M. Maier, M. Landthaler and W. Bäumler, Theoretical and experimental analysis of the luminescence signal of singlet oxygen for different photosensitizers, J. Photochem. Photobiol., B, 2007, 87(3), 163–173 CrossRef CAS.
| This journal is © The Royal Society of Chemistry and Owner Societies 2010 |
