A novel bimodal lipidic contrast agent for cellular labelling and tumour MRI†
Nazila Kamalyab, Tammy Kalberb, Gavin Kennyb, Jimmy Bellb, Michael Jorgensen‡*a and Andrew Miller*a
aImperial College Genetic Therapies Centre, Department of Chemistry, Flowers Building, Armstrong Road, Imperial College London, London, UK SW7 2AZ. E-mail: a.miller@imperial.ac.uk; Fax: +44 (0)20 7594 5803; Tel: +44 (0)20 7594 5869
bMetabolic and Molecular Imaging Group, Imaging Sciences Department, MRC Clinical Sciences Centre, Imperial College London, Hammersmith Hospital, London, UK W12 0HS
First published on 5th November 2009
Abstract
We have synthesized a bimodal lipidic molecule bearing both fluorophore and contrast agent signatures on the same structure in order to create a robust bimodal liposome for both magnetic resonance imaging (MRI) and fluorescence microscopy utility. The dual-modality concept considered in the synthesis of this new paramagnetic and fluorescent lipid is valuable in that anatomical information (MRI) as well as very sensitive localization (ex vivo fluorescence microscopy) of signal, and therefore liposome biodistribution, is obtainable. Bimodal cationic and neutral PEGylated liposomes were formulated using this novel lipid probe and used to label cells in vitro and image human ovarian xenografts in vivo. Tumour signal enhancement was increased by over 6-fold post-administration of the neutral PEGylated liposomes, and was maintained at this level up to the 24 h end-point. Our results showed this lipid to be more effective and sensitive than the single signature paramagnetic lipid Gd·DOTA·DSA at cellular labelling and tumour MRI.
Introduction
Multimodal imaging agents have the potential to provide more than one signal from a biological sample and in this way enhance the visualization of biological processes. A number of multimodal probes with both paramagnetic and fluorescence signatures have been developed for cellular imaging and use in imaging of developmental biology, as MRI and optical techniques are excellent complementary imaging methods.1–4 Cellular imaging is an important area, which has facilitated the study of cell behaviour in living animals; for example, the fate of stem cells has been tracked and monitored in a serial manner over time.5 The labelling of cells of interest is usually achieved through the use of molecular probes or nanoparticles such as liposomes, which are capable of effective cellular entry.6,7Fluorescently tagged lipid probes have been used extensively for the investigation of lipid trafficking and sorting in both model and real cellular membranes; in particular, fluorescent lipids have been used to highlight cellular processes such as membrane fusion.8 In principle, there are two regions on lipids where a fluorophore may be attached; this is achieved either through covalent attachment of the fluorescent moiety to the head group region or attachment to the lipid chain. The most frequently utilized fluorescent lipids are fluorescent analogues of dioleoylphosphatidylethanolamine (DOPE), which are DOPE-Rhodamine and 1-oleoyl-2-[6-[(7-nitro-2-1,3-benzoxadiazol-4-yl)amino]hexanoyl]-sn-glycero-3-phosphoethanolamine (DOPE-NBD).
To our knowledge, only one type of bimodal lipidic molecule has been developed thus far that incorporates both a paramagnetic contrast agent and a fluorophore onto a single molecular framework. Li et al. have designed and synthesized a bimodal probe, which has lipophilicity due to the attachment of a single alkyl chain, that can incorporate into lipidic membranes.9 This bimodal agent was used to label low-density lipoprotein (LDL) particles for the in vivo detection of LDL receptors.
Previously, we have synthesized a number of paramagnetic gadolinium-bearing lipids for liposomal cell labelling and visualization by MRI, with the additional incorporation of a separate fluorescent lipid in the liposome formulation to obtain bimodal liposomes.10,11 In order to create a more robust bimodal imaging liposome for cell labelling and tumour imaging and to avoid the use of two separate signalling lipids, our aim was to synthesize the bimodal Gd lipid 6-Rhodamine-sulfonamide-2-(amido-Gd(III) {1,4,7,10-tetraazacyclododec-1-yl}-acetic acid) hexa-amido-N,N-dioctadecylacetamide, Gd·DOTA·Rhoda·DSA 1, which also incorporates a fluorescent moiety (Scheme 1). This contrast agent is valuable for the bimodal imaging of tumours or labelled cells, since in addition to MRI, fluorescence microscopy provides further proof of particle location, with both signals co-localized and arising from the same signaling probe. Utilizing an orthogonally protected lysine linker, we have conjugated a rhodamine moiety onto a DOTA-bearing C-18 dialkyl lipid (Scheme 1) and complexed Gd into the molecule to obtain the bimodal lipid Gd·DOTA·Rhoda·DSA 1. This lipid was then used to label IGROV-1 human ovarian carcinoma cells and to image xenograft tumours in mice.
 | ||
Scheme 1 (i) Et3N, CH2Cl2, 40 °C, 5 h, 92%, (ii)TFA–CH2Cl2: 1![[thin space (1/6-em)]](https://www.rsc.org/images/entities/char_2009.gif) :1 v/v, rt, 2.5 h, quantitative, (iii) Et3N, CH2Cl2, 45 °C, 12 h, 67% (iv) H2, Pd-C 10%, 1,4-cyclohexadiene, MeOH–H2O: 2:1 v/v, 60 °C, 3 h, 60%, (v) 1% Et3N, CH2Cl2, rt, 12 h, 95%, (vi) 6H2O·GdCl3, H2O, 90 °C, 12 h, quantitative. :1 v/v, rt, 2.5 h, quantitative, (iii) Et3N, CH2Cl2, 45 °C, 12 h, 67% (iv) H2, Pd-C 10%, 1,4-cyclohexadiene, MeOH–H2O: 2:1 v/v, 60 °C, 3 h, 60%, (v) 1% Et3N, CH2Cl2, rt, 12 h, 95%, (vi) 6H2O·GdCl3, H2O, 90 °C, 12 h, quantitative. | ||
Results and discussion
The bimodal fluorescent and paramagnetic lipid Gd·DOTA·Rhoda·DSA 1 was synthesized by initial coupling of the lysine linker Nα-Boc-Nε-CBz-L-lysine-N-hydroxysuccinimide ester 3 with N′N-distearylamidomethylamine (DSA) 2 in order to obtain the orthogonally protected lipid 4 (Scheme 1). The synthesis of lipid 2 has been previously described.10 A facile acidic cleavage of the tert-butyloxycarbonyl (Boc) protecting group using TFA yielded amine 5 in good yield and purity. A further amide coupling was carried out with the mono-carboxylate activated 1,4,7,10-tetraazacyclododecane-1,4,7,10-tetraacetic acid mono-N-hydroxysuccinimide ester (DOTA·NHS) 6 to obtain the carboxybenzyl (CBz) protected compound 7. Deprotection of the CBz group was carried out with H2 gas and palladium on carbon, with a major improvement in hydrogenolysis achieved by the addition of 1,4 cyclohexadiene to the reaction mixture to obtain DOTA lipid 8. With this precursor lipid in hand, a sulfonamide coupling was achieved with Rhodamine Lissamine B sulfonyl chloride 9 in basic conditions to produce the novel bimodal lipid 10 with excellent yield and purity. Finally, DOTA·Rhoda·DSA 10 was complexed with GdCl3 using a stoichiometric amount of the chelating agent and heating the reaction in pure water (Scheme 1); quantitative yields were obtained and the final compound was characterized by ESI-MS and HPLC. The presence of free Gd3+ ions was investigated by using the xylenol orange colorimetric assay, and no free Gd ions were detected. In addition, the isotopic peaks of Gd were apparent in the mass spectrum of this compound, confirming metal chelation with the DOTA head group. The excitation and emission wavelengths measured for Gd·DOTA·Rhoda·DSA 1 were found to be 543 and 568 nm, respectively (MeOH).1. T1 relaxation analysis of Gd·DOTA·Rhoda·DSA
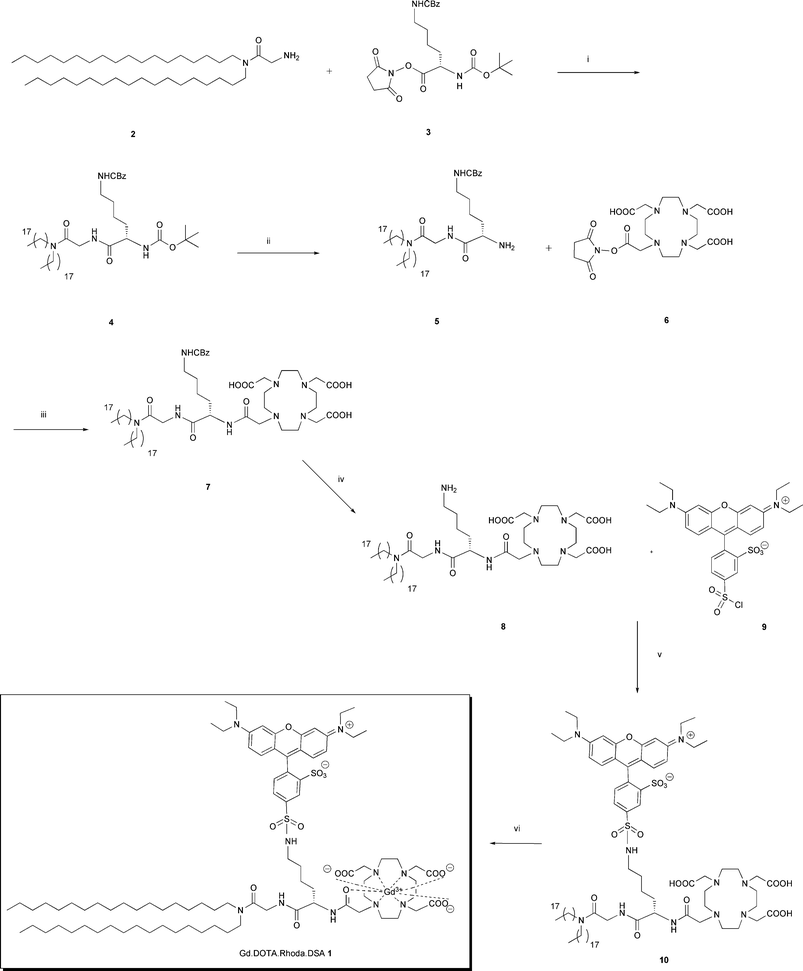
The T1 signal enhancement ability of lipid 1 in water was measured and compared with the clinical contrast agent Dotarem®. Aqueous solutions of Gd·DOTA·Rhoda·DSA were prepared at the clinically relevant dose of 0.5 mM, and T1 measurements were obtained using eqn (1):| Si = S0(1 − e(−x/T1)) | (1) |
 |
2. Cationic bimodal Gd·DOTA·Rhoda·DSA liposomes
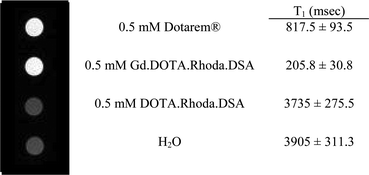
Liposomes were formulated with Gd·DOTA·Rhoda·DSA in addition to the cationic lipid N1-cholesteryloxycarbonyl-3,7-diaza-1,9-diaminonane (CDAN) and the neutral helper lipid DOPE. Liposomes were formulated in water and their size measured by photon correlation spectroscopy (PCS). Additionally, cryo-TEM was used to visualize the cationic liposomes (Fig. 1).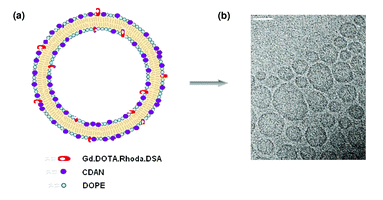 | ||
| Fig. 1 (a) Cationic liposomes of approximately 100 nm were formulated using Gd·DOTA·Rhoda·DSA, CDAN and DOPE. (b) Cryo-TEM image of liposomes (bar: 100 nm). | ||
3. Effect of lipid film hydration medium on T1 relaxation
As the novel bimodal lipid synthesized is a T1 reducing agent, we were interested in assessing the effect of the lipid film hydration medium on the relaxation efficiency of Gd·DOTA·Rhoda·DSA 1. An identical lipid mixture as above was used to prepare lipid films, which were then hydrated with either doubly distilled water, HEPES, PBS, non-supplemented media or supplemented media (containing serum and antibiotics); the T1 of water was also measured. These results demonstrated that the type of liquid used to hydrate the lipid film, and in which the liposomes subsequently assemble, does indeed affect T1 relaxation, with water being the most suitable hydration medium, where 74% bulk T1 reduction is achieved (Fig. 2). The other solutions reduced bulk solvent T1 to 64% for HEPES, 50% for supplemented media, 26% for non-supplemented media and 25% for PBS. Based on these results cationic liposomes were prepared in water for relaxivity measurements and cell labelling. | ||
| Fig. 2 Phantom samples were prepared with Gd·DOTA·Rhoda·DSA containing cationic liposomes hydrated in H2O, HEPES, supplemented media (with antibiotics and serum), non-supplemented media or PBS. A pure water sample (dark grey bar) was also included and T1 values measured at ambient temperatures at 4.7 T. | ||
4. MRI visualization of labelled IGROV-1 cells
Based on the successful cell uptake results demonstrated through the use of the cationic lipid CDAN and the neutral helper lipid DOPE,10 these lipids were also utilised in our cell labelling vector. A 5 mol% composition of Gd·DOTA·Rhoda·DSA 1 was used in the liposomes for cell labelling experiments since this ratio would ensure an adequate and non-excessive amount of rhodamine fluorescence in the cells (for bimodal fluorescence and MR imaging). IGROV-1 cells were labelled with the cationic liposomes and the labelled cells had acquired a pink coloration under normal light, and appeared as bright pellets with high signal intensity when imaged by MRI (Fig. 3). The T1 measurement for the labelled cells was measured to be 1122 ± 21.38 ms compared to 2825 ± 70.85 ms for the unlabelled cells. The cells labelled with Gd·DOTA·Rhoda·DSA appeared ∼61% more enhanced compared to control unlabelled cells. Inductively coupled plasma mass spectrometry (ICP-MS) studies were carried out using cell lysates post-8 h incubation with the cationic liposomes, to assess the amount of Gd internalized into the cells more precisely. From this, we determined that 22.84% of the administered Gd dose was retained within the IGROV-1 cells. We found that post-incubation, the cells contained a total mass of 132 ng of Gd, and assuming a doubling of the IGROV-1 cell population post-seeding, we estimate that each IGROV-1 cell contained 1.17 × 10⁷ atoms of Gd.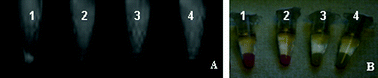 | ||
| Fig. 3 (A) T1-weighted MR images of IGROV-1 cells labelled with Gd·DOTA·Rhoda·DSA liposomes. 1. Cationic Gd·DOTA·Rhoda·DSA liposomes (1122 ± 21.38 ms); 2. cationic DOTA·Rhoda·DSA control liposomes (2254 ± 59.01 ms); 3. unlabeled cells (2825 ± 70.85 ms) and 4. cells plus PBS (2780 ± 42.8 ms). (B) Corresponding photo. | ||
Despite the fact that these cationic liposomes contain 25 mol% less Gd lipid, their MRI cellular labelling efficiency is comparable to the previously reported value of 68% cellular T1 enhancement for the single signature Gd·DOTA·DSA lipid (used at 30 mol%).10 This level of signal enhancement demonstrates the effectiveness of the novel bimodal lipid 1 for cell labelling and visualization by MRI.
5. Fluorescence microscopy of labelled IGROV-1 cells
In order to assess the intracellular uptake of the cationic bimodal liposomes, microscopy experiments were carried out using this formulation. Fluorescence microscopy of the fixed IGROV-1 cells revealed uptake of these liposomes to be intracellular, perinuclear, ubiquitous and dispersed throughout the cytoplasm (Fig. 4). The successful in vitro cell labelling of IGROV-1 cells and visualisation by both MRI and fluorescence microscopy revealed Gd·DOTA·Rhoda·DSA 1 to be an effective bimodal cell labelling vehicle and results were obtained that co-validated the presence of the liposomes within cells by both MRI and fluorescence microscopy.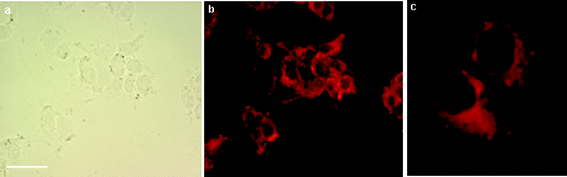 | ||
| Fig. 4 (a) Bright field image of IGROV-1 cells incubated with cationic liposomes containing Gd·DOTA·Rhoda·DSA (bar represents 20 μm), (b) corresponding fluorescent image of the labelled cells and (c) enlarged fluorescent imaging of two labelled IGROV-1 cells (×400). | ||
6. In vivo tumour MRI with Gd·DOTA·Rhoda·DSA
Tumour imaging is valuable in the assessment of a range of characteristics of solid tumours, whereby tumour characteristics such as viable versus necrotic regions, vascularity, level of aggressiveness, location and response to therapy can be both visualised and quantitated with the use of appropriate probes. A range of bimodal probes have been applied to the imaging of tumours.12,13 Based on the successful tumour imaging results using the first generation Gd·DOTA·DSA lipid,10 we were interested in evaluating the use of the novel second generation bimodal Gd·DOTA·Rhoda·DSA for tumour imaging of IGROV-1 xenografts in vivo. Neutral bimodal PEGylated liposomes were prepared using Gd·DOTA·Rhoda·DSA and characterized; r1 and r2 relaxivities were found to be 3.627 ± 0.183 and 12.935 ± 0.384 mM−1 s−1, respectively. Relaxivity can be defined as the capability of a contrast agent to enhance bulk solvent T1 or T2 relaxation rate per mM of Gd per second. r1 and r2 relaxivities for lipid 1 in neutral PEGylated liposomes were found to be higher than the single signature lipid Gd·DOTA·DSA by 2.8- and 2.5-fold, respectively (see Table 2). This increase in relaxivity may result due to the better proximity of the Gd·DOTA headgroup with the surrounding bulk water due to the attached rhodamine fluorophore, as it has been shown that charged aromatic probes tend to locate at the polar surface of membranes, and due to these charged groups the deep burial of these lipids within the hydrocarbon region of the bilayer is restricted.14An IGROV-1 human ovarian xenograft model was used to test the tumour imaging efficacy of the novel bimodal lipid Gd·DOTA·Rhoda·DSA. IGROV-1 cells lead to well vascularised tumours, which become palpable within a few weeks. Once tumours had grown large enough, baseline MR images of tumour-bearing mice were obtained pre-injection, after which the PEGylated bimodal liposomes were injected via the tail vein, and the mice imaged at 2, 14 and 24 h post-administration intervals. The measured T1 relaxation values from the tumour areas revealed an excellent level of tumour signal enhancement of up to ∼65% at 14 h post-injection of the bimodal liposomes, and this signal enhancement was maintained up to the 24 h end-point (Fig. 5a). T1-weighted images of axial tumour slices were also obtained and revealed the images taken at the 14 and 24 h time points to be brighter than the baseline and 2 h post-injection images (Fig. 5b). These results are even more encouraging than earlier findings, where only a 10% signal enhancement was reported at 16 h for the unimodal Gd·DOTA·DSA lipid, and similar T1-reducing effects were observed only initially at 24 h post-administration compared to the observed accelerated tumour accumulation of Gd·DOTA·Rhoda·DSA at 14 h.15
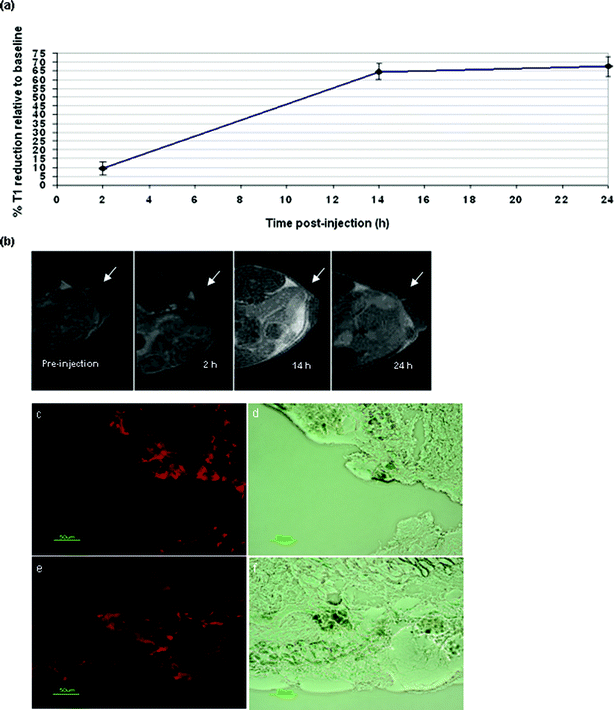 | ||
| Fig. 5 (a) Tumour T1 signal enhancement calculated as the percentage of T1 signal enhancement relative to the baseline (pre-injection) at 4.7 T. (b) T1-weighted tumour images of Balb/c mice injected with PEGylated bimodal Gd·.DOTA·Rhoda·DSA liposomes (white arrow shows tumour location) at baseline (pre-injection), 2, 14 and 24 h post-liposome administration. (c) and (d) Fluorescence microscopy images of sectioned tumour (7 μm thick) post-Gd·DOTA·Rhoda·DSA liposomes injection. The images on the left are red fluorescent images and the images on the right are corresponding bright field images (×400, green bar represents 50 μm). | ||
After 24 h post-administration, the mice were sacrificed, and the tumours excised, frozen and sectioned for histology. Fluorescence microscopy of the sectioned tumour slices revealed a high level of fluorescence signal in the tumour tissue (Fig. 5c,e). These results validate the MRI data and show the ubiquitous presence of the Gd·DOTA·Rhoda·DSA lipid in the tumour tissue. It is believed that these neutral PEGylated liposomes accumulate in tumour tissue due to the enhanced permeation and retention (EPR) effect. This describes tumour endothelium vasculature, which, due to its “leakiness”, allows the penetration of macromolecular particles through to tumour interstitium.16–18
Cellular labelling to date has mainly involved the use of iron oxide nanoparticles, as a strong negative signal enhancement arises due to the superparamagnetic nature of these particles.19–25 Gadolinium-based probes have also been applied to the labelling of various cell lines and their subsequent in vivo tracking achieved using MRI.26–30 Cellular imaging is a growing field, for which novel probes and labels are under continuous development. By incorporating Gd lipids into the membranes of liposomes or by encapsulating paramagnetic contrast agents in their aqueous core, they can be rendered MRI visible and supramolecular systems with a better control of size obtained.11,31,32 We have designed and synthesized Gd·DOTA·Rhoda·DSA 1, a novel bimodal paramagnetic and fluorescent lipid for liposome incorporation, in vitro cell labelling and in vivo tumour MRI. This lipid incorporated a fully saturated alkyl chain that bestows a good level of rigidity and anchorage into the liposome bilayer, and in addition to using the stable macrocyclic DOTA chelate, rhodamine was also conjugated and used as a headgroup, which is a fluorophore with an extremely high extinction coefficient (up to 93000 M−1 cm−1) and forms a stable sulfonamide linkage with the primary amine of 8. Relaxation properties of this lipid at reducing bulk water T1 were shown to be more effective than the clinical contrast agent Dotarem® when measured and compared at an equivalent Gd atomic content. Both cationic and neutral PEGylated liposomes were formulated using this lipid with ease, and cryo-TEM showed the liposomes to have a uniform size and shape distribution, despite initial concerns that the lipid head group may prove too large for successful liposome formulation.
The cationic formulation incorporating Gd·DOTA·Rhoda·DSA for in vitro cell labelling was based on the commercial liposomal transfection agent Trojene®, which is composed of a 1:1 mixture of CDAN and DOPE lipids, ensuring maximal cell uptake. The incorporation of CDAN into the formulations renders a positive surface charge to the liposome membrane as CDAN has a cationic polyamino head group.33 Cellular uptake of liposomes is mediated by adsorption of these nanoparticles onto the cell surface followed by endocytosis.34 Liposomes that contain the fusogenic lipid DOPE in particular, have been shown to be capable of fusion to both the cellular and endosomal membranes, with liposomal content released from the cationic liposomes in cells by the action of anionic lipids initially located in the cytoplasmic face of the endosome.33,35
For cell populations to be imaged by MRI, they must be distinguishable from the natural background noise signal. The markers that are to be used for their labelling should be able to produce significant enhancement of either T1 (positive, bright) or T2 (negative, dark) relaxation. Our in vitro MRI and fluorescence microscopy results demonstrate effective cellular labelling, with all cells brightly labelled with minimal toxicity (as confirmed by Trypan blue staining, data not shown). Additionally, in order to further assess the cell labelling efficiency of the developed cationic liposomes, we are currently investigating the effects of cell division and dilution of the labelled cells in vitro in a serial manner.
We developed neutral particles by including the hydrophilic polymer amphiphile DSPE-PEG(2000) into the liposomes incorporating Gd·DOTA·Rhoda·DSA, in addition to cholesterol and DOPC lipids. In vivo imaging of xenograft IGROV-1 tumours showed these liposomes to be trapped within the tumours and tumour T1 signals to be enhanced by up to 65% at 14 h post-injection, and persist up to the 24 h end point. We believe that the lipophilicity of the rhodamine moiety maybe causative of the higher signal enhancement at 14 h with the Gd·DOTA·Rhoda·DSA liposomes, suggesting incorporation in cell membranes.
In line with the EPR effect, the formulated neutral liposomes are believed to accumulate within the tumour tissues by extravasation through the disrupted endothelium lining tumour vessels over time. Their prolonged circulation is a direct result of the PEG layer, as liposomes bearing a surface decorated with the neutral hydrophilic PEG polymer benefit from prolonged circulation times, with half lives reported from 2–24 h in rodents, and as high as 45 h in humans.36 In addition, surface-grafted PEG liposomes have reduced uptake by liver cells as the liposomes are not effectively bound by plasma proteins.37 The utilization of neutral lipids, in addition to the incorporation of between 5–10% molar ratios of a PEGylated lipid in the liposome formulation, provides steric stabilization and protection from blood plasma proteins such as opsonins, and leads to a reduced Kupffer cell uptake. Cholesterol was incorporated into the formulation since this lipid has been shown to increase the head group spacing in liposome formulations and stabilize the resulting bilayer membranes.38 Here, cholesterol presence in the liposome formulation controls the membrane permeability of both fluid and rigid bilayers by inducing conformational ordering of the lipid chains. In addition, cholesterol can reduce serum-induced aggregation as a direct result of its neutral charge.39
The fluorescence pattern observed from the sectioned tumour tissue post-liposome administration appears to be more uniform and spread-out throughout the tumour tissue. This may support the idea that the Gd·DOTA·Rhoda·DSA lipid is able to incorporate within the cancer cell membranes. However, appropriate staining and confocal microscopy studies are necessary to elucidate more information on the precise localization of PEGylated bimodal liposomes formulated with the bimodal lipid Gd·DOTA·Rhoda·DSA 1. Post mortem analysis of mice injected with the PEGylated liposomes also revealed a pink gastrointestinal tract, suggesting hepatobiliary excretion of these nanoparticles. Future investigations will be carried out to determine the organ biodistribution and clearance of our novel in vivo bimodal liposomes. Bimodal liposomes formulated with Gd·DOTA·Rhoda·DSA will also be used to label various other cell types such as stem cells. Additionally, the developed cationic liposomes will be utilised for concurrent nucleic acid delivery and imaging to cells.
Conclusion
A novel bimodal fluorescent and paramagnetic lipid, Gd·DOTA·Rhoda·DSA was synthesized and utilized for the in vitro cell labelling of IGROV-1 human ovarian cells, and was shown to be an effective tumour T1 signal enhancer. These findings were co-validated successfully in a bimodal manner using both fluorescence microscopy of histological tissue and real-time MRI of tumour-bearing mice. Our results confirm the MRI advantages of the novel fluorescent and paramagnetic lipid Gd·DOTA·Rhoda·DSA in comparison to the single signature lipid Gd·DOTA·DSA, where in addition to indisputable co-localization of fluorophore signal and MRI contrast agent signature, a greater degree of relaxivity efficacy is also achieved. This combination allows for an accurate assessment of tumour signal enhancement using Gd contrast in real-time, in addition to facilitating in vivo fluorescence imaging or histological analysis of tumour tissue.Experimental methods and materials
Materials and general procedures
1,2-Dioleoyl-sn-glycero-3-phosphocholine (DOPC) and 1,2-distearoyl-sn-glycero-3-phosphoethanolamine-N-methoxy(polyethylene glycol)-2000 (DSPE-PEG2000) were purchased from Avanti Polar Lipids Inc. (Alabaster, AL, USA). The 1,4,7,10-tetraazacyclododecane-1,4,7,10-tetraacetic acid mono-N-hydroxysuccinimide ester (DOTA·NHS ester) was purchased from Macrocyclics (USA), and all other chemicals were of analytical grade or the best grade available and purchased from Sigma-Aldrich (UK).1H NMR spectra were recorded on a 400 MHz Bruker Advance 400 spectrometer. Chemical shifts are reported in parts per million (ppm) downfield from TMS, using residual chloroform (7.27 ppm) as an internal standard. Data are reported as follows: chemical shift, s = singlet, br = broad singlet, d = doublet, t = triplet, q = quartet, m = multiplet, coupling constants J are given in hertz (Hz). 13C NMR spectra were recorded on a 100 MHz Bruker Advance 400 spectrometer and chemical shifts are reported in parts per million (ppm) downfield from TMS, using the middle resonance of CDCl3 (77.0 ppm) as an internal standard. Infrared (IR) spectra were recorded on a JASCO FT/IR-620 infrared spectrophotometer; absorptions are recorded in wavenumbers (νmax in cm−1). Analytical HPLC was conducted on a Hitachi-LaChrom L-7150 pump system equipped with a Polymer Laboratories PL-ELS 1000 evaporative light scattering detector. HPLC gradient mixes assigned as follows: gradient mix A = H2O–0.1%TFA; mix B = MeCN–0.1%TFA; mix C = MeOH, all compounds obtained with purity of greater than 95%. Mass spectra were performed using VG-070B, Joel SX-102 or Bruker Esquire 3000 ESI instruments. Melting points were determined on a Stuart Scientific SMP3 apparatus and are reported without correction. Reactions with air sensitive material were carried out by standard syringe techniques. CH2Cl2 was distilled over P2O5. Thin layer chromatographic (TLC) analyses were performed on Merck 0.2 mm aluminium-backed silica gel 60 F254 plates and components were visualized by illumination with UV, an Ultrospec III (deuterium lamp at 300 nm) was used to visualize the UV absorbance. Flash column chromatography was performed using Merck 0.040 to 0.063 mm, 230 to 400 mesh silica gel. Microscopy experiments were conducted on a Nikon Eclipse E600 microscope. MRI experiments were conducted on a 4.7 T Magnex magnet (Oxford, UK) with a Varian Unity Inova console (Palo Alto, CA, USA). All procedures on animals were conducted in accordance with UK Home Office regulations and the Guidance for the Operation of Animals (Scientific Procedures) Act (1986).
Synthesis of Gd lipid
:1 CH2Cl2:MeOH (× 3, 50 mL). The combined organic layers were subsequently washed with 7% citric acid (× 3, 50 mL) and the aqueous layer extracted further with CH2Cl2 (× 3, 50 mL). The final combined organic layers were collected and dried over MgSO4, filtered and reduced in vacuo to yield a hygroscopic white solid (9.05 g, 92%). Rf [CH2Cl2:MeOH:H2O: 34.5:9:1 v/v] 0.56; νmax(nujol)/cm−1 3322.75, 1721.16, 1643.05, 1246.75, 1171.54; δH(400 MHz; CDCl3) 7.34 (5H, m, Jmeta 4.4 Hz, aromatic), 5.08 (2H, s, PhCH2-), 4.93 (1H, s, br, Boc-NHCH-), 4.03 (2H, d, -NCOCH2NHCO-), 3.31 (2H, m, -CH2NHCOOBn), 3.16 (4H, m, 2 × CH2CH2NCO-), 1.84 (2H, s, br, (BocNH)CHCH2-), 1.52 (6H, m, 2 × -CH2CH2NCO- and -CH2CH2NHCOOBn), 1.43 (9H, s, -OC(CH3)3), 1.32 (4H, 2 × (CH3CH2-)) 1.26 (60H, s, 30 × chain CH2's), 0.89 (6H, t, 2 × CH3CH2CH2-); δC(100 MHz; CDCl3) 171.89 (-NHCOCH(NHBoc)), 167.01 (-NCOCH2NH-), 156.54 (PhCH2OCO), 155.59 (-OCOt-Bu), 136.63 (-C1 aromatic), 128.47 (-C3, C5 aromatic), 128.10 (-C4 aromatic), 128.01 (-C2, C6 aromatic), 79.94 (-OC(CH3)3), 66.57 (PhCH2-), 54.31 (Boc-NHCH-), 46.26 (-CH2N-), 41.15 (-NCOCH2NHCO-), 40.55 (CBz-NHCH2-), 32.58 (-BocNHCHCH2-), 31.92 (-BocNHCHCH2CH2CH2-), 29.71-29.36 (12 chain CH2's), 28.72 (-CH2CH2N-), 28.33 (-OC(CH3)3), 27.61 (-CH2CH2CH2N-), 22.69 (CH3CH2-), 22.50 (BocNHCHCH2CH2-), 14.11 (CH3CH2-). HPLC tR = 36.28 min, column C-4 peptide, gradient mix: 0.0 min [100% A], 15–25.0 min [100% B], 25.1–45.0 min [100% C], 45.1–55.0 min [100% A]; flow: 1 mL min−1; m/z HRMS (FAB+) 941.8031 (MH+, 100%, C57H104N4O6 requires 940.7956).:1 TFA:CH2Cl2 (20 mL, v/v) solution. The reaction was stirred at room temperature for 2 h until TLC indicated completion. The solvents were removed in vacuo and the product freeze-dried from water to yield a white hygroscopic solid (257.09 mg, quantitative, mp = 47–50 °C). Rf [(CH2Cl2:MeOH:H2O: 34.5:9:1):CH2Cl2: 1:1 v/v] 0.39; νmax(nujol)/cm−1 3848.26, 1676.8, 1203.36, 722.21; δH(400 MHz; CDCl3) 7.99 (1H, s, br, -NH-) 7.33 (5H, m, Jortho 6.4 Hz, aromatic), 5.06 (2H, s, PhCH2-), 4.17 (2H, d, -NCOCH2-), 3.96 (1H, d, NH2CH-), 3.25 (2H, m, -CH2NHCOOBn), 3.15 (4H, m, 2 × CH2CH2NCO-)), 1.89 (2H, s, br, NH2CHCH2-), 1.47 (8H, m, 2 × (CH3CH2-) and -CH2CH2NCO-) 1.26 (60H, s, 30 × chain CH2's), 0.88 (6H, t, 2 × CH3CH2-); δC(100 MHz; CDCl3) 169.13 (-NHCOCH-NH2), 167.53 (-NCOCH2NH-), 157.48 (PhCH2OCO), 136.56 (-C1 aromatic), 128.68 (-C3, C5 aromatic), 128.29 (-C4 aromatic), 128.05 (-C2, C6 aromatic), 67.08 (PhCH2-), 53.56 (NH2CH-), 47.57 (2 × -CH2N-), 46.90 (-NCOCH2NHCO-), 41.30 (CBz-NHCH2-), 39.94 (-NCOCH2NHCO-), 32.08 (NH2CHCH2-), 30.76 (NH2CHCH2CH2CH2-), 29.87-29.52 (12 chain CH2's), 29.18 (-CH2CH2N-), 28.72 (-CH2CH2CH2N-), 22.84 (CH3CH2-), 21.40 (NH2CHCH2CH2-), 14.25 (CH3CH2-). HPLC tR = 27.98 min, column C-4 peptide, gradient mix: 0.0 min [100% A], 15–25.0 min [100% B], 25.1–45.0 min [100% C], 45.1–55.0 min [100% A]; flow: 1 mL min−1; m/z HRMS (FAB+) 841.7529 (MH+, 100%, C52H96N4O4 requires 840.7432.:MeOH:H2O: 34.5:9:1 v/v] 0.26; νmax(nujol)/cm−1 3741.23, 3681.44, 3621.66, 2360.44, 2333.45, 1953.54, 1835.9, 1743.33, 1691.27, 1646.91, 1513.85, 1481.06; δH(400 MHz; CDCl3) 7.32 (5H, m, Jmeta 4.0 Hz, aromatic), 5.07 (2H, m, PhCH2-), 4.77-2.37 (33H, m, -CH-, -NCOCH2NH-, 3 × HOOCCH2N-, -NHCOCH2N-, 2 × -CH2N-, CBzNHCH2-, 8 × -macrocycle CH2's), 2.02 (2H, m, br, -CHCH2-), 1.91-1.38 (10H, m, 2 × -CH2CH2N-, CBzNHCH2CH2- and 2 × CH3CH2-), 1.26 (60H, s, chain CH2's), 0.89 (6H, t, 2 × CH3); δC(100 MHz; MeOD: CDCl3 1:3) 178.61 (COOH), 175.08 (-HNCOCH-), 167.83 (-CHNHCOCH2N-), 162.03 (-CH2NCOCH2-) 157.27 (PhCH2OCO-), 136.48 (-C1 aromatic), 128.29 (-C3, C5 aromatic), 127.84 (-C4 aromatic), 127.71 (-C2, C6 aromatic), 66.39 (PhCH2), 58.67 (HOOCCH2N-), 52.94 (-NHCOCH2N-), 51.42 (-CH-), 50.97-50.08 (macrocyle CH2's), 49.10 (-NCOCH2NHCO-), 47.14 (-CH2N-), 46.36 (CBzNHCH2-), 40.94 (CBzNHCH2CH2-), 31.71 (-CHCH2), 29.49-26.67 (chain CH2's), 22.45 (CH3CH2-), 13.74 (CH3CH2-). HPLC; tR = 29.33 min, column C-4 peptide, gradient mix: 0.0 min [100% A], 15–25.0 min [100% B], 25.1–45.0 min [100% C], 45.1–55.00 min [100% A]; flow: 1 mL min−1; m/z (EI) 1227.80 (MH+, 100%, C68H122N8O11 requires 1226.9233).:1 MeOH:H2O solution (40 mL, v/v) followed by the addition of 1,4-cyclohexadiene (212.3 μL, 2.27 mmol). The reaction was stirred and 10% Pd-C (10 mg) was added, whilst ensuring the catalyst was fully dispersed in solution. The air was displaced with H2 gas and the reaction stirred at 60 °C under reflux and a stream of H2 gas for 12 h. The reaction was stopped and the solution filtered through Celite. The solvents were removed in vacuo and the product lyophilized from cyclohexane to yield a white fluffy powder (67.0 mg, 85%). Rf [CH2Cl2:MeOH:H2O: 34.5:9:1] 0.12; νmax(nujol)/cm−1 2360.44, 1698.98, 1650.28, 1558.20, 1540.85; δH (400 MHz; MeOD:CDCl3 3:1) 4.67 (1H, s, -CH-), 4.42 (-NCOCH2-), 4.04 (2H, d, (-HNCOCH2N-), 3.55 (4H, m, -CH2N-), 3.30-2.39 (16H, m, 8 × macrocycle CH2's), 2.33 (6H, m, HOOCCH2N-), 1.88-1.40 (8H, m, br, -CHCH2-, 2 × -CH2CH2N-, NH2CH2CH2-), 1.25 (60H, s, chain CH2's), 0.89 (6H, t, 2 × CH3); δC(100 MHz; MeOD:CDCl3 3:1) 175.90-175.34 (COOH), 172.95 (-CHNHCO-), 168.36 (-NCOCH2-), 59.01 (HOOCCH2N-), 52.34 (-NHCOCH2N-), 51.50 (-CH-), 50.01 (macrocyle CH2's), 49.10 (-NCOCH2NHCO-), 47.14 (-CH2N-),41.74 (NH2CH2-), 32.93 (-CHCH2), 30.65-30.34 (chain CH2's), 23.61 (CH3CH2-), 14.44 (CH3CH2-). HPLC tR = 36.20 min, column C-4 peptide, gradient mix: 0.0 min [100% A], 15–25.0 min [100% B], 25.1–45.0 min [100% C], 45.1–55.00 min [100% A]; flow: 1 mL min−1; m/z HRMS (EI) 1093.8951 (MH+, 100%, C60H116N8O9 requires 1092.8865).:MeOH:H2O: 34.5:9:1):CH2Cl2: 9:1 v/v). The solvents were removed in vacuo and the product was freeze-dried from cyclohexane to yield a fluffy purple solid (175.6 mg, 82%, decomposition = 255–260 °C). Rf [CH2Cl2:MeOH:H2O: 34.5:9:1 v/v] 0.31; νmax(nujol)/cm−1 3853.08, 3748.94, 3629.37, 2854.13, 2360.44, 2339.23, 1992.11, 1868.68, 1747.19, 1716.34, 1683.55, 1590.99, 1419.35, 1274.72, 1180.22, 1072.23, 1043.30, 719.32, 669.18; δH(400 MHz; MeOD:CDCl3:AcOD: 3:1:1) 8.71 (1H, s, SO2C![[double bond, length as m-dash]](https://www.rsc.org/images/entities/char_e001.gif) CH-), 8.11 (1H, d, SO2CCHCH-), 7.73 (1H, s, -NH-), 7.33 (1H, d, xanthenyl, aromatic), 7.17 (1H, d, xanthenyl), 6.97 (1H, d, xanthenyl, aromatic), 6.95 (1H, d, xanthenyl, aromatic), 6.89 (1H, s, br, xanthenyl), 6.87 (1H, s, br, xanthenyl), 4.56 (1H, s, -CH-), 4.18 (2H, d, (-HNCOCH2N-), 3.67 (16H, 2 × -NCH2CH3, 3 × HOOCCH2N-, -NHCOCH2N-, 2 × -CH2N-, SO2NHCH2-), 3.35-3.12 (16H, m, 8 × macrocycle CH2's), 2.92 (6H, m, HOOCCH2N-), 2.39–1.40 (4H, m, br, 2 × -CH2CH2N-), 1.59 (4H, 2 × -N+CH2CH3), 1.33 (78H, m, chain CH2's and -CHCH2CH2-, 2 × CH3CH2N-), 2 × CH3CH2N+, 2 × CH3CH2CH2-), 0.89 (6H, t, 2 × CH3); δC(100 MHz; MeOD:CDCl3:AcOD: 3:1:1) 174.74 (COOH), 155.68 (-COC-), 144.54 (-CN(CH2CH3)2), 132.62 (xanthenyl), 130.09 (aromatic), 127.31 (aromatic), 125.72 (aromatic), 113.56 (xanthenyl, aromatic), 113.56 (xanthenyl), 96.69 (-CHCOC-), 50.01 (macrocyle CH2's), 47.73 (-NCOCH2NHCO-), 46.64 (-CH2N-), 32.81 (NH2CH2-), 30.22 (-CHCH2), 30.55 (chain CH2's), 23.50 (CH3CH2-), 14.49 (CH3CH2-), 12.85 (-NCH2CH3) 9.19 (-N+CH2CH3). HPLC tR = 36.20 min, column C-4 peptide, gradient mix: 0.0 min [100% A], 15–25.0 min [100% B], 25.1–45.0 min [100% C], 45.1–55.00 min [100% A]; flow: 1 mL min−1; m/z HRMS (EI) 1634.2624 (MH+, 100%, C87H144N10O15S2 requires 1633.0254).:MeOH:H2O: 34.5:9:1 v/v] 0.20; νmax(nujol)/cm−1: 3748.94, 3673.73, 2854.13, 2339.23, 1920.75, 1868.68, 1772.26, 1683.55, 1 573.63, 1419.35, 1396.21, 1274.72, 1178.29, 1072.23; HPLC tR = 34.19 min, column C-4 peptide, gradient mix: 0.0 min [100% A], 15–25.0 min [100% B], 25.1–45.0 min [100% C], 45.1–55.00 min [100% A]; flow 1: mL min−1. λex; 545 nm and λem; 568 nm (MeOH). m/z MS (EI) 1809.50 (MNa+, 100%, C87H141GdN10O15S2 requires 1787.926).
CH-), 8.11 (1H, d, SO2CCHCH-), 7.73 (1H, s, -NH-), 7.33 (1H, d, xanthenyl, aromatic), 7.17 (1H, d, xanthenyl), 6.97 (1H, d, xanthenyl, aromatic), 6.95 (1H, d, xanthenyl, aromatic), 6.89 (1H, s, br, xanthenyl), 6.87 (1H, s, br, xanthenyl), 4.56 (1H, s, -CH-), 4.18 (2H, d, (-HNCOCH2N-), 3.67 (16H, 2 × -NCH2CH3, 3 × HOOCCH2N-, -NHCOCH2N-, 2 × -CH2N-, SO2NHCH2-), 3.35-3.12 (16H, m, 8 × macrocycle CH2's), 2.92 (6H, m, HOOCCH2N-), 2.39–1.40 (4H, m, br, 2 × -CH2CH2N-), 1.59 (4H, 2 × -N+CH2CH3), 1.33 (78H, m, chain CH2's and -CHCH2CH2-, 2 × CH3CH2N-), 2 × CH3CH2N+, 2 × CH3CH2CH2-), 0.89 (6H, t, 2 × CH3); δC(100 MHz; MeOD:CDCl3:AcOD: 3:1:1) 174.74 (COOH), 155.68 (-COC-), 144.54 (-CN(CH2CH3)2), 132.62 (xanthenyl), 130.09 (aromatic), 127.31 (aromatic), 125.72 (aromatic), 113.56 (xanthenyl, aromatic), 113.56 (xanthenyl), 96.69 (-CHCOC-), 50.01 (macrocyle CH2's), 47.73 (-NCOCH2NHCO-), 46.64 (-CH2N-), 32.81 (NH2CH2-), 30.22 (-CHCH2), 30.55 (chain CH2's), 23.50 (CH3CH2-), 14.49 (CH3CH2-), 12.85 (-NCH2CH3) 9.19 (-N+CH2CH3). HPLC tR = 36.20 min, column C-4 peptide, gradient mix: 0.0 min [100% A], 15–25.0 min [100% B], 25.1–45.0 min [100% C], 45.1–55.00 min [100% A]; flow: 1 mL min−1; m/z HRMS (EI) 1634.2624 (MH+, 100%, C87H144N10O15S2 requires 1633.0254).:MeOH:H2O: 34.5:9:1 v/v] 0.20; νmax(nujol)/cm−1: 3748.94, 3673.73, 2854.13, 2339.23, 1920.75, 1868.68, 1772.26, 1683.55, 1 573.63, 1419.35, 1396.21, 1274.72, 1178.29, 1072.23; HPLC tR = 34.19 min, column C-4 peptide, gradient mix: 0.0 min [100% A], 15–25.0 min [100% B], 25.1–45.0 min [100% C], 45.1–55.00 min [100% A]; flow 1: mL min−1. λex; 545 nm and λem; 568 nm (MeOH). m/z MS (EI) 1809.50 (MNa+, 100%, C87H141GdN10O15S2 requires 1787.926).Xylenol orange test
The presence of free gadolinium ions in solutions containing the Gd-incorporated compound was determined using Xylenol orange as described previously.10Liposome preparations
All lipids were stored as stock solutions in anhydrous organic solvents (CHCl3, MeOH or a mixture of both), at −20 °C under argon. Liposomes were made with a range of defined molar ratios of individual lipids to give a predetermined total lipid concentration of 1.2 mg mL−1 for in vitro and 15 mg mL−1 in for in vivo experiments. The in vitro cell labelling formulation consisted of: Gd·DOTA·Rhoda·DSA/CDAN/DOPE: 5/50/45 mol% (hydrated in water) and the in vivo tumour imaging formulation consisted of Gd·DOTA·Rhoda·DSA/DOPC/Cholesterol/DSPE-PEG2000: 30/33/30/7 mol% (hydrated in HEPES (20 mM, NaCl 135 mM, pH 6.5)). Appropriate volumes of each lipid stock were placed in a round-bottom flask (typically 5 mL) containing distilled CHCl3 (500 μL) and stirred to ensure thorough mixing of the lipids. The solvent was slowly removed in vacuo to ensure production of an even lipid film. The film was re-hydrated with buffer at a defined volume. The resulting solution was sonicated for 30 min (at 30 °C) in order to form liposomes of appropriate size. Liposomes were sized by photon light scattering using a Coulter Delta N4 PCS plus 440SX photon correlation spectrometer (PCS). In each experiment the liposome suspensions (20 μL) were diluted with PBS to a final volume of 200 μL. The mean average diameter and the polydispersity index of the vesicles were determined at 25 °C from the result of at least three reliable readings. The cationic in vitro liposomes were measured to be 222.27 ± 11.2 nm with a polydispersity index (PI) of 0.20. The PEGylated neutral in vivo liposomes were 89.24 ± 8.2 nm with a polydispersity index of 0.48.MRI analysis of Gd·DOTA·Rhoda·DSA 1
For T1 analysis, Gd·DOTA·Rhoda·DSA 1, DOTA·Rhoda·DSA 10 and Dotarem® were added to water to give a final concentration of 0.5 mM. The solutions (200 μL) were transferred to eppendorf tubes, placed in a quadrature 1H coil and T1 relaxation values measured on a 4.7 T Varian MR scanner at 19 °C ambient bore temperature. For relaxivity measurements, both the in vitro and in vivo liposome formulations were prepared and diluted in water in order to obtain five different gadolinium concentrations (in vitro liposomes: 0.340–0.042 [Gd] mM, in vivo liposomes: 1.577–0.197 [Gd] mM) in 200 μL of distilled water, and the molar relaxivities r1 and r2 (mM−1 s−1), which define the slope of the linear regression generated from a graph of 1/T1 or 1/T2vs. the atomic concentration of Gd, were determined. T1 values were obtained using saturation recovery experiments performed with a standard spin-echo sequence and a 2 mm single slice acquisition (TR = 50, 100, 200, 300, 500, 700, 1200, 3000, 5000, 7000 ms, TE = 11.19 ms), number of signal averages: 10, FOV: 100 × 50 mm2, collected into a matrix of 256 × 128. For T2 measurements, the following TE values were used: 11.19, 30, 60 and 100 ms, and the TR was set to 3000 ms.Cell labelling (microscopy) with Gd·DOTA·Rhoda·DSA liposomes
Cationic liposomes were formulated in water as per the liposome preparation method described above using Gd·DOTA·Rhoda·DSA/CDAN/DOPE: 5/50/45 mol% (total lipid concentration of 1.2 mg mL−1). The size of the liposomes was assessed using PCS and was found to be on average ∼200 nm. At 24 h prior to cell labelling experiments, adherent IGROV-1 human ovarian carcinoma cells (1.25 × 10⁵ in a 6-welled plate) were grown on cover slips in Dulbecco's-Modified Eagle culture medium (DMEM) supplemented with 10% fetal calf serum (FCS) and 1% penicillin–streptomycin (Sigma-Aldrich) in a wet (37 °C) 5% CO2/90% air atmosphere. Cells were grown until 80% confluent. The media was then removed and the cells washed with PBS. The bimodal liposomes were then added to the cells (150 μL of cationic liposomes, total lipid concentration of 1.2 mg mL−1) and allowed to incubate for 5 h. After liposome uptake, the media was removed and the cells were washed with PBS (× 2), heparin (× 1 (20 mg mL−1), in order to remove unbound liposomes from cell surface), PBS (× 2), paraformaldehyde (PFA, × 1 (20 min at 37 °C)), PBS (× 2), glycine (× 1 (20 mM, 20 min at 37 °C)), and finally PBS (× 2). The slides were removed from the wells and fixed using Vectashield mounting medium (Vector Laboratories, CA, USA). Microscopy images were obtained on an Olympus 251 microscope.MRI visualization of IGROV-1 cells labelled with Gd·DOTA·Rhoda·DSA liposomes
24 h prior to liposome uptake, adherent IGROV-1 cells were grown in DMEM with 10% FCS and 1% penicillin–streptomycin (Sigma-Aldrich), in a 25 cm3 culture flask (5 × 10⁵ cells per well, 5 mL of growth medium) and a wet (37 °C) 5% CO2/90% air atmosphere. The cells were grown until 80% confluent, and the media was then removed and replaced with fresh media. The cationic liposomes and controls (utilizing the non-Gd precursor lipid DOTA·Rhoda·DSA 10 instead) were then added to the flask, swirled to ensure even dispersion, and incubated in a wet (37 °C) 5% CO2/90% air atmosphere for 8 h (150 μL for each, with Gd·DOTA·Rhoda·DSA liposomes containing a total of 578 ng of Gd per flask). After liposome uptake, the cells were washed with PBS (2 × 2 mL) and then treated with trypsin-EDTA (500 μL trypsin, 1mM EDTA) for 2 min at 37 °C. DMEM (complete, 3 mL) was added to neutralise the trypsin. The cells were washed with PBS and then centrifuged in PBS buffer (1 mL), the solution was decanted and the cells reconstituted in PBS by vortexing and spun (1500 rpm for 5 min) into pellets in eppendorf tubes filled with 200 μL PBS. The tubes were imaged whilst placed in a plastic sample holder, and T1 values were measured on a 4.7 T Varian MR scanner at 19 °C ambient bore temperature. T1 values were obtained from saturation recovery experiments performed with a standard spin-echo sequence and a 10 mm single slice acquisition in the sagittal plane (TR = 50, 100, ms, TE = 15 ms), 4 signal averages, FOV: 100 × 50 mm2, collected into a matrix of 256 × 128. Post-MRI assessment, the cell pellets were vortexed and diluted up to 5 mL with 2% nitric acid to give a total dilution of 1 in 25, and the concentration of Gd determined using a Varian VISTA PRO ICP-MS instrument. All data were corrected for these dilutions, and a blank 2% nitric acid sample was also analyzed.Effect of hydration solution on T1 relaxation
Cationic liposomes (as above) used to label cells were also prepared to a total concentration of 1.2 mg mL−1 using various hydration solutions (doubly distilled water, PBS, HEPES, supplemented or non-supplemented DMEM) as described in the Liposome Preparations section. For each liposome, 200 μL was placed in an eppendorf tube and the samples were placed in a plastic sample holder. T1 measurements at 4.7 T and 19 °C ambient bore temperature were used. Saturation recovery experiments were performed with a standard spin-echo sequence and a 10 mm single slice acquisition in the sagittal plane (TR = 50, 100 ms, TE = 15 ms), 4 signal averages, FOV; 100 × 50 mm2, collected into a matrix of 256 × 128.Cryo-TEM of in vivo neutral PEGylated bimodal liposomes
Neutral PEGylated liposomes were prepared as described in Liposome Preparations section (total lipid concentration of 1.2 mg mL−1) and sonicated for 30 min to ensure a size distribution of ∼100 nm. The liposomes were then dropped onto the surface of copper grids, and excess liquid was blotted using filter paper in an environment chamber with a relative humidity of 100% at 297 K. The liposomes were frozen in liquid ethane, and the vitrified specimens were stored under liquid nitrogen and placed in the TEM (temperature was maintained at −184 °C). Images were obtained using a Philips CM200 microscope operating at 200 kV.Mouse tumour model
IGROV-1 cells (2 × 10⁶/100 μL PBS) were implanted into the flanks of 6–8 week old Balb/c nude mice for generation of subcutaneous tumours. After ∼2 weeks (estimated tumour weights 40–50 mg) the mice were anaesthetized with an isoflurane/O2 mix, and placed into a quadrature 1H volume coil and positioned into the magnet. Baseline scans were obtained and the mice were injected intravenously (n = 3) via a lateral tail vein with a 150 μL liposome solution (HEPES (20 mM, NaCl 135 mM, pH 6.5)) and imaged at 4.7 T at 37 °C ambient bore temperature (spin echo sequence: TR = 400–2800 ms, TE = 10 ms, FOV = 45 × 45 cm2, averages: 1, matrix size: 256 × 128, thickness: 2.0 mm, and 20 slices). The injected dose contained 95.710 μg of Gd. After an initial baseline scan, the mice were placed back in the magnet and imaged at different intervals of 2, 14 and 24 h post-injection using the same parameters each time.Histology experiments
Following MRI, the animals were sacrificed and the tumours were excised. The tumours were frozen on liquid nitrogen, embedded in OCT (VWR) embedding compound, 7 μm thick sections cut and mounted on microscopy slides.MRI data analysis
A region of interest (ROI) was drawn around the samples containing the contrast agents or around the whole tumour in each MR image using Image J software (U.S. National Institutes of Health, Maryland, USA). Mean signal intensities of the ROIs at different TR values were transferred to Graphpad Prism (San Diego, California, USA) and T1 values calculated. Mean T1 values for each sample or tumour were derived and a two-tailed unpaired t-test assuming equal variances performed at each time point to determine significant difference, with a 5% level of statistical significance. The percentage change in T1 from pre-treatment was also calculated for each tumour-bearing animal.Acknowledgements
Funding for Nazila Kamaly was provided by the GTC and MRC. We thank Dr Tillmann Pape (Imperial College London) for cryo-TEM imaging and the Natural History Museum (London) for ICP-MS measurements.Notes and references
- M. M. Hüber, A. B. Staubli, K. Kustedjo, M. H. B. Gray, J. Shih, S. E. Fraser, R. E. Jacobs and T. J. Meade, Bioconjugate Chem., 1998, 9, 242 CrossRef CAS.
- C. Brekke, S. C. Morgan, A. S. Lowe, T. J. Meade, J. Price, S. C. Williams and M. Modo, NMR Biomed., 2007, 20, 77 CrossRef CAS.
- M. Modo, K. Mellodew, D. Cash, S. E. Fraser, T. J. Meade, J. Price and S. C. Williams, NeuroImage, 2004, 21, 311 CrossRef.
- A. Dirksen, S. Langereis, B. F. M. de Waal, M. H. P. van Genderen, E. W. Meijer, Q. G. de Lussanet and T. M. Hackeng, Org. Lett., 2004, 6, 4857 CrossRef CAS.
- J. V. Frangioni and R. J. Hajjar, Circulation, 2004, 110, 3378 CrossRef.
- M. Modo and J. W. M. Bulte, in Molecular and Cellular MR Imaging, ed. M. Modo and J. W. M. Bulte, CRC Press, Boca Raton, Florida, 2007, pp. 161–182 Search PubMed.
- M. Modo, M. Hoehn and J. W. M. Bulte, Mol. Imaging, 2005, 4, 143.
- O. Maier, V. Oberle and D. Hoekstra, Chem. Phys. Lipids, 2002, 116, 3 CrossRef CAS.
- H. Li, B. D. Gray, I. Corbin, C. Lebherz, H. Choi, S. Lund-Katz, J. M. Wilson, J. D. Glickson and R. Zhou, Acad. Radiol., 2004, 11, 1251 CrossRef.
- N. Kamaly, T. Kalber, A. Ahmad, M. H. Oliver, P. W. So, A. H. Herlihy, J. D. Bell, M. R. Jorgensen and A. D. Miller, Bioconjugate Chem., 2008, 19, 118 CrossRef CAS.
- M. Oliver, A. Ahmad, N. Kamaly, E. Perouzel, A. Caussin, M. Keller, A. Herlihy, J. Bell, A. D. Miller and M. R. Jorgensen, Org. Biomol. Chem., 2006, 4, 3489 RSC.
- H. Xu, C. A. S. Regino, Y. Koyama, Y. Hama, A. J. Gunn, M. Bernardo, H. Kobayashi, P. L. Choyke and M. W. Brechbiel, Bioconjugate Chem., 2007, 18, 1474 CrossRef CAS.
- S. Achilefu, A. Srinivasan, M. A. Schmidt, H. N. Jimenez, J. E. Bugaj and J. L. Erion, J. Med. Chem., 2003, 46, 3403 CrossRef CAS.
- K. Kachel, E. Asuncion-Punzalan and E. London, Biochim. Biophys. Acta, Biomembr., 1998, 1374, 63 CrossRef CAS.
- N. Kamaly, T. Kalber, M. Thanou, J. D. Bell and A. D. Miller, Bioconjugate Chem., 2009, 20, 648 CrossRef CAS.
- V. P. Torchilin, AAPS J., 2007, 9, E128 Search PubMed.
- H. Maeda, J. Wu, T. Sawa, Y. Matsumura and K. Hori, J. Controlled Release, 2000, 65, 271–284 CrossRef CAS.
- F. Yuan, M. Dellian, D. Fukumura and M. Leunig, Cancer Res., 1995, 55, 3752 CAS.
- J. W. M. Bulte, L. D. Ma, R. L. Magin and R. L. Kamman, Magn. Reson. Med., 1993, 29, 32 CAS.
- J. W. M. Bulte, T. Douglas, B. Witwer, S. C. Zhang, E. Strable, B. K. Lewis, H. Zywicke, B. Miller, P. van Gelderen and B. M. Moskowitz, Nat. Biotechnol., 2001, 19, 1141 CrossRef CAS.
- J. W. M. Bulte, I. D. Duncan and J. A. Frank, J. Cereb. Blood Flow Metab., 2002, 22, 899 Search PubMed.
- C. Corot, K. G. Petry, R. Trivedi, A. Saleh, C. Jonkmanns, J. F. Le Bas, E. Blezer, M. Rausch, B. Brochet and P. Foster-Gareau, Invest. Radiol., 2004, 39, 619 CrossRef CAS.
- G. Fleige, F. Seeberger, D. Laux, M. Kresse, M. Taupitz, H. Pilgrimm and C. Zimmer, Invest. Radiol., 2002, 37, 482 CrossRef CAS.
- C. Riviere, F. P. Boudghene, F. Gazeau, J. Roger, J. N. Pons, J. P. Laissy, E. Allaire, J. B. Michel, D. Letourneur and J. F. Deux, Radiology, 2005, 235, 959 Search PubMed.
- R. Sun, J. Dittrich, M. Le-Huu, M. M. Mueller, J. Bedke, J. Kartenbeck, W. D. Lehmann, R. Krueger, M. Bock and R. Huss, Invest. Radiol., 2005, 40, 504 CrossRef.
- K. Vuu, J. Xie, M. A. McDonald, M. Bernardo, F. Hunter, Y. Zhang, K. Li, M. Bednarski and S. Guccione, Bioconjugate Chem., 2005, 16, 995 CrossRef CAS.
- B. Sitharaman, L. A. Tran, Q. P. Pham, R. D. Bolskar, R. Muthupillai, S. D. Flamm, A. G. Mikos and L. J. Wilson, Contrast Media Mol. Imaging, 2007, 2, 139 Search PubMed.
- C. Cabella, S. G. Crich, D. Corpillo, A. Barge, C. Ghirelli, E. Bruno, V. Lorusso, F. Uggeri and S. Aime, Contrast Media Mol. Imaging, 2006, 1, 23 Search PubMed.
- H. Kobayashi, S. K. Jo, S. Kawamoto, M. W. Brechbiel, M. J. Lizak, A. Koretsky, T. A. Waldmann, P. L. Choyke and R. A. Star, Acad. Radiol., 2005, 12, 78.
- B. Sitharaman, L. A. Tran, Q. P. Pham, R. D. Bolskar, R. Muthupillai, S. D. Flamm, A. G. Mikos and L. J. Wilson, Contrast Media Mol. Imaging, 2007, 2, 139–146 Search PubMed.
- C. Tilcock, E. Unger, P. Cullis and P. MacDougall, Radiology, 1989, 171, 77–80 CAS.
- E. Unger, C. Tilcock, Q. F. Ahkong and T. Fritz, Invest. Radiol., 1990, 25, S65 CAS.
- M. Keller, M. R. Jorgensen, E. Perouzel and A. D. Miller, Biochemistry, 2003, 42, 6067 CrossRef CAS.
- M. B. Bally, P. Harvie, F. M. P. Wong, S. Kong, E. K. Wasan and D. L. Reimer, Adv. Drug Delivery Rev., 1999, 38, 291 CrossRef CAS.
- Y. Xu and F. C. Szoka, Biochemistry, 1996, 35, 5616 CrossRef CAS.
- S. M. Moghimi and J. Szebeni, Prog. Lipid Res., 2003, 42, 463 CrossRef CAS.
- G. L. Scherphof, M. Velinova, J. Kamps and J. Donga, Liposome research days: Towards new products for human health, Shizuoka, Japan, 1996, p. 179 Search PubMed.
- S. Bhattacharya and S. Haldar, Biochim. Biophys. Acta, Biomembr., 2000, 1467, 39 CrossRef CAS.
- T. Lian and R. J. Y. Ho, J. Pharm. Sci., 2001, 90, 667 CrossRef CAS.
Footnotes |
| † Electronic supplementary information (ESI) available: NMR spectra for compounds 4, 5, 7, 8 and 10; HPLC details and results for compounds 8 and 1. See DOI: 10.1039/b910561a |
| ‡ Contact address for Dr M. Jorgensen: King's College London, 8th Floor, Capital House, 42 Weston Street, London SE1 3QD. Fax +44 (0)207 848 8122; Tel: +44 (0)20 7848 8125. |
| This journal is © The Royal Society of Chemistry 2010 |