Probing magnetic and gold nanoparticles by using MAClevers® as ultrasensitive sensors
Marcelo
Nakamura
,
Koiti
Araki
and
Henrique E.
Toma
*
Instituto de Química, Universidade de São Paulo, Caixa Postal 26077, CEP 05513-970, São Paulo, SP, Brazil. E-mail: henetoma@iq.usp.br
First published on 27th October 2010
Abstract
Magnetic AFM probes known as MAClevers® were employed for sensing picogram amounts of magnetic nanoparticles, based on the cantilever frequency shifts resulting from the magnetically induced adsorption of mass. By using organothiol functionalized magnetic nanoparticles, this analytical strategy was successfully extended to the detection of gold nanoparticles, as confirmed by confocal Raman microscopy.
Microfabricated cantilevers primarily designed for atomic force microscopy (AFM) have been successfully employed in ultrasensitive mass detection, especially in gas analysis, environmental control, biochemical assays and medical applications.1–9 In the case of chemical sensing applications, cantilevers can be suitably coated on their upper and lower surfaces with a molecular layer capable of recognizing molecules and biological species. The AFM probes also incorporate an “optical lever” read-out scheme, in which a laser beam is reflected from the end of the cantilever. The surface stress produced by the binding of molecular or biological species on the cantilever results on a static bending, which can be readily detected, since the laser beam is displaced as the silicon bar bends. Such displacement is converted into an electronic signal after projecting the reflected laser beam onto a position-sensitive photodetector. Alternatively, in the conventional dynamic tapping mode, the cantilever is oscillated externally at its resonance frequency using a piezoelectric actuator.
The resonance frequency, ν, of an oscillating cantilever varies sensitively as a function of mass loading, Δm, according to eqn (1):
 | (1) |
As previously noticed by Hansen and Thundat11 in some cases, the spring constant can change if the adsorption of molecules promotes amalgamation or swelling of the cantilever. On the other hand, the resonance frequency of a cantilever decreases by a factor of five when operated under solution. In contrast to the applications for vapor based sensing, the frequency variation is not very sensitive for operation under solution, due to increased damping. This is particularly critical in solutions containing nanoparticles.12 For this reason, frequency measurements would be better performed after removing the cantilever from the sample solutions.
Among the several AFM operating modes, there is a special one in which a magnetic coating is applied to the cantilever with the specific purpose of inducing a force by applying an external field from a solenoid.13,14 This strategy has been commercially explored in the so-called MAC-mode AFM, employing special cantilevers (MAClevers®) coated with a proprietary magnetic material. A great imaging improvement has been obtained, as compared with the conventional tapping mode, because the vibration amplitude is mostly concentrated at the cantilever, rather than on the supporting device.
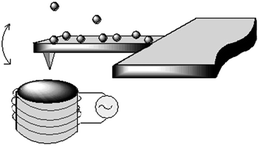
The MAClevers® employed in this work consisted of rectangular-shaped silicon or silicon nitride plates of about 3 µm thickness, 40 µm wide and 245 µm long, which are connected on one end to a more robust support for easy handling. The top side is provided with a magnetic coating, and at the cantilever end there is a sharp tip on the underside, which is used for probing the surface topology by AFM. The tip is not required when the cantilever is employed as transducing element in ultrasensitive mass sensors. As a target we have chosen the Fe3O4 nanoparticles because of the superparamagnetic behavior promoted by the single magnetic domains at the nanoscale. The great advantage of using such magnetic cantilevers for sensing magnetic nanoparticles is that no previous chemical modification procedure is necessary (Fig. 1). To the best of our knowledge, the interaction of magnetic cantilevers with superparamagnetic nanoparticles has never been explored before.
 | ||
| Fig. 1 Magnetic nanoparticles interacting with a MAClever® which oscillates under the influence of the applied field generated from an external solenoid. | ||
It should be mentioned that our approach goes far beyond the detection of magnetic nanoparticles. As a matter of fact, magnetic nanoparticles can be modified in many different ways in order to allow the immobilization of chemicals and enzymes, for applications in bioseparation, immunoassays, drug delivery, biosensors, and hyperthermic and photodynamic therapies.15–27 Therefore, mass detection of such modified magnetic nanoparticles may be quite relevant, since such measurement would also convey information on the adsorbed species. On the other hand, in many cases, such as those involving biological samples, one has to deal with tiny amounts and volumes, thus requiring ultrasensitive miniaturized sensors such as the MAClevers®. In fact, because of the very small dimensions, a single drop of the magnetic nanoparticle solution is enough to completely cover the MAClever® probe. If necessary, it is also possible to perform preconcentration procedures, using, for instance, a magnet to attract the nanoparticles from the solution and transporting them to the end of a capillary, in which the MAClever® probe is inserted.
In this work, superparamagnetic nanoparticles (MagNPs) of about 20 nm were obtained from Fe2+, Fe3+ and NaOH solutions, by the co-precipitation method15 and stabilized with 3-mercaptopropyltrimethoxysilane (MPTS). After immersing the MAClever® into diluted solutions of MPTS–MagNP, their binding to the magnetic coated side of the cantilever was probed by means of resonance frequency measurements and confocal Raman microscopy. In contrast to a simple adsorption, the magnetic interaction seems to be strong enough to allow successive washings by dipping the cantilever into nanopure water. Such washing procedure was always applied before the frequency measurements, in order to remove any weakly adsorbed material.
The second target in our work was the gold nanoparticles. As a matter of fact, gold nanoparticles are being extensively employed in chemistry, biochemistry and medical research,28–42 and their determination, using cantilever probes can be of great relevance. For this purpose, the gold nanoparticles (AuNPs) of about 20 nm were prepared according to the method of Turkevitch et al.28 and Kim et al.29 They incorporate an electrically charged citrate shell which prevents the nanoparticles aggregation. Their special feature, however, is that the citrate ions can be readily replaced by chemical species exhibiting greater affinity for the gold atoms, such as the organothiols.
It should be noticed that the direct interaction of the gold nanoparticles with the MAClever® is not effective because of the lack of suitable binding sites or interfaces. Thus, the use of magnetic nanoparticles functionalized with 3-mercaptopropyltrimethoxysilane (MPTS) is rather appropriate, since they provide a large number of thiol groups for interacting with the gold nanoparticles (Fig. 2). In this way, the MAClever® was first employed to probe the MPTS–magnetic nanoparticles, and after measuring the resonance frequency, the modified cantilever was used again to evaluate the frequency response from the exposure to a 10−9 M gold colloidal solution.
 | ||
| Fig. 2 Magnetic binding of MPTS–MagNPs to the MAClever® (A) followed by the chemical recognition of citrate stabilized gold nanoparticles by the adsorbed MPTS–MagNPs (B). | ||
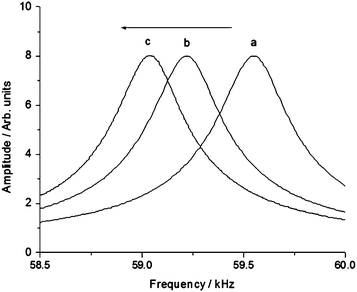
In order to probe the amount of deposited nanoparticles, the frequency spectra of the cantilever (MAClever® type II) were recorded using the PicoSPM-I equipment from Molecular Imaging (Agilent), equipped with the MAC mode accessory and a PicoScan 2100 controller, as shown in Fig. 3. The frequency spectra were obtained by collecting 400 points, corresponding to a typical experimental error of 4.39 Hz. This deviation represents an error of about 9.7 pg on the mass results.
 | ||
| Fig. 3 Frequency spectra of the MAClever® (a) before and (b) after the successive immersion (60 s) into a solution of magnetic nanoparticles (2 mg mL−1), followed by repetitive washings in nanopure water; and again into 10−9 mol dm−3 gold nanoparticles, and washing (c) in a laminar flow clean box. | ||
It should be noted that the observed frequency spectra were well defined, thus allowing precise resonance frequency measurements (Fig. 3). On the other hand, the maintenance of the original band shape along the process is consistent with the conservation of the cantilever spring constants and properties.
Typical cantilever probes employed in this work exhibited resonance frequencies in the range of 59![[thin space (1/6-em)]](https://www.rsc.org/images/entities/char_2009.gif) 541–59
541–59![[thin space (1/6-em)]](https://www.rsc.org/images/entities/char_2009.gif) 948 Hz. The determination of k is a very relevant issue. It can be done from thermally induced stiffness measurements; however, in the lack of this facility, as in our case, the cantilever constant can also be evaluated from the geometrical parameters previously determined by optical microscopy. As a matter of fact, from the measured values of thickness = 3 µm, width = 39 µm, and length = 245 µm, the calculated values of k assuming a rectangular shape44 were 2.8 ± 0.1 N m−1, in good agreement with the average value supplied by the fabricant. Calculations based on trapezoidal geometries were also carried out,44 however, the results were not too different from those obtained using the rectangular approximation.
948 Hz. The determination of k is a very relevant issue. It can be done from thermally induced stiffness measurements; however, in the lack of this facility, as in our case, the cantilever constant can also be evaluated from the geometrical parameters previously determined by optical microscopy. As a matter of fact, from the measured values of thickness = 3 µm, width = 39 µm, and length = 245 µm, the calculated values of k assuming a rectangular shape44 were 2.8 ± 0.1 N m−1, in good agreement with the average value supplied by the fabricant. Calculations based on trapezoidal geometries were also carried out,44 however, the results were not too different from those obtained using the rectangular approximation.
From the systematic shift of the cantilever resonance frequency (νo) to a lower value (ν), the effective mass increase can be calculated by means of the equation:
 | (2) |
| Steps | Frequency/Hz | Δm/pg |
|---|---|---|
| Initial | 59![[thin space (1/6-em)]](https://www.rsc.org/images/entities/char_2009.gif) 541 541 |
0 |
| +MPTS–MagNP (2 mg mL−1) | 59![[thin space (1/6-em)]](https://www.rsc.org/images/entities/char_2009.gif) 211 211 |
894 |
| +AuNP(10−9 M) | 59![[thin space (1/6-em)]](https://www.rsc.org/images/entities/char_2009.gif) 098 098 |
309 |
In order to evaluate the concentration dependence, two new cantilevers were used to probe diluted samples containing 16 and 42 µg mL−1 of MPTS–MagNP. The contact time was reduced to 20 s, in order to decrease the amount of adsorbed nanoparticles, and to keep the coverage far from the saturation of the MAClever surface. Under this condition, the observed frequency shifts were 66 and 138 Hz, corresponding to a mass increase of 144 and 373 pg, respectively. This result reflects a good linearity of the MAClever response with respect to the concentration of the MPTS–MagNPs.
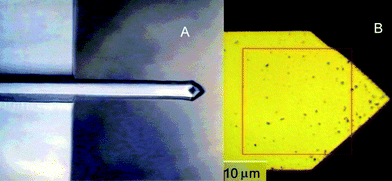
The distribution of the nanoparticles on the MAClever®, was probed by confocal Raman microscopy, using a WITEC alpha 300R equipment with a Nd:YAG laser (λ = 532 nm) and a piezoelectric scanning table. A highly diluted condition (<10 µg mL−1 MPTS–MagNP) was employed for Raman imaging, focusing on the surface area delimited in Fig. 4B. In all experiments, the laser power was kept less than 25 mW on the sample stage. The Raman images were generated from the band height intensities measured at the maximum of the selected peaks.
 | ||
| Fig. 4 Low resolution optical image of a commercial MAClever® at the top side face (A) and high resolution confocal optical image at the top side (B) after its successive interaction with superparamagnetic nanoparticles, gold nanoparticles, and washings. | ||
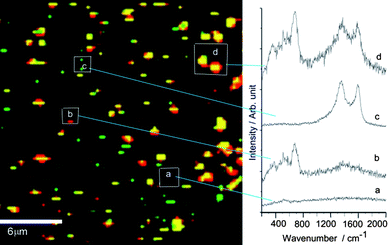
The Raman output for the adsorbed nanoparticles exhibited three distinct spectral profiles. The first one consisted of characteristic peaks at 680, 504 and 360 cm−1 which can be associated with the iron oxide core of the superparamagnetic nanoparticles.43 According to the literature,43 the strongest Raman peak at 680 cm−1 is consistent with magnetite (Fe3O4) as the major species, but the broad signals around 504 and 360 cm−1 also suggest the presence of some maghemite (γ-Fe2O3). This species also exhibits strong superparamagnetic behaviour, and is a natural product from the air oxidation of magnetite.
The second Raman profile exhibited peaks at 1350 and 1600 cm−1, and was only observed after the treatment with the citrate stabilized gold nanoparticles. It should be noticed that the citrate ions are poor Raman scattering species. The observed peaks are actually associated with carbonized materials, as often observed in confocal Raman microscopy measurements. However, this effect is only concentrated on the gold nanoparticles because of the coupling of the exciting electromagnetic radiation (532 nm) with the surface plasmons, thus leading to local heating and the carbonization of the citrate shell. Carbonization was not observed in the case of the MPTS–MagNPs. Although, in principle, the carbonization can be prevented by decreasing the laser power, in this case, the possibility of detecting and imaging the gold nanoparticles would be rather small, because of the poor scattering characteristics of the citrate ions. Therefore, for imaging purposes, carbonization provides a convenient way of producing strong Raman signals, thus allowing to probe the gold nanoparticles.
Most important, however, is that the third and dominant pattern was composed by the sum of the MagNPs and carbonized AuNPs signals, as expected for their selective interaction at the cantilever surface.
The Raman imaging of the selected area in the MAClever® probe, based on the spectral intensities for the vibrational peaks at 680 and 1580 cm−1 can be seen in Fig. 5. In addition to a few spots corresponding to isolated superparamagnetic nanoparticles and gold nanoparticles, it is evident that the associated nanoparticles appear in a large number, thus corroborating the binding between the gold nanoparticles and the MPTS functionalized superparamagnetic nanoparticles.
 | ||
| Fig. 5 Confocal Raman imaging of the selected MAClever® area in Fig. 4, showing (a) the background spectral distribution, (b, red) the presence of isolated MagNP monitored at 690 cm−1, (c, green) AuNP monitored at 1580 cm−1 and (d, yellow) the associated AuNP/MagNP (690 and 1580 cm−1). | ||
In conclusion, commercially available MAClevers® can be directly employed in the detection of picogram amounts of magnetic nanoparticles, with the advantage of not requiring any previous chemical functionalization. On the other hand, the combination of such cantilevers with suitably functionalized magnetic nanoparticles, allows to expand their usefulness in the ultrasensitive detection of a variety of substrates capable of interacting with the nanoparticle interface. This concept was successfully demonstrated by using the MPTS–magnetic nanoparticles for the detection of citrate stabilized gold nanoparticles.
Acknowledgements
The authors thank the financial support from FAPESP, CNPq and PETROBRAS.References
- T. Thundat, G. Y. Chen, R. J. Warmack, D. P. Allison and E. A. Wachter, Anal. Chem., 1995, 67, 519 CrossRef.
- H. P. Lang and C. Gerber, Top. Curr. Chem., 2008, 285, 1 CAS.
- K. M. Goeders, J. C. Colton and L. A. Bottomley, Chem. Rev., 2008, 108, 522 CrossRef CAS.
- J. Pei, F. Tian and T. Thundat, Anal. Chem., 2004, 76, 292 CrossRef CAS.
- C. Y. Chen, T. Thundat, E. A. Wachter and R. J. Warmack, J. Appl. Phys., 1995, 77, 3618 CrossRef CAS.
- R. Datar, S. Kim, S. Jeon, P. Hesketh, S. Manalis, A. Boisen and T. Thundat, MRS Bull., 2009, 34, 449 CAS.
- H. F. Ji, H. Gao, K. R. Buchapudi, X. Yang, X. Xu and M. K. Schulte, Analyst, 2008, 133, 434 RSC.
- D. Lee, T. Thundat and S. Jeon, Sens. Actuators, B, 2007, 124, 143 CrossRef.
- S. Velanki, S. Kelly, T. Thundat, D. A. Blake and H.-F. Ji, Ultramicroscopy, 2007, 107, 1123 CrossRef CAS.
- S. M. Han, H. Benaroya and T. Wei, J. Sound Vib., 1999, 225, 935 CrossRef.
- K. M. Hansen and T. Thundat, Methods, 2005, 37, 57 CrossRef CAS.
- L. A. Bottomley, M. A. Poggi and S. Shen, Anal. Chem., 2004, 76, 5685 CrossRef CAS.
- W. Han, S. M. Lindsay and T. Jing, Appl. Phys. Lett., 1996, 69, 4111 CrossRef CAS.
- W. Han, S. M. Lindsay, M. Dlakic and R. E. Harington, Nature, 1997, 386, 563 CrossRef CAS.
- M. Yamaura, R. L. Camilo, L. C. Sampaio, M. A. Macedo, M. Nakamura and H. E. Toma, J. Magn. Magn. Mater., 2004, 279, 210 CrossRef CAS.
- S. H. Huang, M. H. Liao and D. H. Chen, Biotechnol. Prog., 2003, 19, 1095 CrossRef CAS.
- M. Safarikova and I. Safarik, Magn. Electr. Sep., 2001, 10, 223 Search PubMed.
- S. D. Tong, B. Xue and Y. Sun, Biotechnol. Prog., 2001, 17, 134 CrossRef CAS.
- J. I. Taylor, C. D. Hurst, M. J. Davies, N. Sachsinger and I. J. Bruce, J. Chromatogr., A, 2000, 890, 159 CrossRef CAS.
- E. Katz, L. Sheeney-Haj-Ichia, A. F. Buckmann and I. Willner, Angew. Chem., Int. Ed., 2002, 41, 1343 CrossRef CAS.
- S. Odenbach, Colloids Surf., A, 2003, 217, 171 CrossRef CAS.
- M. Safarikova and I. Safarik, Magn. Electr. Sep., 2001, 10, 223 Search PubMed.
- A. Jordan, P. Wust, R. Scholz, B. Tesche, H. Fahling, T. Mitrovics, T. Vogl, J. Cervosnavarro and R. Felix, Int. J. Hyperthermia, 1996, 12, 705 CAS.
- M. H. A. Guedes, M. E. A. Guedes, P. C. Moraes, M. F. da Silva, T. S. Santos, J. P. Alves, C. E. Bertelli, R. B. Azevedo and Z. G. Lacava, J. Magn. Magn. Mater., 2004, 272–276, 2406 CrossRef CAS.
- P. Tartaj, M. D. Morales, S. Veintemillas-Verdaguer, T. Gonzales-Carreno and C. J. Serna, J. Phys. D: Appl. Phys., 2003, 36, R182 CrossRef CAS.
- C. C. Berry and A. S. G. Curtis, J. Phys. D: Appl. Phys., 2003, 35, R198 CrossRef.
- C. G. M. Netto, L. H. Andrade and H. E. Toma, Tetrahedron: Asymmetry, 2009, 20, 2299 CrossRef CAS.
- J. Turkevitch, P. C. Stevenson and J. Hilier, Discuss. Faraday Soc., 1951, 11, 55 RSC.
- D. K. Kim, M. Mikhaylova, Y. Zhang and M. Muhammed, Chem. Mater., 2003, 15, 1617 CrossRef CAS.
- S. Eustis and M. A. El-Sayed, Chem. Soc. Rev., 2006, 35, 209 RSC.
- M. E. Stewart, C. R. Anderton, L. B. Thompson, J. Maria, S. K. Gray, J. A. Rogers and R. G. Nuzzo, Chem. Rev., 2008, 108, 494 CrossRef CAS.
- J. Zhao, A. O. Pinchuk, J. M. McMahon, S. Z. Li, L. K. Ausman, A. L. Atkinson and G. C. Schatz, Acc. Chem. Res., 2008, 41, 1710 CrossRef CAS.
- J. P. Camden, J. A. Dieringer, J. Zhao and R. P. Van Duyne, Acc. Chem. Res., 2008, 41, 1653 CrossRef CAS.
- X. M. Lin, Y. Cui, Y. H. Xu, B. Ren and Z. Q. Tian, Anal. Bioanal. Chem., 2009, 394, 1729 CrossRef CAS.
- C. Noguez and I. L. Garzon, Chem. Soc. Rev., 2009, 38, 757 RSC.
- M. C. Daniel and D. Astruc, Chem. Rev., 2004, 104, 293 CrossRef CAS.
- J. W. M. Chon, C. Bullen, P. Zijlstra and M. Gu, Adv. Funct. Mater., 2007, 17, 875 CrossRef CAS.
- M. S. Chen and D. W. Goodman, Acc. Chem. Res., 2006, 39, 739 CrossRef CAS.
- V. M. Zamarion, R. A. Timm, K. Araki and H. E. Toma, Inorg. Chem., 2008, 47, 2934 CrossRef CAS.
- F. S. Nunes, L. D. Bonifacio, K. Araki and H. E. Toma, Inorg. Chem., 2006, 45, 94 CrossRef CAS.
- L. S. Bonifacio, C. R. Gordijo, V. R. L. Constantino, D. O. Silva, P. K. Kiyohara, K. Araki and H. E. Toma, J. Nanosci. Nanotechnol., 2008, 8, 274 CAS.
- H. S. Toma, J. A. Bonacin, K. Araki and H. E. Toma, Eur. J. Inorg. Chem., 2007, 3356 CrossRef.
- M. A. Poggi, A. W. MacFarland, J. S. Colton and L. A. Bottomley, Anal. Chem., 2005, 77, 1192 CrossRef CAS.
- D. L. A. de Faria, S. V. Silva and M. T. de Oliveira, J. Raman Spectrosc., 1997, 28, 873 CrossRef.
| This journal is © The Royal Society of Chemistry 2010 |
