Monitoring early stages of silver particle formation in a polymer solution by in situ and time resolved small angle X-ray scattering†
Gaetano
Campi
*a,
Alessandra
Mari
b,
Heinz
Amenitsch
c,
Augusto
Pifferi
a,
Carla
Cannas
d and
Lorenza
Suber
b
aCNR-Istituto di Cristallografia, Via Salaria, Km 29.300, Monterotondo Stazione, RM I-00015, Italy. E-mail: g.campi@ic.cnr.it
bCNR- Istituto di Struttura della Materia, Via Salaria, Km 29.300, Monterotondo Stazione, RM I-00015, Italy
cInstitut of Biophysics and Nanosystems Research, Austrian Academy of Sciences, Schmiedlstrasse 6, 8042, Graz, Austria
dChemistry Department, University of Cagliari, SS 554 Bivio per Sestu, Monserrato, CA I-O9042, Italy
First published on 12th October 2010
Abstract
Silver particles have been prepared by reduction of silver nitrate with ascorbic acid in acidic aqueous solution containing a low concentration of a commercial polynaphthalene sulfonate polymer (Daxad 19) as dispersant agent. The reduction has been induced and controlled by the slow addition of ascorbic acid at a fixed rate; in this way, we were able to monitor the formation of a silver crystalline colloidal dispersion by in situ and time resolved Small Angle X-ray Scattering measurements. Modeling the scattering intensity with interacting spherical particles in a polymer–Ag like-fractal template allowed us to distinguish different stages involving liquid-like ordered cluster nucleation, cluster growth up to primary particle formation and particle coalescence. Between primary particle formation and particle coalescence, we observed the occurrence of a transient phase of core–shell type structures having primary particles as stable cores in expanding shells built by the organic polymer. We discuss these results in a twofold perspective pertaining both to technology, relative to controlled fabrication of metal nanoparticles and to basic chemical physics, dealing with non standard stepwise crystallization from solutions.
1. Introduction
Nanotechnology provides the ability to engineer the properties of materials by controlling their size and shape, driving research toward a multitude of potential applications.1–13 Among nanomaterials, noble metals8–14 such as silver nanoparticles15–17 have received considerable attention due to their attractive physicochemical properties. The most widely used methods for their synthesis rely on wet chemistry approaches. Typically, they involve the reduction of a silver salt with a reducing agent in the presence of a surfactant or polymer stabilizer to protect the particles from aggregation and achieve long-term stability.18,19We recently exploited a silver nanoparticle synthesis utilizing silver nitrate as salt, nitric acid to set acidic conditions, ascorbic acid as a reducing agent and Daxad 19 as stabilizer in the aqueous phase. Daxad 19, formed by condensation of naphthalene sulfonic acid with formaldehyde,20,21 acts as a synthetic template to control particle aggregation, whereas the acidic conditions slow down the reduction of AgNO3 with ascorbic acid in aqueous solution according to: 2Ag+ + C6H8O6 ↔ 2Ag0 + C6H6O6 + 2H+. The Ag0 atoms assemble to form particles that can be tailored by tuning different experimental parameters, such as reaction temperature, pH and polymer concentration.22
While various methods for assembling crystalline nanostructures are well tested,23–27 the mechanisms of their formation are not yet completely understood. The most famous and widely used theory to explain nanoparticle formation is the so-called classical nucleation theory (CNT) by Lamer;28,29 he proposed a mechanism where a homogeneous burst nucleation and the following growth by atomic diffusion are well-distinguishable processes. This theory is still able to explain nanoparticle formation in various cases, as reported in the following recent literature. Abecassis and coworkers30 investigated the nucleation and growth of gold nanoparticles obtained through the reduction of a gold salt, solubilized in toluene by a cationic surfactant, with a borohydride salt in the presence of an excess of decanoic acid. They found that a nucleation and a growth period are separately observed in the course of reaction time; these kinetics are also consistent with Harada and coworkers’ results31 where silver colloidal dispersions are obtained by the photoreduction of silver perchlorate (AgClO4) and nucleation is followed by growth assisted by an autocatalytic process. The formation of palladium (Pd) nanoparticles by a temperature jump in a reaction medium containing polyisoprene-block-poly(2-vinylpyridine) (PI-b-P2VP) was investigated by Sakamoto and coworkers.32 They observed the nucleation and growth of Pd nanoparticles as liquid like ordered cores of about 2 nm in shells of 6 nm built by adsorbed polymeric chains using in situ and time-resolved small-angle X-ray scattering (SAXS) measurements.
Anyway, with the passage of time several new experimental results suggest that in many cases, nucleation does not follow the classical theory but occurs through more complex and stepwise pathways.33–35 This Multi Step Crystallizzation (MSC) strategy has been found to be a scheme widely adopted in nature, e.g. in biomineralization,36 as well as in protein crystallization.37,38
Recently, a multistep mechanism has been proposed also in the study of the transition metal nanoparticles formation by different authors. Kimling and coworkers39 observed a stepwise process in gold nanoparticles’ formation where first, gold clusters are formed due to quick Au(III) reduction and then these clusters assembly into larger polycrystalline particles. On the contrary, Pong et al.40 suggested that the initial fast reduction of AuCl4− is followed by formation of clusters that assemble into chains and networks of crystalline particles interconnected by amorphous gold. Those chains increase in diameter to finally collapse and cleave while at the same time individual particles grow and reach a final size of about 7.5 nm radius. Different phases in gold nanoparticle formation were also observed by Polte and coworkers.41 They observed first a rapid nucleation process in which polydisperse nuclei with mean radii of 2 nm are formed; subsequently, the nuclei merge and coalesce to form particles with a 4-nm mean radius and reduced polydispersity. Following this, a second diffusional growth phase occurs, leading to particles with a mean radius of 5.2 nm and finally, 7.6-nm particles are obtained by fast growth due to the reduction of remaining Au(III) ions.
Although the advances in microscopy techniques as well as the possibility of enhanced time resolution scattering and spectroscopy measurements due to the high brilliance synchrotron radiation allowed the collection of new and interesting information about the dynamics of nanoparticle formation there remains a lack of direct experimental evidence supporting the MCS model; indeed, in situ observation of the crystal nucleation driven by transient phases and, more generally, monitoring the early stages of crystallization, presents several hurdles such as the speed of nucleation, the size of aggregates falling outside of the investigated ranges or the low signal-to-background ratio in diluted systems.
In this work we aim to monitor the early stages of silver particle formation by Ag+ reduction in an acidic Daxad solution at a fixed temperature of 40 °C; adding the reducing agent at a fixed slow rate, we could control the Ag+ ions reduction achieving the formation of the Ag0 crystalline colloidal dispersion in about 300 s; in this time-scale length, synchrotron time-resolved SAXS technique is a powerful tool for in situ observation of the nanostructure formation process. We collected data with a time resolution of 0.9 s; in this way we could observe different stages in the formation of crystalline silver colloidal dispersion.
2. Experimental
2.1 Materials
Silver nitrate and L-ascorbic acid, purchased from Aldrich, were of the highest purity grade. HNO3, 69.5 wt%, was purchased from Carlo Erba. Daxad 19 (the sodium salt of a naphthalene sulfonate–formaldehyde condensate, having 80 kD average molecular weight), indicated in the following as Daxad, was obtained from Hampshire Chemical Company. Daxad elemental analysis (wt %): C: 42.42, H: 3.44, S: 6.20.2.2 Sample preparation and characterization
AgNO3 (1.02 g, 6.0 mmol) was dissolved in 30 mL of water and the solution was thermostated at 40 ± 2 °C. A 0.178 g of Daxad and 3.1 mL of HNO3 were added under mechanical stirring. The procedure was completed in two minutes. Then ascorbic acid (1.2 g, 6.8 mmol), dissolved in 4.0 mL of water, was added at a 0.5 mL min−1 rate. After 1 h stirring at the above temperature, the flask was cooled to 20 °C. After settling off the light grey precipitate, the mother liquors were siphoned, the precipitate washed three times with deionised water and dried under vacuum.In situ X-ray diffraction (XRD) measurements were performed on the XRD beamline42 at Elettra, by using a photon energy of 18 keV and a CCD detector placed at a distance of 40 mm from the sample; powder patterns on the precipitated dried sample have been measured by means of an automated powder diffractometer using Cu-Kα radiation.
SEM measurements were performed at 20 kV with a SEM JEOL 6400. The samples were gold sputtered before investigation.
Silver colloidal dispersions were dropped on carbon-coated copper grids and observed by means of a TEM (JEOL 200CX) operating at 200 kV.
2.3 In situ time resolved SAXS measurements and data analyses
SAXS measurements were performed on the Austrian SAXS beamline at Elettra, Trieste;43 we set the camera to a sample detector distance of 1.5 m and operated at a photon energy of 8 KeV covering the q range between 0.07 and 1.7 nm−1. We used a batch reactor apparatus consisting of a glass flask where the reaction takes place, a remote controlled syringe that allowed us to add 4 mL of ascorbic acid solution at the fixed rate of 0.5 mL min−1 into the reaction solution, and a peristaltic pump that continuously flows the solution mixture in a 1.5 quartz capillary through a closed circuit; the pumping rate was set to 20 mL min−1 in order to change all the tubing (1 m × 2mm) volume in less than 10 s, avoiding particle deposition on the walls. Both the batch reactor and the capillary were thermostated to 40 °C. Two dimensional SAXS patterns were thus regularly recorded on a CCD camera with a time resolution of 0.9 s. Data have been treated involving detector corrections for flat field response, spatial distortion, dark current of the CCD and normalization by the incident flux; water flowing was also measured in order to assess and subtract the background from the data. The resulting two-dimensional images were integrated to obtain 1d pattern of normalized intensity versus scattering vector q.3. Results and discussion
Ag colloidal particles are formed at 40 °C by reduction of AgNO3 with ascorbic acid in an acidic 0.5% w/w aqueous solution of a commercial polynaphthalene sulfonate polymer termed Daxad. The Ag particles have been characterized by way of electron microscopy and diffraction techniques. SEM and TEM bright field mode images are shown in Fig. 1a and Fig. 1b, respectively: the particle shape appears to be close to hexagonal, with a mean size of 112 nm and a standard deviation of 20 nm (Fig. 1c).![(a) SEM image of Ag particles; the scale bar is 1.1 μm. (b) TEM image of Ag particles. (c) Diameter distribution for the Ag particles; diameter was obtained by bright field images measuring the average diameter as Dmin + Dmax/2 for each particle for 250 particles in different parts of the grid. The standard deviation, σ, is calculated from the following equation:σ = {∑[ni(Di − D)2]/N}1/2.](/image/article/2010/NR/c0nr00390e/c0nr00390e-f1.gif) | ||
| Fig. 1 (a) SEM image of Ag particles; the scale bar is 1.1 μm. (b) TEM image of Ag particles. (c) Diameter distribution for the Ag particles; diameter was obtained by bright field images measuring the average diameter as Dmin + Dmax/2 for each particle for 250 particles in different parts of the grid. The standard deviation, σ, is calculated from the following equation:σ = {∑[ni(Di − D)2]/N}1/2. | ||
The crystalline nature of the particles has been revealed by Selected Area Electron Diffraction (SAED) and X-ray powder diffraction (XRD). In Fig. 2 we show the SAED pattern of a single Ag particle whose TEM image is displayed in the top left corner; the well defined electron diffraction pattern presents the most important reflections of cubic silver and, for each reflection, 4 spots are found indicating an internal structure due to “multiple twinned particle” (MTP) formation. The XRD powder pattern (Fig. 3) shows the Ag peaks indexed according to the Ag face centered cubic structure (JCPDS 04-0783) and a large peak at 2θ ≈ 17°; this lower angle peak is ascribed to the polymer bound to the silver particle surface according to electrophoretic mobility measurements.17 To estimate the average crystallite size, D, we analyzed the Ag peak widths at half maximum height using the Scherrer equation
 | (1) |
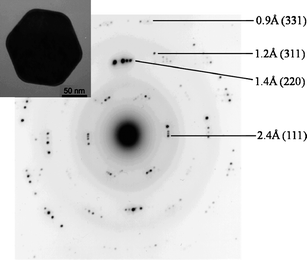 | ||
| Fig. 2 Electron diffraction pattern on a single Ag particle whose TEM image is in the inset (scale bar is 50 nm); the indexing of some Ag reflections is indicated. | ||
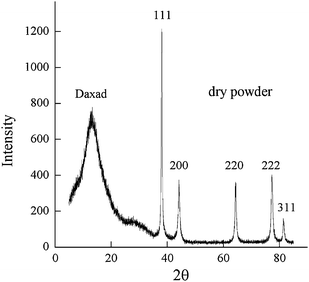 | ||
| Fig. 3 powder X-ray diffraction pattern of the precipitate dry powder. Peaks are indexed according to the Ag face centered cubic structure (JCPDS 04-0783). | ||
In order to understand the formation and aggregation mechanism of the Ag0 20 nm crystallites, in situ and time resolved SAXS measurements can provide useful qualitative and quantitative information.
An acidic aqueous solution of AgNO3 and Daxad was mixed before the addition of ascorbic acid. Time evolution of SAXS intensity before and during the reduction process is shown in Fig. 4 as a 3D plot of normalized and water-subtracted intensity versus q and time. Before the addition of ascorbic acid, the scattered intensity, due to the Ag salt + polymer background in the acidic aqueous solution, shows power law behaviour as a function of the scattering vector q. At t = t0 = 30 s we start the slow introduction of ascorbic acid; as the first micro drop of reduction agent falls in the solution mixture, the scattered intensity starts to gradually increase in the low q region indicating particle nucleation and growth, NG. In the following five minutes we detect: (i) the development of interference oscillations whose maxima and minima progressively shift to smaller q; and (ii) a change in the profile slopes that increase as a function of the time (Fig. 5).
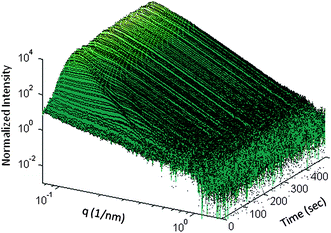 | ||
| Fig. 4 3D representation of the time evolution of the normalized SAXS intensity before and during the addition of ascorbic acid. | ||
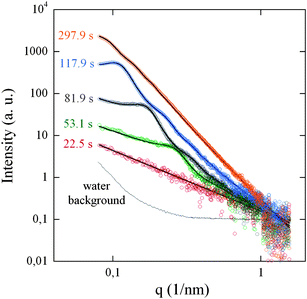 | ||
| Fig. 5 SAXS normalized profiles (open circles) in log–log scale, collected at the time intervals indicated; solid lines show the best-fitted curves calculated by eqn (2). The normalized scattering by water in the pumping system is also reported. | ||
These essential features of our experimental work are captured by assuming a physical system constituted by interacting spherules forming in aqueous solution of Ag salt and polynaphthalene sulfonate polymer, described by
| I(q) = IB(q) + IP(q) | (2) |
| IB(q) = PCqPE | (3) |
 | (4) |
takes into account the formation of N spherical primary particles with radius R; C is a constant independent of q and R and equal to γΔρ where γ is a parameter dependent on the experimental setup and Δρ is the scattering length density contrast between silver and precursors in the solution; V(R) and Φ(q,R) are the volume and the form factor of the single spherical particle, respectively. In order to account for the polydispersivity of the particles, the intensity has been integrated over a log-normal distribution of R, P(R) (see eqn (1) of the ESI†). Finally, the scattering oscillations have been modelled in the monodisperse approximation of hard spheres with radius RHS and volume fraction η calculated with the Percus–Yevick equation.44
In order to describe and understand the growth kinetics of the primary particles, we performed least squared data fitting using the trust-region-reflective algorithm45,46 and eqn (2) as model; typical fits at different selected time intervals are shown in Fig. 5 while the IB(q) and IP(q) theoretical contributions to the I(q) model are shown individually in Fig. 3 of the ESI.† The fitting procedure, allowed us to estimate (i) the PC constant and the power exponent PE of the background term IB(q); (ii) the radius RHS and volume fraction η of correlated hard spheres in the Percus–Yevick approximation, (iii) the number density N, the mean radius Rm and the dispersivity σ of the log-normal size distribution, P(R), of primary particles; since the standard for absolute calibration did not give trustful results we could not determine γ; so, intensity scale number particle N are in arbitrary units. For each parameter also the corresponding confidence interval was estimated (see Fig. 2 of the ESI†). The time dependence of these parameters with their own confidence intervals allows us to distinguish different time regions, highlighted as grey scaled areas in Fig. 6, given by t < t0, Δt1 = [t1 − t0], Δt2 = [t2 − t1], Δt3 = [t3 − t2] and t > t3, with t0 ≈ 30s, t1 ≈ 54s, t2 ≈ 106s, and t3 ≈ 260s. We also define here the instant t* = 40 s; before t*, that is during around 10 s after the introduction of the first reducing agent micro drop in the solution, the scattered intensity is still largely dominated by the background, IB(q), in most of measured q range, preventing us from estimating the particle size distribution in the fitting procedure. Thus, before t*, the SAXS intensity is related to a fractal system made of large clusters with dimension PE and size ξ with qξ ≫ 1 in the measured q range.47PE values ranging from 1 to 3 indicate mass fractal dimension; as PE exceeds 3 we have surface fractal objects and if it further increases, assuming values larger than 3, the roughness of the surface increases, resulting in the well-known Porod relation associated to smooth surface if PE becomes equal to 4. The PE values around 1.4, found before the Ag reduction process (t < t0), are consistent with the presence of large polymer fractal-like clusters in the solution.48
![Log–log time evolution of mean radius Rm and dispersivity σ (a), hard sphere radius RHS and volume fraction η in the Percus–Yevick approximation (b), PC (dots) and exponent PE (open circles) (c), ascorbic acid amount diluted in the solution and number density N (d). The darker area (t < t0) indicates the interval before the start of the reaction. In the Δt1 = [t1 − t0] range we observe the initial nucleation of liquid-like ordered clusters with sizes of about Rm = 7 nm and with distance RHS of about 24 nm one from each other. In the Δt2 = [t2 − t1] range we observe cluster growth leading to the formation of primary particles with a critical size of Rm* = 10 nm; as this critical size is reached, in the following Δt3 range, between t2 and t3 the spatial correlations among particles increase up to a critical value RHS* of about 120 nm indicating expanding shell-like structures coating and connecting primary particles. The dotted line indicates the transformation from mass fractal to surface fractal structure of the Ag–polymer template occurring at the instant at which PE becomes equal to 3; in correspondence, the critical value RHS* is defined as the limiting size of the shells. The dashed line indicates the t* time, that is the time over which the fitting procedure converges giving reliable values of parameters.](/image/article/2010/NR/c0nr00390e/c0nr00390e-f6.gif) | ||
| Fig. 6 Log–log time evolution of mean radius Rm and dispersivity σ (a), hard sphere radius RHS and volume fraction η in the Percus–Yevick approximation (b), PC (dots) and exponent PE (open circles) (c), ascorbic acid amount diluted in the solution and number density N (d). The darker area (t < t0) indicates the interval before the start of the reaction. In the Δt1 = [t1 − t0] range we observe the initial nucleation of liquid-like ordered clusters with sizes of about Rm = 7 nm and with distance RHS of about 24 nm one from each other. In the Δt2 = [t2 − t1] range we observe cluster growth leading to the formation of primary particles with a critical size of Rm* = 10 nm; as this critical size is reached, in the following Δt3 range, between t2 and t3 the spatial correlations among particles increase up to a critical value RHS* of about 120 nm indicating expanding shell-like structures coating and connecting primary particles. The dotted line indicates the transformation from mass fractal to surface fractal structure of the Ag–polymer template occurring at the instant at which PE becomes equal to 3; in correspondence, the critical value RHS* is defined as the limiting size of the shells. The dashed line indicates the t* time, that is the time over which the fitting procedure converges giving reliable values of parameters. | ||
As soon as the reduction process by ascorbic acid takes place, in the Δt1 = [t1 − t0] range, Ag–polymer ramified fractal clusters start to nucleate with the same linear rate of the addition of the ascorbic acid, as indicated in Fig. 6d by the plot of N and the ascorbic acid volume as a function of time. In the same time interval, a low-angle diffraction peak arises with a q(t*) value nearly equal to 0.28 nm−1 involving a fraction of about 30% of the total volume of clusters (Fig. 6b). This liquid-like order, covering the whole volume fraction η* with nearly constant inter-cluster distances of about 24 nm, indicates a phase separation giving fluctuating liquid ordered clusters coexisting with the remaining volume filled by random walking clusters. The formation of these liquid-like clusters (represented by the gray full circles delimited by red open circles in the nucleation picture of Fig. 7) could be consistent with the formation of liquid-like precursors typically observed in MSC33,36 and also predicted by computational simulations48,49 and theoretical studies such as the Density Functional Theory (DFT).34
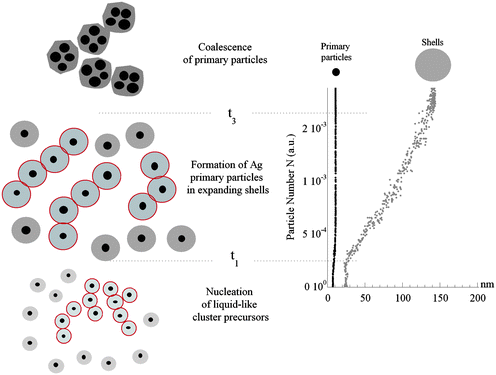 | ||
| Fig. 7 Schematic illustration of the stepwise process for the formation of silver nanocrystals. For t < t0 large ramified mass fractal objects are in the solution. At t = t0 the reduction takes place and for t < t1, we observe the nucleation of liquid-like ordered clusters (black dots in gray full circles delimited by red open circles) coexisting with random walking clusters (black dots in gray full circles). Between t1 and t3, the clusters grow up to form the cores (primary particles) of core–shell type particles. As the shell size assumes its critical value, the crossover from mass to fractal surface of template occurs, offering a signature of the coalescence of primary particles collapsing to form final colloidal particles. The particle number N as a function of the size (radius) of primary particles (black dots) and shells (gray dots) is shown in the plot (right panel). | ||
As the liquid-like order reaches its maximum volume fraction, η*, at t = t1 = 54 s, the nucleated clusters start to grow as indicated by the increasing of the mean radius, Rm(t)Δt2 = t0.45, with its standard deviation, σ(t)Δt2 = t0.8, (Fig. 6a) during the following Δt2 = [t2 − t1] = 52 s. In this range the number density N continues to increase following the linear rate of the introduced ascorbic acid volume (Fig. 6d); η remains nearly constant while the interference peaks starts to move towards lower scattering vectors q indicating the development of spatial liquid-like long range correlations, LRC, whose lengths are given by the hard sphere radius RHS in the Percus–Yevick approximation. At the end of the Δt2 range, for t = t2 = 106 s, the clusters reach their critical size of Rm* = 10 nm, their growth stops and stable primary particles are formed.
The described nucleation and growth mechanism appears to be in contrast with the classical theory by Lamer29 as well as with the recent stepwise mechanism proposed by Kimling39 and Polte.41 Indeed, in the classical theory one should observe separately a nucleation and a growth period: i.e. an initial rapid increase of the total numbers of particles that then remains constant in the following increasing of their size. This scenario close to Abecassis30 and Harada31 findings is in contrast with our data. They suggest a slow nucleation of Ag0 atoms occurring simultaneously with the primary particle growth; in other words, the primary particle growth could be here considered due to slow diffusion of Ag0 atoms. Furthermore, the increasing of RHS indicates that the NG process is assisted by the formation of a polymer–Ag network, as observed by Pong and coworkers.40 This mechanism deviates from the initial complete reduction of Au(III) observed by Kimling,39 as well as from the growth by coalescence proposed by Polte.41 It differs also from the Abecassis30 results obtained in the case of decylamine, where a burst of nucleation is observed with nearly no growth period.
In the following Δt3 = [t3 − t2] = 154 s Rm and σ do not change any more; meanwhile, the number density N, the Porod exponent PE and the correlation length RHS continue to increase. This behaviour is related to the formation of stable core–shell particles, i.e. primary particles capped in an environment where the initial ramified clusters tend to thicken in more compact and larger objects, as indicated by the increasing of the PE exponent in IB(q); we refer to this environment whose core is constituted by the capped primary particle as the shell. The shell and core sizes, given by the hard sphere radius RHS and the primary particle mean radius Rm plotted as a function of time in Fig. 6, visualize well the nucleation of clusters growing to become primary particles as stable cores in liquid like ordered expanding shells. This observed phenomenon, consisting of increasing N and RHS values while the Rm particles’ size remains constant, could be ascribed to the adsorption of the reduced Ag onto the polymer matrix. The latter forms networks of interconnected silver atoms that cover the surface of the primary particle, hindering its growth by Ag0 diffusion and causing increase of long range liquid-like correlations and shell expansion. Indeed, here the polymer background is significantly affected by the formation of Ag particles and the reduction of Ag+ ions, in contrast with the Harada31 and Sakamoto32 works where the Ag+ and Pd2+ reduction effects on the background are assumed to be relatively small. Our results appear more consistent with the scenario proposed by Pong40 where Au atoms formed in aqueous solution of sodium citrate contribute to build an extensive network of growing nanowires.
More specifically, in our case the growing of shells can be due to the Daxad ability to coordinate Ag+ ions through its sulfonic groups; it is likely that the reduction process Ag+ + e → Ag0 takes place in the proximity of the Daxad molecules, where Ag+ ions are mostly concentrated and that Daxad–Ag interactions build the fractal network surrounding the primary silver nanoparticles. Thus, in order to characterize and get a deeper insight on the polymer behaviour, we move now to study the time evolution of the AgNO3–polymer background in the solution, described by eqn (3).
As the LRC and NG go on, the power law value, PE, increases and reaches a steady value of about 3.2, as shown in Fig. 6c; we define here a like critical value RHS* of the shell size approaching its maximum at the equilibrium, indicated by the dotted line in all panels of Fig. 6; this size is reached when the Porod exponent PE assumes the critical value of PE* = 3 and a mass fractal–surface fractal transition starts, indicating that the polymer–Ag network reorganizes itself during the reduction process providing a kind of “dynamic template” in the solution. Corresponding to the mass–surface fractal transition, the shell growth stops; we suppose that these two simultaneous events could be due to a Ag–polymer reorganization inducing coalescence of Ag–polymer fragments with primary particles to form final larger Ag particles coated with polymer. This mechanism presents some analogies with the one proposed by Pong and coworkers;40 they observed nanowires built up by Au atoms and sodium citrate used as both capping and reducing agent in aqueous solutions growing up to a critical size and then fragmenting into small segments before forming final spherical particles.
Further on, the coalescence we assume here is quite different from that found by Polte,41 giving rise to particle growth; here it operates when primary particles are already formed and thus can be considered as an aggregative mechanism, rather than a growth mechanism. It suggests that the flexibility of the template modulating the nanostructure formation and morphology could provide a key feature in a scenario where different stages and steps take part in non-standard crystallization process from solution. It is known, indeed, that different organic molecules such as proteins,50 fatty acids,51 collagenous tissue matrices,52 bis-urea based surfactants,53 rearrange their structures upon interactions with inorganic ions. Our previous work,20–22 jointly to the experimental results here presented, suggests Daxad as a ductile and stable template for modeling crystalline nanostructures.
Finally, when t > t3, the system reaches its equilibrium; we stress here that by this time we added 3.25 mmol of ascorbic acid that is more than the stoichiometric quantity (3 mmol) necessary to reduce all the 6 mmol of Ag+ ions in the solution; as a consequence, the reduction process stops, as confirmed by the saturated value assumed by the number particle N, while the ascorbic acid volume continue to increase (Fig. 6d); also the correlation length RHS, and the PE exponent assume their final plateau values. At this point, a stable Ag0 colloid flows in the closed circuit at a fixed velocity in order to avoid gravity effects and particle sedimentation on the circuit walls.
After all the ascorbic acid volume was introduced in the solution, we stopped the flow; subsequently we took a sample from the colloidal dispersion and placed it in a quartz capillary; rapidly, a sedimentation of colloidal matter on the bottom of the capillary occurred; at this point we collected several X-ray diffraction pattern by placing under the X-ray beam first the precipitated colloidal substance on the bottom of the capillary and then the liquid part in the upper capillary part. The measurements were performed on the neighbour XRD beamline of Elettra42 and the patterns taken both on the colloidal and on the liquid part are shown in Fig. 8; we observe no diffraction peak along the scattering from amorphous matter in the liquid sample while the Ag 110 and 200 peaks appearing in the colloidal part, indicate that what we monitored by time resolved SAXS, was the formation of a crystalline silver colloidal dispersion. Scherrer's formula (eqn (1)) gives us a crystallite size of 17 nm that is consistent with all our results.
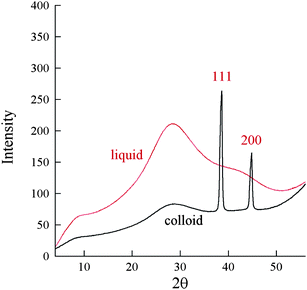 | ||
| Fig. 8 X-Ray diffraction patterns of the sample taken from the colloidal dispersion after 8 min in the liquid part and in the colloidal deposited part. | ||
To summarize, a schematic of the silver particle formation mechanism is given in Fig. 7 through the following steps: (1) liquid-like ordered cluster nucleation; (2) cluster growth and Ag0 primary particles formation in Ag–polymer shells; (3) coalescence of Ag0 primary particles. It is not clear in which of these steps the crystallization process starts and takes place; we can not provide here an experimental evidence of the time evolution of crystallization because the low concentration of Ag did not allow us to measure an appreciable in situ Wide Angle X-ray Scattering signal during the crystalline colloid formation. However, cases in which the first stages of crystallization may be due to the coalescence of large clusters rather than the classical atom-by-atom assembly are well known and reported in the literature;54,55 these cases further motivate us to consider a non standard scenario for the monitored silver colloidal crystallization.
4. Conclusions
In summary, we have used time resolved Small Angle X-ray Scattering for investigating the early stages of the formation of primary crystalline Ag0 particles by Ag+ ions reduction with ascorbic acid in an aqueous acidic solution of a polynaphthalene sulfonate polymer (Daxad). Controlling the rate of the Ag+ reduction, we have been able to distinguish nucleation, growth, and coalescence stages in different time intervals during the formation of a crystalline silver colloidal suspension. In particular, we observed a first stage of the phase separation with liquid-like cluster nucleation; a second stage where the clusters grow up to form primary particles (cores) in expanding Ag–polymer shells and a third stage where shells continue to expand up to a critical size value, bringing primary particles to increasing distances. As this critical value is reached, the system undergoes a transformation from mass fractal to surface fractal structure that could trigger the primary particle coalescence to form the final 100–150 nm sized Ag particles.The product precipitated from the colloidal dispersion has been characterized by powder X-Ray Diffraction (XRD), Selected Area Electron Diffraction (SAED) Transmission and Scanning Electron Microscopies (TEM and SEM). The particles are composed by twinned crystallites whose size of 20 nm is in excellent agreement with the size of primary particles found in SAXS data analysis. These observations offer signatures of a stepwise pathway from liquid-like Ag–Daxad precursors to the stabilization of polymer capped Ag0 particles, although where the crystallization process starts in this pathway it remains unclear.
In conclusion, the Ag0 particle fabrication via Daxad polymer templating in solution may not be obtained through simple nucleation events but might be a result of a multi-step mechanism induced by Daxad–Ag interactions; in this view, attempts to monitor the crystallization times are in progress; more specifically, we are planning in situ time resolved diffraction measurements at different polymer and AgNO3 concentrations offering a better signal-to-background ratio. Work in progress concerns also the study of the reduction process in each different stage found here, with the possibility of blocking the reaction in each different stage to understand how this influences the final product. Also useful will be to study the formation process around t3, e.g. using Ultra Small Angle Diffraction, in order to get deeper understanding about the coalescence mechanism. This could provide further and new insight in the twofold topic issue of hybrid materials fabrication and their crystallization on nanometre scale length.
5. Acknowledgment
We thank Antonello Ranieri for his technical support. The work was supported by a CNR project (RSTL087.008).6. References
- H. Bonnemann and R. M. Richards, Nanoscopic metal particles: Synthetic methods and potential applications, Eur. J. Inorg. Chem., 2001, 2455–2480 CrossRef CAS.
- J. M. Nam, C. S. Thaxton and C. A. Mirkin, Nanoparticle-based bio-bar codes for the ultrasensitive detection of proteins, Science, 2003, 301, 1884–1886 CrossRef CAS.
- A. G. Tkachenko, H. Xie, D. Coleman, W. Glomm, J. Ryan, M. F. Anderson, S. Franzen and D. L. Feldheim, Multifunctional gold nanoparticle–peptide complexes for nuclear targeting, J. Am. Chem. Soc., 2003, 125, 4700–4701 CrossRef CAS.
- L. R. Hirsch, R. J. Stafford, J. A. Bankson, S. R. Sershen, B. Rivera, R. E. Price, J. D. Hazle, N. J. Halas and J. L. West, Nanoshell-mediated near-infrared thermal therapy of tumors under magnetic resonance guidance, Proc. Natl. Acad. Sci. U. S. A., 2003, 100, 13549–13554 CrossRef CAS.
- L. M. Liz-Marzan, Nanometals: Formation and color, Mater. Today, 2004, 7, 26–31 CrossRef.
- P. Mulvaney, Surface plasmon spectroscopy of nanosized metal particles, Langmuir, 1996, 12, 788–800 CrossRef CAS.
- C. Burda, X. Chen, R. Narayanan and M. A. El-Sayed, Chemistry and properties of nanocrystals of different shapes, Chem. Rev., 2005, 105, 1025–1102 CrossRef CAS.
- Y. Y. Yu, S. S. Chang, C. L. Lee and C. R. C. Wang, Gold nanorods: electrochemical synthesis and optical properties, J. Phys. Chem. B, 1997, 101, 6661–6664 CrossRef CAS.
- G. Canizal, J. A. Ascencio, J. Gardea-Torresday and M. Jose-Yacaman, Multiple twinned gold nanorods grown by bio-reduction techniques, J. Nanopart. Res., 2001, 3, 475–481 CrossRef CAS.
- N. R. Jana, L. Gearheart and C. J. Murphy, Seed-mediated growth approach for shape-controlled synthesis of spheroidal and rod-like gold nanoparticles using a surfactant template, Adv. Mater., 2001, 13, 1389–1393 CrossRef CAS.
- N. R. Jana, L. Gearheart and C. J. Murphy, Wet chemical synthesis of high aspect ratio cylindrical gold nanorods, J. Phys. Chem. B, 2001, 105, 4065–4067 CrossRef CAS.
- Y. Sun, B. Mayers, T. Herricks and Y. Xia, Polyol synthesis of uniform silver nanowires: A plausible growth mechanism and the supporting evidence, Nano Lett., 2003, 3, 955–960 CrossRef CAS.
- I. Lisiecki, A. Filankembo, H. Sack-Kongehl, K. Weiss, M. P. Pileni and J. Urban, Structural investigations of copper nanorods by high-resolution TEM, Phys. Rev. B: Condens. Matter Mater. Phys., 2000, 61, 4968–4974 CrossRef.
- Y. Zhou, S. H. Yu, X. P. Cui, C. Y. Wang and Z. Y. Chen, Formation of silver nanowires by a novel solid–liquid phase arc discharge method, Chem. Mater., 1999, 11, 545–546 CrossRef CAS.
- Jae Hong Lim and Jae Sung Lee, A statistical design and analysis illustrating the interactions between key experimental factors for the synthesis of silver nanoparticles, Colloids Surf., A, 2008, 322, 155 CrossRef.
- A. L. Gonzáles, Cecilia Noguez, G. P. Ortiz and G. Rodriguez-Gattorno, Optical absorbance of colloidal suspensions of silver polyhedral nanoparticles, J. Phys. Chem. B, 2000, 62, 2681.
- Mark W. Knight, Nathaniel K. Grady, Rizia Bardhan, Feng Hao, Peter Nordlander and Naomi J. Halas, Nanoparticle-mediated coupling of light into a nanowire, Nano Lett., 2007, 7(8), 2346–2350 CrossRef CAS.
- Wanzhong Zhang, Xueliang Qiao and Jianguo Chen, Synthesis of silver nanoparticles—Effects of concerned parameters in water/oil microemulsion, Mater. Sci. Eng., B, 2007, 142, 1–15 CrossRef CAS.
- Encai Hao, Lance Kelly, Joseph T. Hupp and George C. Schatz, Synthesis of Silver Nanosdisks using polystyrene as templates, J. Am. Chem. Soc., 2002, 124, 15182–15183 CrossRef CAS.
- Ivan Sondi, Dan V. Goia and Egon Matijevic, Preparation of highly concentrated stable dispersions of uniform silver nanoparticles, J. Colloid Interface Sci., 2003, 260, 75–81 CrossRef CAS.
- L. Suber, I. Sondi, E. Matijević and Dan V. Goia, Preparation and the mechanism of formation of silver particles of different morphologies in homogeneous solutions, J. Colloid Interface Sci., 2005, 288, 489–495 CrossRef CAS.
- L. Suber, G. Campi, A. Pifferi, P. Andreozzi, C. La Mesa, H. Amenitsch, R. Cocco and W. R. Plunkett, Polymer-assisted synthesis of two-dimensional silver meso-structures, J. Phys. Chem. C, 2009, 113, 11198–11203 CrossRef CAS.
- M. Green, Organometallic based strategies for metal nanocrystal synthesis, Chem. Commun., 2005, 3002–3011 RSC.
- C. J. Murphy, T. K. Sau, A. M. Gole, C. J. Orendorff, J. Gao, L. Gou, S. E. Hunyadi and T. Li, Anisotropic ,etal nanoparticles: Synthesis, assembly, and optical applications, J. Phys. Chem. B, 2005, 109, 13857–13870 CrossRef CAS.
- B. Wiley, Y. Sun and Y. Xia, polyol Synthesis of silver nanostructures: control of product morphology with Fe(II) or Fe(II) species, Langmuir, 2005, 21, 8077–8080 CrossRef CAS.
- J.-W. Kim, R. J. Larsen and D. A. Weitz, Uniform nonspherical colloidal particles with tunable shape, Adv. Mater., 2007, 19, 2005–2009 CrossRef CAS.
- M. J. Hollamby, J. Eastoe, A. Chemelli, O. Glatter, S. Rogers, R. K. Heena and I. Grillo, Separation and purification of nanoparticles in a single step, Langmuir, 2010, 26, 6989–6994 CrossRef CAS.
- V. M. Fokin, N. S. Yuritsyn, E. D. Zanotto, in Nucleation Theory and Applications, ed. J. W. P. Schmelzer, Wiley-VCH Verlag GmbH & Co. KGaA, Weinheim, Germany, 2005, p 74 Search PubMed.
- V. K. Lamer, Nucleation in phase transitions, Ind. Eng. Chem., 1952, 44, 1270 CrossRef CAS.
- B. Abécassis, F. Testard, O. Spalla and P. Barboux, Probing in situ the nucleation and growth of gold nanoparticles by small-angle X-ray scattering, Nano Lett., 2007, 7, 1723 CrossRef CAS.
- M. Harada, K. Saijo, N. Sakamoto and K. J. Ito, Characterization of water/AOT/benzene microemulsions during photoreduction to produce silver particles, J. Colloid Interface Sci., 2010, 343, 423 CrossRef CAS.
- Naoki Sakamoto, Masafumi Harada and Takeji Hashimoto, In situ and time-resolved SAXS studies of Pd nanoparticle formation in a template of block copolymer microdomain structures, Macromolecules, 2006, 39, 1116–1124 CrossRef CAS.
- T. H. Zhang and X. Y. Liu, Multistep Crystal Nucleation: A Kinetic Study Based on Colloidal Crystallization, J. Phys. Chem. B, 2007, 111, 14001–14005 CrossRef CAS.
- V. Talanquer and D. W. Oxtoby, Crystal nucleation in the presence of a metastable critical point, J. Chem. Phys., 1998, 109, 223 CrossRef CAS.
- C. Haas and J. Drenth, The interface between a protein crystal and an aqueous solution and its effects on nucleation and crystal growth, J. Phys. Chem. B, 2000, 104, 368 CrossRef CAS.
- Laurie B. Gower, Biomimetic model systems for investigating the amorphous precursor pathway and its role in biomineralization, Chem. Rev., 2008, 108, 4551–4627 CrossRef CAS.
- P. G. Vekilov, Dense liquid precursor for the nucleation of ordered solid phases from solution, Cryst. Growth Des., 2004, 4, 671 CrossRef CAS.
- O. Galkin and P. G. Vekilov, Are nucleation kinetics of protein crystals similar to those of liquid droplets?, J. Am. Chem. Soc., 2000, 122, 156–163 CrossRef CAS.
- J. Kimling, M. Maier, B. Okenve, V. Kotaidis, H. Ballot and A. Plech, Turkevich Method for gold nanoparticle synthesis revisited, J. Phys. Chem. B, 2006, 110, 15700 CrossRef CAS.
- B. K. Pong, H. I. Elim, J. X. Chong, W. Ji, B. L. Trout and J. Y. Lee, New insights on the nanoparticle growth mechanism in the citrate reduction of gold(III) salt: formation of the Au nanowire intermediate and its nonlinear optical properties, J. Phys. Chem. C, 2007, 111, 6281 CrossRef CAS.
- J. Polte, T. T. Ahner, F. Delissen, S. Sokolov, F. Emmerling, A. F. Thünemann and R. Kraehnert, Mechanism of gold nanoparticle formation in the classical citrate synthesis method derived from coupled in situ XANES and SAXS evaluation, J. Am. Chem. Soc., 2010, 132, 1296 CrossRef CAS.
- S. Bernstorf, E. Busetto, C. Gramaccioni, A. Lausi, L. Olivi, F. Zanini, A. Savoia, M. Colapietro, G. Portalone, M. Camalli, A. Pifferi, R. Spagna, L. Barba and A. Cassetta, The macromolecular crystallographic beamline at ELETTRA, Rev. Sci. Instrum., 1995, 66(2), 1661–1664 CrossRef.
- H. Amenitsch, S. Bernstorff, M. Kriechbaum, D. Lombardo, H. Mio, M. Rappolt and P. Laggner, Performance and first results of the ELETTRA high-flux beamline for small-angle X-ray scattering, J. Appl. Crystallogr., 1997, 30, 872–876 CrossRef CAS.
- J. K. Percus and G. J. Yevick, Phys. Rev., 1958, 110, 1 CrossRef.
- T. F. Coleman and Y. Li, An interior, trust region approach for nonlinear minimization subject to bounds, SIAM J. Optim., 1996, 6, 418–445 CrossRef.
- T. F. Coleman and Y. Li, On the convergence of reflective newton methods for large-scale nonlinear minimization subject to bounds, Mathematical Programming, 1994, 67(1–3), 189–224 CrossRef.
- T. Freltoft, J. K. Kjems and S. K. Sinha, Power law correlations and finite size effects in silica particles aggregates studied small-angle neutron scattering, Phys. Rev. B: Condens. Matter, 1986, 33, 269–275 CrossRef CAS.
- (a) R. Jullien & R. Botet, Aggregation and Fractal Aggregates, Singapore World Scientific Co Pte Ltd, 1987 Search PubMed; (b) A. Gavezzotti, Molecular aggregation of acetic acid in a carbon tetrachloride solution: a molecular dynamics study with a view to crystal nucleation, Chem.–Eur. J., 1999, 5, 567–576 CrossRef CAS.
- K. Soga, M. Geoffrey, R. John and R. C. Ball, Metastable states and the kinetics of colloid phase separation, J. Chem. Phys., 1999, 110, 2280–2288 CrossRef CAS.
- S. Nielbo, J. K. Thomsen, J. H. Graversen, P. H. Jensen, M. Etzerodt, F. M. Poulsen and H. C. Thogersen, Structure of the plasminogen kringle 4 binding calcium-free form of the c-type lectin-like domain of tetranectin, Biochemistry, 2004, 43, 8636–8643 CrossRef CAS.
- E. DiMasi, M. J. Olszta, V. M. Patel and L. B. Gower, When is template directed mineralization really template directed?, CrystEngComm, 2003, 5, 346–350 RSC.
- E. Beniash, W. Traub, A. Veis and S. Weiner, A transmission electron microscope study using vitrified ice sections of predentin: structural changes in the dentin collagenous matrix prior to mineralization, J. Struct. Biol., 2000, 132, 212–225 CrossRef CAS.
- E. DiMasi, Seo-Young Kwak, Benoıt P. Pichon and Nico A. J. M. Sommerdijk, Structural adaptability in an organic template for CaCO3 mineralization, CrystEngComm, 2007, 9, 1192 RSC.
- J. F. Banfield, S. A. Welch, H. Zhang, T. T. Ebert and R. L. Penn, Aggregation-based crystal growth and microstructure development in natural iron oxyhydroxide biomineralization products, Science, 2000, 289, 751–754 CrossRef CAS.
- G. Furrer, B. L. Phillips, K.-U. Ulrich, R. Pothig and W. H. Casey, The origin of aluminium flocs in polluted streams, Science, 2002, 297, 2245–2247 CrossRef CAS.
Footnote |
| † Electronic supplementary information (ESI) available: Log-Log plot of integrated intensity vs. time (Fig. 1) and further details about the fitting model and procedure (Fig. 2, Fig. 3, Fig. 4). See DOI: 10.1039/c0nr00390e |
| This journal is © The Royal Society of Chemistry 2010 |