Gel–carbon nanotube materials: the relationship between nanotube network connectivity and conductivity
Naratip
Songmee
ab,
Pisith
Singjai
b and
Marc
in het Panhuis
*a
aSoft Materials Group, School of Chemistry, University of Wollongong, Wollongong, Australia. E-mail: panhuis@uow.edu.au; Fax: +61 24221 4287; Tel: +61 24221 3155
bNanomaterials Research Unit, Department of Physics and Materials Science, Faculty of Science, Chiang Mai University, Chiang Mai, 50200, Thailand
First published on 3rd July 2010
Abstract
The electrical resistance of carbon nanotube networks (NNs) prepared from combinations of gellan gum, xanthan gum, Triton X-100, SWNT and MWNT is reported. It is demonstrated that the NN conductivity can be obtained by analysing the resistance of two overlapping NN as a function of their overlap distance. Unexpectedly, the connectivity between two overlapping NN was found to scale with the electrical conductivity over 4 orders of magnitude. Insights into the dependence of inter-NN contact on applied pressure were obtained.
Introduction
It is well-known that the electrical properties of individual carbon nanotubes (CNTs) are superior to those of carbon nanotube networks (NNs).1–6 The reported conductivity values for individual CNTs are in excess of 8 × 10⁶ S m−1.2,3 In contrast, typical conductivity values for NN are below 104 S m−1, although this can be improved through chemical treatment.5,6 Single CNT device applications dictate fabrication of individual single-walled carbon nanotubes (SWNTs) with specific electrical properties. For example, field effect transistor devices require semi-conducting SWNT, whereas interconnects require metallic SWNT.7,8 Reliable fabrication of individual SWNT remains an issue due to the inability to control chirality and therefore electronic properties during synthesis. In contrast, NNs can be reproducibly fabricated using various methods involving vacuum filtration, evaporative casting, inkjet printing, spraying and spin coating of CNT dispersions as well as direct growth methods.9–17 The advantage of a NN is that the influence of an individual CNT's chirality is minimised, with the network containing both semi-conducting and metallic pathways. Hence, NN can serve as either semi-conducting channels or conducting sheets.16,18–20 These electrical properties combined with their flexible nature make NN ideal for a number of potential applications such as solar cells, displays, touch screens, sensors and electronic paper.15,17The dispersability of CNTs in most common solvents is rather limited, but it is well-known that this can be improved through the use of dispersants such as surfactants and polymers.4 Recently, it has been demonstrated that gel forming biopolymers such as gum arabic, gellan gum (GG), xanthan gum (XG) and the carrageenans are efficient CNT stabilisers.21–26
GG and XG are linear anionic polysaccharides produced in high yields by the Sphingomonas elodea and Xanthomonas campestris bacteria, respectively.27–29 They are US FDA and European Union (E415 and E418) approved for food usage, and have found wide application as multi-functional gelling, stabilising and suspending agents. In addition, these polymers are also in use as encapsulating agents and active ingredients in drug delivery applications and are emerging as a material for the construction of three-dimensional scaffolds for tissue engineering applications.30,31
It has been demonstrated that GG and XG can form transparent CNT composite gels that can be used in the preparation of NN through inkjet printing and evaporative casting.21,26 Percolation studies revealed that a MWNT concentration of 1.3% by weight is required to achieve an electrically conducting NN in a gellan gum hydrogel.23 The resulting nanotube networks consist of pathways dominated by intra-CNT and CNT–polymer–CNT junctions, with the latter junction acting as a tunnelling barrier.21,23 It has been shown that for NN the level of graphitisation, type of nanotubes (SWNT and MWNT) and network morphology are important factors determining NN conductivity.32 However, the most important factor determining the transport through a nanotube network is the resistance of the NN junctions.15,32
In this paper, we investigate the electrical resistance of NN prepared by vacuum filtration and evaporative casting of gellan gum-SWNT, gellan gum-MWNT, xanthan gum-SWNT, xanthan gum-MWNT and Triton X-100-SWNT dispersions. We demonstrate that the NN conductivity can be obtained by analysing the resistance of two overlapping NN as a function of their overlap distance (under constant applied pressure). Unexpectedly, the connectivity between two overlapping NN was found to scale with the electrical conductivity over 4 orders of magnitude. Moreover, we show that insights into the dependence of inter-NN contact on applied pressure can be obtained through resistance measurements as a function of applied pressure on two overlapping NN (at a constant overlap distance).
Experimental
Dispersion preparation
Purified single-walled carbon nanotubes (SWNTs) produced by the high-pressure decomposition of carbon monoxide (HiPCO) process and multi-walled carbon nanotubes (MWNTs) produced by catalytic chemical vapour deposition (CVD) were obtained from Carbon Nanotechnologies, Inc. (lot # P0348) and Nanocyl S.A. (lot # NFL60). Gellan gum (GG, low acyl, molecular weight, Mw ≈ 2 to 3 × 10⁵ Da, lot # 7C9228A) and xanthan gum (XG, Mw ≈ 1 × 10⁶ Da, lot # 9D4608K) were gifts from CP Kelco. Triton X-100 (TX, Mw ≈ 625 Da) was obtained from Sigma Aldrich. All materials were used as received.Solutions of GG (1.0% w/v) and XG (0.5% and 1.0% w/v) in Milli-Q water (18 MΩ cm) were prepared by adding 100 mg (GG) and 50 mg (XG) to 10 mL of water and stirring for 2 hours at 70 °C, respectively. Solutions of TX (1.0% w/v) were prepared by dissolving TX in water at 21 °C.
Homogeneous CNT dispersions were prepared by the probe sonication process in a Branson 450 (400 W, Ultrasonics Corp.) digital sonicator horn for up to 24 min in a pulse mode (0.5 s on/off). Different amounts and types of CNTs were dispersed in various solutions as shown in Table 1. For example, “XG05-MW005” indicates a typical dispersion used for evaporative casting prepared by dispersing MWNT (0.05% w/v) in XG solution (20 mL, 0.5% w/v). Whereas “TX1-SW00375” indicates a typical dispersion used for vacuum filtration prepared by dispersing SWNT (0.1% w/v) in a TX solution (30 mL, 1.0% w/v). The resulting dispersion is then combined with 50 mL TX solution (1.0% w/v) and sonicated for 3 min in an ultrasonic bath (Unisonics). The resulting SWNT concentration in the dispersion is 0.0375% w/v.
| NN sample | Dispersion | σ/S m−1 | R C/kΩ | σ ov/S m−1 | R 12/kΩ |
|---|---|---|---|---|---|
| E1 | GG1-MW005 | 20.0 ± 3.0 | 0.956 | 24.7 ± 4.5 | 22.1 |
| E2 | GG1-MW01 | 110 ± 10 | 1.4 | 87 ± 10 | 2.78 |
| E3 | XG1-MW01 | 2.07 ± 0.14 | 10.8 | 2.65 ± 0.18 | 43.9 |
| E4 | XG05-MW005 | 1.46 ± 0.11 | 1.15 | 4.0 ± 0.3 | 90.4 |
| E5 | XG05-SW005 | 0.96 ± 0.05 | 3.82 | 0.93 ± 0.05 | 564 |
| B1 | XG03-SW003 | 357 ± 29 | 0.250 | 621 ± 50 | 0.055 |
| B2 | GG1-SW00375 | 386 ± 40 | 0.286 | 200 ± 10 | 0.599 |
| B3 | TX1-SW00375 | 10![[thin space (1/6-em)]](https://www.rsc.org/images/entities/char_2009.gif) 155 ± 476 155 ± 476 |
0.251 | 15152 ± 172 |
0.006 |
| E2 + B3 | — | — | — | 36 ± 18 | 11.3 |
Preparation of NN by evaporative casting
Five NNs (E1–E5, Table 1) were prepared by evaporative casting of CNT dispersions onto plastic substrates. 5 mL of dispersion were injected into the base of a cylindrical plastic container (diameter ≈ 5.5 cm) and dried at 21 °C for 24 hours. The films were then peeled off the substrate to yield uniform free-standing NN.Preparation of NN by vacuum filtration
Three NNs (B1–B3, Table 1) were prepared by vacuum filtration of GG-SWNT, XG-SWNT and TX-SWNT dispersions through a 0.45 µm nylon membrane filter (Micro Filtration Systems) housed in an Aldrich glass filtration unit, and using a Vacuubrand CVC2 pump that typically operated between 30 and 40 mbar. The tops of the filtration units were covered with film to prevent evaporative losses during the filtration process, which typically took approximately 1 day. Once a dispersion had been filtered, the resulting NN (buckypaper) was washed with 250 mL of Milli-Q water followed by 10 mL of methanol (99.8%, Merck) whilst still in the filtration unit. After washing, the damp buckypaper was placed between absorbent paper sheets and allowed to dry further overnight. The dry buckypaper (diameter 3.7 cm) was then carefully peeled away from the underlying commercial membrane filter.Characterisation techniques
Current (I)–voltage (V) characteristics were determined using an in-house designed environmental chamber interfaced with a waveform generator (Agilent 33220A) and a digital multimeter (Agilent 34410A) under controlled ambient conditions in air (21 °C, 45% relative humidity, RH).For resistance measurements as a function of length, NNs were cut into strips of 0.5 cm in width and lengths of up to 3.0 cm and contacted with conducting silver paint and copper electrodes. I–V measurements were made as a function of NN length, by cutting the end off the strip, contacting with silver/copper and re-measuring the I–V characteristics and repeating. Film thicknesses were determined using a Mitutoyo digital micrometre.
Resistance measurements for two overlapping NN were carried out by cutting two NN into strips (width = 0.5 cm, length = 2.0 cm), followed by contacting on one side with silver paint and copper electrodes. The NN samples were then overlapped at a particular distance (under a constant applied pressure to the overlap area) and measuring the I–V characteristics. The resistance was measured as a function of the overlap distance, by changing the overlap distance, applying constant pressure to the overlap area and re-measuring the I–V characteristics and repeating. Film thicknesses were determined using a Mitutoyo digital micrometre.
Resistance measurements as a function of pressure (2000 to 140000 N m−2) were carried out on two overlapping NN at a constant overlap distance of 1.0 cm. I–V measurements were made as a function of pressure, by changing the pressure, re-measuring the I–V characteristics and repeating.
Scanning electron microscopy (SEM) images were obtained using a JEOL field emission-SEM (JSM-6335F).
Results and discussion
Resistance as a function of NN length
Eight carbon nanotube networks (NNs, Table 1) were formed by evaporative casting and vacuum filtration of GG-SWNT, GG-MWNT, XG-SWNT, XG-MWNT and TX-SWNT dispersions.The current–voltage (I–V) characteristics of these NNs were investigated under controlled ambient conditions (21 °C, 45% RH). All films exhibited linear I–V characteristics, which indicate Ohmic behaviour. These were used to calculate the electrical resistances. However, the resulting values represent the total resistance (RT) which is equal to the sum of the NN resistance (RS) and the electrode–NN contact resistance (RC):
| RT = RS + RC. | (1) |
Previously, it has been shown that RT scales linearly with sample length (l) for a wide variety of NN according to:20,21
 | (2) |
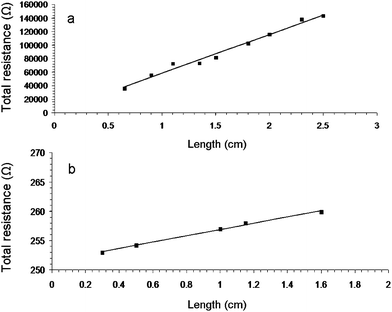 | ||
| Fig. 1 Resistance versus length for typical carbon nanotube networks E4 (a) and B3 (b) prepared by evaporative casting and vacuum filtration of XG-MWNT and TX-HiPco SWNT dispersions, respectively. The straight lines are fits to eqn (2). | ||
Table 1 shows that the conductivity values of buckypaper NN (B1–B3) are higher compared to those for NN prepared by evaporative casting. For example, the σ and RC values of a xanthan gum buckypaper (B1) are 357 ± 29 S m−1 and 250 Ω, respectively. Although this is a low conductivity value for buckypapers,6,20 it is in agreement with our recently reported values for buckypapers prepared using biopolymer dispersants.22 In comparison, the conductivity of a xanthan gum-SWNT NN prepared by evaporative casting (E5) is almost 3 orders of magnitude smaller (0.96 ± 0.05 S cm−1), while the contact resistance is more than an order of magnitude larger (3820 Ω).
The likeness in CNT loading fraction (9.1%) of NN E2–E5 allows a comparison of the electrical properties between biopolymer dispersants and CNTs. Using XG as dispersant for MWNT results in NN exhibiting a lower conductivity compared to using GG as dispersant, i.e.σ = 2.07 ± 0.14 S m−1 (E3) vs.σ = 110 ± 10 S m−1 (E2). A comparison between NN E4 and E5 shows that at the same CNT loading fraction NN with SWNT exhibit a lower conductivity compared to the MWNT NN.
The similarity in RC values observed for the three buckypapers B1–B3 indicates that the minimum obtained NN–electrode contact resistance of our experimental setup is approximately 250 Ω. The larger RC values exhibited for the samples prepared by evaporative casting suggest that something is impeding connectivity between NN and electrodes. Fig. 2 shows that there is a significant difference in surface morphology between the two types of NNs. The difference in morphology can be attributed to the extensive washing procedure during vacuum filtration, which removes dispersant. The NN is clearly visible in the buckypaper sample, but almost entirely covered by biopolymer in the sample prepared by evaporative casting.
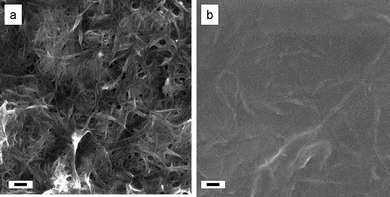 | ||
| Fig. 2 Scanning electron microscopy images of carbon nanotube networks B1 (a) and E5 (b) prepared by vacuum filtration and evaporative casting of XG-HiPco SWNT dispersions, respectively. Scale bars indicate 100 nm. | ||
We have previously shown that biopolymers such as gellan gum act as a tunnelling barrier blocking transport in electrical pathways.21,23 Tunneling barriers can affect both sample and contact resistance. It is well-known that the pathways through a NN are dominated by inter-nanotube junctions, while in recent work we demonstrated that for biopolymers such as gellan gum there are also additional pathways dominated by nanotube–biopolymer–nanotube junctions.21 There we reported that under ambient conditions these additional pathways are blocked due to GG acting as a tunnelling barrier. Therefore it can be assumed that there are two types of pathways between NN and electrode: (1) CNT–electrode and (2) CNT–biopolymer–electrode connections. It is suggested that the higher RC values observed for samples prepared by evaporative casting originate from the biopolymer acting as insulating layer, and hence impede the connectivity between NN and electrode. This indicates that both the conductivity and contact resistance are influenced by the NN connectivity. However, the data in Table 2 show that connectivity cannot be estimated through a comparison of σ and RC values. The RC values of NN B1 and B3 are similar which suggest that the connectivity between NN and electrodes is not impeded, but this is contradicted by their σ values which vary by almost two orders of magnitude.
| NN sample | R 120/kΩ | t |
|---|---|---|
| E1 | 90.5 | −0.3036 |
| E2 | 12.5 | −0.2077 |
| E4 | 231 | −0.1403 |
| E5 | 942 | −0.0324 |
| B1 | 0.207 | −0.0966 |
| B3 | 0.0144 | −0.0988 |
Resistance of overlapping NN
A more detailed analysis of NN connectivity can be obtained by evaluating the resistance of two overlapping NN (lengths l1 and l2, thickness t1 and t2, and width w) which are contacted on one side with electrodes, and overlap by a distance (lov) as shown in Scheme 1.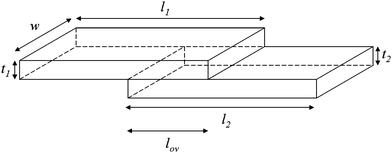 | ||
| Scheme 1 | ||
Using eqn (1) it can be shown that the total electrical resistance of this arrangement is as follows:
| RT = R1 + R2 + R12 + RC1 + RC2, | (3) |
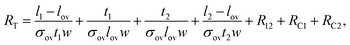 | (4) |
as described by
 | (5) |
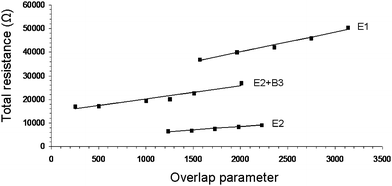 | ||
| Fig. 3 Resistance as a function of the overlap parameter for typical carbon nanotube networks (NN) under constant applied pressure. E1, E2 and E2 + B3 refer to NN compositions as listed in Table 1. The straight lines are fits to eqn (5). | ||
The overlap parameter is a dimensionless number, and is indicative of the overlapped area. The slope of the straight line fits to eqn (5) is used to calculate σov, while the intercept with the y-axis yields R12 + RC1 + RC2. The latter values, RC1 and RC2, can be obtained from the RC values obtained from the RTvs.l measurements discussed in the previous section. Note: RC (NN1) = 2RC1 and RC (NN2) = 2RC2, as RC is the contact resistance of a NN contacted on both sides with electrodes, whereas RC1 and RC2 refer to the values of two overlapping NN contacted on one side.
Table 1 shows that there is good agreement between the conductivity values calculated using eqn (2) and (5). This demonstrates that the use of overlapping NNs is a viable method for evaluating the electrical conductivity of conducting samples. In addition, our method can be used to calculate the NN1–NN2 contact resistance as well as to analyse the effects of varying pressure on the resistance (discussed in the next section).
In the previous section we showed that, although the RC values exhibited for samples B1–B3 were similar, their conductivity values varied over 2 orders of magnitude. The difference in the NN1–NN2 contact resistance values of B1 (R12 = 55 Ω), B2 (R12 = 599 Ω) and B3 (R12 = 6 Ω) can be used to explain the difference in the observed conductivity values. R12 is a measure of inter-NN pathways, i.e. the connectivity between NN1 and NN2. This parameter may also be seen as a measure of the pathways within a NN. After all, the highest conductivity will be observed for those NNs with the lowest CNT–CNT junction resistance. It is clear from Table 1 that the magnitude of the conductivity is directly related to the magnitude of the NN1–NN2 contact resistance. For example, the σ and R12 value of E5 are 4 orders of magnitude lower compared to those of B3.
Fig. 4 shows the conductivity versus NN1–NN2 contact resistance under constant applied pressure, which scales according to
| σ = σCRm12, | (6) |
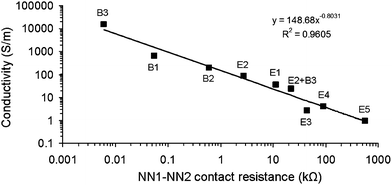 | ||
| Fig. 4 Conductivity as a function of NN1–NN2 contact resistance (R12) for overlapping carbon nanotube networks under constant applied pressure. E1–E5, B1–B3 and E2 + B3 refer to NN compositions as listed in Table 1. The line is a fit to eqn (6). | ||
Resistance as a function of applied pressure
All resistance measurements in the previous section were carried out under a constant applied pressure to the overlap area, while varying the overlap parameter. This allowed us to demonstrate that m is an inherent NN parameter. However, m does not give us information about the dependence of inter-NN contact resistance on pressure in the overlap region. A way to measure this is to evaluate the effect of pressure on the NN1–NN2 contact resistance by varying the applied pressure on the overlap area, while keeping the overlap parameter OP constant as shown in Fig. 5. As the pressure is applied only to the overlap area, and not to the NN1 electrode and the NN2 electrode contacts, eqn (5) can be employed to convert RT values into R12 values (Fig. 5). The results can be fitted to| R12 = R120Pt, | (7) |
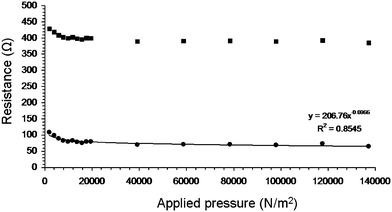 | ||
| Fig. 5 Resistance as function of applied pressure for carbon nanotube network B1 for a fixed overlap length of 1.0 cm. Total resistance and NN1–NN2 contact resistance values are indicated by squares and circles, respectively. The line is a fit to eqn (7). | ||
R 120 and t are hereafter referred to as the NN1–NN2 contact resistance in the absence of applied pressure and the pressure coefficient, respectively. The latter is indicative of the dependence of inter-NN contact on pressure (see Table 2).
Fig. 6 shows that t is not an inherent NN parameter, i.e. it does not scale with the conductivity. Nevertheless, it does provide us with an insight into the connectivity between the overlapping NNs. Low t values are observed for those samples (E4, E5, B1 and B3) exhibiting low and high R120 values. This indicates that increasing pressure does not result in improvement of the conductivity. The reasons behind this similar behaviour are different. Low R120 values, as observed for samples B1 and B3 (R120 < 0.2 kΩ), indicate that there is already good connectivity between the overlapping NNs. Hence, increasing the pressure does little to improve the number of conducting pathways. High resistance values, as observed for samples E4 and E5 (R120 > 200 kΩ), suggest that the contact between NN1 and NN2 is highly resistive as a result of a near complete coverage of the nanotubes with dispersant (see also Fig. 2) and increasing the applied pressure has little effect.
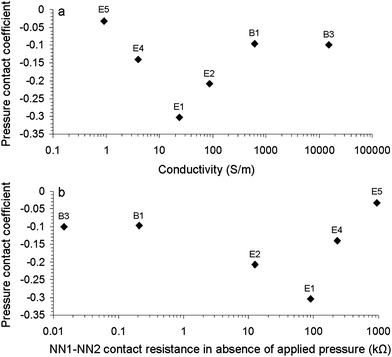 | ||
| Fig. 6 Pressure coefficient as a function of (a) overall conductivity (σov) and (b) NN1–NN2 contact resistance in the absence of applied pressure (R120) for selected carbon nanotube networks. E1, E2, E4, E5, B1 and B3 refer to NN compositions as listed in Table 1. | ||
NNs with higher t values (E1 and E2) exhibited for resistances ranging from 10 to 200 kΩ displayed a larger dependence on the applied pressure. This is likely to be related to the degree of CNT coverage by the dispersant, i.e. applying more pressure to a network consisting of partially covered CNTs will result in an increase in the number of conducting pathways. These results indicate that in order to reduce R12 by 50% for E1 requires a 10-fold increase in applied pressure, whereas for B1 a 1100-fold increase is needed.
Conclusions
The conductivity behaviour of eight carbon nanotube networks prepared using evaporative casting and vacuum filtration of HiPCO SWNT and CVD MWNT dispersed in gellan gum, xanthan gum and Triton X-100 solutions has been investigated. Resistance measurements as a function of length showed that both conductivity and electrode–NN contact resistance are influenced by the NN connectivity. Paradoxically, contact resistance values for the three NNs (samples B1–B3) prepared by vacuum filtration suggested near perfect connectivity even though their conductivity values varied by almost two orders of magnitude. Hence, we inferred that it is not possible to establish a measure of connectivity through a comparison of σ and RC.It was demonstrated that evaluating the resistance of two overlapping NNs as a function of the overlap distance (under constant applied pressure) is a viable method for calculating the electrical conductivity of NNs. Furthermore, we showed that this method can be used to calculate the connectivity between overlapping NN as well as to analyse the effects of varying pressure on connectivity. Using this approach we were able to show that the connectivity (NN1–NN2 contact resistance at constant pressure) is inversely proportional with the NN conductivity and can be fitted to a power law with exponent −0.8031. This is surprising as it appears to apply to all our NN irrespective of their nanotube type, fabrication method and utilised dispersant.
Finally, it was shown that insights into the dependence of inter-NN contact on applied pressure could be obtained through resistance measurements as a function of applied pressure on two overlapping NNs at a constant overlap distance. The connectivity as a function of applied pressure for each of the eight different NNs could be fitted to a power law. In this instance, the power law exponent t did not scale with conductivity, but did provide us with insights into NN connectivity. Low t values were observed for samples with low (<0.2 kΩ) and high (>200 kΩ) NN–NN resistance.
These observations lead us to suggest that increasing pressure does little to improve conductivity if there is either already good connectivity or highly resistive contact between the overlapping NNs. Contrary, applying more pressure to NNs with higher t values observed for NN with mid-range connectivity values (10–200 kΩ) should result in an increase in the number of conducting pathways. This work contributes to characterisation and understanding of gel–carbon nanotube materials.
Acknowledgements
This work was funded by the Australian Research Council (ARC), ARC Future Fellowship (M. in het Panhuis), and the University of Wollongong. N. Songmee gratefully acknowledges support from the Commission on Higher Education (Thailand) for a PhD scholarship. C. J. Ferris, L. J. Sweetman, J. A. Boge, L. Stevens and S. F. Ralph (all University of Wollongong), P. Jackson and M. Collins (both CP Kelco) are thanked for technical assistance and provision of materials.Notes and references
- S. J. Tans, A. R. M. Verschueren and C. Dekker, Nature, 1998, 393, 49–52 CrossRef CAS.
- D. Mann, A. Javey, J. Kong, Q. Wang and H. Dai, Nano Lett., 2003, 3, 1541–1544 CrossRef CAS.
- C. T. White and T. N. Todorov, Nature, 1999, 393, 240–242.
- M. in het Panhuis, J. Mater. Chem., 2006, 16, 3598–3605 RSC.
- H. Z. Geng, K. K. Kim, K. P. So, Y. S. Lee, Y. Chang and Y. H. Lee, J. Am. Chem. Soc., 2007, 129, 7758–7759 CrossRef CAS.
- U. Dettlaff-Weglikowska, V. Skakalov, R. Graupner, S. H. Jhang, B. H. Kim, H. J. Lee, L. Ley, Y. W. Park, S. Berber, D. Tomanek and S. Roth, J. Am. Chem. Soc., 2005, 127, 5125–5131 CrossRef CAS.
- A. Javey, J. Guo, Q. Wang, M. Lundstrom and H. Dai, Nature, 2003, 424, 654–657 CrossRef CAS.
- P. Avouris, Z. H. Chen and V. Perebeinos, Nat. Nanotechnol., 2007, 2, 605–615 CrossRef CAS.
- A. G. Rinzler, J. Liu, H. Dai, P. Nikolaev, C. B. Huffman, F. J. Rodriguez-Macias, P. J. Boul, A. H. Lu, D. Heymann, D. T. Colbert, R. S. Lee, J. E. Fischer, A. M. Rao, P. C. Eklund and R. E. Smalley, Appl. Phys. A: Mater. Sci. Process., 1998, 67, 29–37 CrossRef.
- K. Kordas, T. Mustonen, G. Toth, H. Jantunen, C. Soldano, S. Talapatra, S. Kar, R. Vajtai and P. M. Ajayan, Small, 2006, 2, 1021–1025 CrossRef CAS.
- W. R. Small and M. in het Panhuis, Small, 2007, 3, 1500–1503 CrossRef.
- N. Songmee, S. Daothong and P. Singjai, J. Nanosci. Nanotechnol., 2008, 8, 2522–2525 CAS.
- E. S. Snow, J. P. Novak, P. M. Campbell and D. Park, Appl. Phys. Lett., 2003, 82, 2145–2147 CrossRef CAS.
- F. Frehill, J. G. Vos, S. Benrezzak, A. A. Koos, Z. Konya, M. G. Ruther, W. J. Blau, A. Fonseca, J. B. Nagy, L. P. Biro, A. I. Minett and M. in het Panhuis, J. Am. Chem. Soc., 2002, 124, 13694–13695 CrossRef CAS.
- P. N. Nirmalraj, P. E. Lyons, S. De, J. N. Coleman and J. J. Boland, Nano Lett., 2009, 9, 3890–3895 CrossRef CAS.
- M. in het Panhuis, S. Gowrisanker, D. J. Vanesko, C. A. Mire, H. Jia, H. Xie, R. H. Baughman, I. H. Musselman, B. E. Gnade, G. R. Dieckmann and R. K. Draper, Small, 2005, 1, 820–823 CrossRef.
- G. Gruner, J. Mater. Chem., 2006, 16, 3533–3539 RSC.
- K. Bradley, J.-P. C. Gabriel and G. Gruner, Nano Lett., 2003, 3, 1353–1355 CrossRef CAS.
- L. Hu, D. S. Hecht and G. Gruner, Nano Lett., 2004, 4, 2513–2517 CrossRef CAS.
- F. M. Blighe, Y. R. Hernandez, W. J. Blau and J. N. Coleman, Adv. Mater., 2007, 19, 4443–4447 CrossRef CAS.
- C. J. Ferris and M. in het Panhuis, Soft Matter, 2009, 5, 1466–1473 RSC.
- J. A. Boge, L. J. Sweetman, M. in het Panhuis and S. F. Ralph, J. Mater. Chem., 2009, 19, 9131–9140 RSC.
- C. J. Ferris and M. in het Panhuis, Soft Matter, 2009, 5, 3430–3437 RSC.
- R. Bandyopadhyaya, E. Nativ-Roth, O. Regev and R. Yerushalmi-Rozen, Nano Lett., 2002, 2, 25–27 CrossRef CAS.
- E. Polaczek, L. Stobinski, J. Mazurkiewicz, P. Tomasik, H. Koloczekand and H. M. Lin, Polimery, 2007, 52, 34–38 Search PubMed.
- M. in het Panhuis, A. Heurtematte, W. R. Small and V. N. Paunov, Soft Matter, 2007, 3, 840–843 RSC.
- A. M. Fialho, L. M. Moreira, A. T. Granja, A. O. Popescu, K. Hoffman and I. Sa-Correia, Appl. Microbiol. Biotechnol., 2008, 79, 889–900 CrossRef CAS.
- L. D. L. Melton, D. A. Mindt and G. R. Sanderson, Carbohydr. Res., 1976, 46, 245–257 CrossRef CAS.
- P. E. Jansson, B. Lindberg and P. A. Sandford, Carbohydr. Res., 1983, 124, 135–139 CrossRef CAS.
- S. C. Kumar, C. S. Satish and H. G. Shivakumar, J. Macromol. Sci., Part A: Pure Appl. Chem., 2008, 45, 643–649 Search PubMed.
- A. M. Smith, R. M. Shelton, Y. Perrie and J. J. Harris, J. Biomater. Appl., 2007, 22, 241–254 CrossRef.
- P. E. Lyons, S. De, F. M. Blighe, V. Nicolosi, L. F. C. Pereira, M. S. Ferreira and J. N. Coleman, J. Appl. Phys., 2008, 104, 044302 CrossRef.
| This journal is © The Royal Society of Chemistry 2010 |