High-performance nanostructured MR contrast probes
Fengqin
Hu
a,
Hrushikesh M.
Joshi
b,
Vinayak P.
Dravid
*b and
Thomas J.
Meade
*a
aDepartment of Chemistry, Biochemistry and Molecular Biology and Cell Biology, Neurobiology and Physiology, and Radiology, Northwestern University, Evanston, IL 60208, USA. E-mail: tmeade@northwestern.edu; Fax: +1 847 491 3832; Tel: + 1 847 491 2481
bDepartment of Materials Science & Engineering, International Institute for Nanotechnology, Northwestern University, Evanston, IL 60208, USA. E-mail: v-dravid@northwestern.edu; Fax: +1 847 467 6573; Tel: +1 847 467 136
First published on 6th August 2010
Abstract
Magnetic resonance imaging (MRI) has become a powerful technique in biological molecular imaging and clinical diagnosis. With the rapid progress in nanoscale science and technology, nanostructure-based MR contrast agents are undergoing rapid development. This is in part due to the tuneable magnetic and cellular uptake properties, large surface area for conjugation and favourable biodistribution. In this review, we describe our recent progress in the development of high-performance nanostructured MR contrast agents. Specifically, we report on Gd-enriched nanostructured probes that exhibit T1 MR contrast and superparamagnetic Fe3O4 and CoFe2O4 nanostructures that display T2 MR contrast enhancement. The effects of nanostructure size, shape, assembly and surface modification on relaxivity are described. The potential of these contrast agents for in vitro and in vivo MR imaging with respect to colloidal stability under physiological conditions, biocompatibility, and surface functionality are also evaluated.
 Fengqin Hu | Dr Fengqin Hu received her Ph.D. degree in 2007 at the Institute of Chemistry, Chinese Academy of Sciences under the supervision of Prof. Mingyuan Gao. After that, she joined the group of Prof. Thomas J. Meade at Northwestern University as a postdoctoral fellow. Since 2010, she has been working in the Beijing Normal University as an Assistant Professor. Her research focuses on the synthesis of biocompatible inorganic nanocrystals as well as their biological and biomedical applications. |
 Hrushikesh M. Joshi | Dr Hrushikesh M. Joshi completed his Ph.D. under the supervision of Dr Murali Sastry, thereafter he worked with Prof. Satish Ogale for one year as a research associate at National Chemical Laboratory Pune. At present, he is working as CCNE postdoctoral research scholar at Northwestern University with Prof. Vinayak Dravid. His research interests include synthesis and surface functionalization of inorganic nanoparticles for various industrial applications. He is recipient of the DST award for the meeting of Nobel laureate and students in chemistry, Lindau, Germany in 2006. |
 Vinayak P. Dravid | Vinayak P. Dravid is Professor of Materials Science & Engineering at Northwestern University, and founding Director of the NUANCE Center. His research program includes nanoscale dynamic phenomena in broad areas of nanostructured materials, energy, and convergence of engineering, physical and biomedical sciences. His awards include; Fellowships to Materials Research Society (MRS), Microscopy Society of America (MSA) and American Ceramic Society (ACerS). He is the recipient of the American Ceramic Society's Robert L. Coble Award and Richard M. Fulrath Award, MSA's Burton Medal, among other honors. He was elected twice to Northwestern Faculty Honor Roll for excellence in teaching. |
 Thomas J. Meade | Dr Thomas J. Meade is currently the Eileen Foell Chair in Cancer Research and Professor of Chemistry, Biochemistry and Molecular & Cell Biology, Neurobiology & Physiology, and Radiology, as well as the Director of the Center for Advanced Molecular Imaging (CAMI). Professor Meade's research focuses on bioinorganic coordination chemistry and biological molecular imaging, electron transfer processes and the development of electronic biosensors for the detection of DNA and proteins. He has founded three biotech companies developing hand-held devices for protein and DNA detection and bioactivated MR contrast agents for in vivo imaging of cancer. |
Introduction
During the past two decades, magnetic resonance imaging (MRI) has become a ubiquitous tool for biological molecular imaging and clinical diagnosis.1–4 One of many significant advantages of MR imaging is the ability to acquire (3-D) tomographic information of whole tissue samples and animals with high spatial resolution and soft tissue contrast. In addition, images are acquired without the use of ionizing radiation [X-ray and computed tomography (CT)] or radiotracers [positron emission tomography (PET) and single photon emission computed tomography (SPECT)]. MRI is based on the response of proton spin in the presence of an external magnetic field when triggered with a radio frequency pulse. Under the influence of an external magnetic field, protons align in one direction. Upon application of the RF pulse, aligned protons are perturbed and subsequently relax to the original state. There are two independent relaxation processes: longitudinal and transverse relaxation which are typically used to generate the MR images.Due to the varying water concentration and local environment, intrinsic contrast between organs and tissues can be observed.1,5 Signal resolution can be enhanced with the use of contrast agents. MR imaging agents are paramagnetic molecular complexes [typically Gd(III) chelates] due to the seven unpaired electrons and symmetrical s ground state.5 Areas enriched with Gd(III) complexes exhibit an increase in signal intensity and appear bright in T1-weighted images.1,5 Superparamagnetic iron oxide nanoparticles are another class of MR contrast agents that produce a decrease in signal intensity and appear dark in T2-weighted images.6,7 The efficiency of a contrast agent to reduce T1 or T2 of water protons is referred to as relaxivity, and defined by the eqn (1).5,8
| 1/T1,2 = 1/T01,2 + r1,2C | (1) |
Where 1/T1,2 is the observed relaxation rate in the presence of contrast agents, 1/T01,2 is the relaxation rate of pure water, C is the concentration of the contrast agents, and r1 and r2 are the longitudinal and transverse relaxivities, respectively. According to this equation, MR contrast agents with high relaxivity are desired to have effective contrast enhancement under low agent concentrations and hence reduce toxicity.
Nanostructures have attracted considerable attention recently in science and technology.9 Nanostructure-based MR contrast agents with improved characteristics and added functionalities have been developed as a result of the rapid progress in nanotechnology.8,10–13 There are two broad classes of nanostructure-based MR contrast agents: 1) paramagnetic complexes doped in nanostructured framework structures, such as silica,11 nanotubes,14,15 gold,16 titanium dioxide,17 nanodiamonds,18 perfluorocarbon,19,20 and 2) inorganic magnetic nanoparticles, which themselves act as MR contrast agents.12 Compared to conventional paramagnetic agents, nanostructure-based agents have a number of advantages: 1) the magnetic properties of inorganic magnetic nanostructures can be tailored by size, shape, composition, and assembly. 2) nanostructure-based MR contrast agents show tuneable cellular uptake. The majority of Gd(III) complex are limited to the blood pool and extracellular space.21 However, after conjugating Gd(III) complexes to gold nanoparticles, a greater than 50-fold increase in cell uptake compared to Gd(III)-DOTA (1,4,7,10-tetraazacyclododecane-1,4,7,10-tetraacetic acid) was observed.16 3) nanostructure-based MR contrast agents have a large surface area per unit volume that can be conjugated with targeting molecules and other probes, thus achieving targeting and multimodal agents. 4) the nanoscale dimension and shape of the nanostructure-based MR contrast agents allow varying and favourable biodistribution.
In this short review, we introduce our recent progress on the development of high-performance nanostructured MR contrast agents. Specifically, we will focus on Gd-enriched nanostructured T1 agents, new magnetic Fe3O4 particles and CoFe2O4T2 agents. The effects of nanostructure size, shape, assembly and surface modification on relaxivity are discussed. The potential of these contrast agents for in vitro and in vivo MR imaging with respect to colloidal stability under physiological conditions, biocompatibility, and surface functionality are evaluated.
Gd-enriched nanostructured T1 MR contrast agents
As mentioned above, current Gd(III) complex contrast agents are typically restricted to the extracellular environment. With the advance of MR imaging techniques in providing cellular-scale spatial resolution, considerable research efforts have focused on the development of cell-permeable contrast agents.22–25 Loading Gd(III) complexes in nanostructures is another efficient strategy to increase their cellular uptake efficiency due to the unique attributes of nanostructures. In addition, the introducton of nanostructures endows other modalities besides MRI, and hence achieves prospects for multimodal probes.TiO2 nanoparticles labeled with Gd(III) complexes
TiO2 nanoparticles represent one of the most studied nanoparticle systems due to their unique photocatalytic, chemical and structural properties. Paunesku et al.26 reported that TiO2 nanoparticles decorated with oligonucleotides function in a targeted and therapeutic capacity. Targeting is accomplished via oligonucleotide hybridization to an intracellular organelle's DNA sequence, and therapeutic activity is elicited by light-induced scission of the nanoparticle-bound DNA via a redox reaction. In our laboratory, we functionalized a DNA-labeled TiO2 nanoparticles with Gd(III) complex contrast agents to produce a biocompatible and therapeutically active delivery scaffold that is detectable by MRI.Gd(III)-DO3A (1,4,7-tris(carboxymethylaza)cyclododecane-10 -azaacetylamide) was modified on the surface of the DNA-labeled TiO2 nanoparticles through ortho-substituted enediol ligands (Fig. 1a-b).17 The nanoconjugates yielded a relaxivity of 3.5 ± 0.1 mM−1 s−1 per Gd(III) ion (1.5 T), similar to clinical small molecule contrast agents.5 On the basis of the Ti:Gd ratio acquired from ICP-MS, each individual nanoparticle has an average relaxivity of 61.0 ± 1.7 mM−1 s−1.
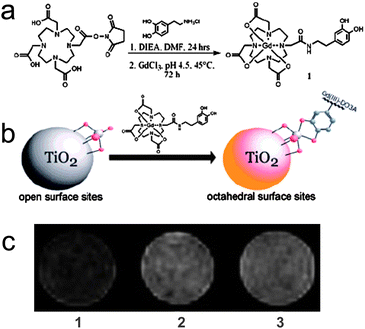 | ||
| Fig. 1 The scheme of (a) the synthetic route to a dopamine-modified MR contrast agent (DOPA-DO3A) and (b) functionalization of DNA-labeled TiO2 nanoparticles with DOPA-DO3A; (c) T1-weighted MR images of (1) control PC3M cells, (2) and (3) PC3M cells incubated with 0.001 mM DNA-DOPA-DO3A-modified TiO2 nanoconjugates with (2) 1.8% and (3) 4.4% 1:TiO2 active site coverage (from ref. 17). | ||
After transfection of PC12 cells with the nanoconjugates, X-ray fluorescence (XRF) spectroscopy showed that the nanoconjugates are present in the cytoplasm but not the nuclear regions, due to the conjugated DNA oligonucleotides. Analysis of Ti and Gd fluorescence signals and toxicity assays revealed that the nanoconjugates are biologically stable. The cellular imaging capability of the nanoconjugates was examined using PC3M cells (Fig. 1c). T1-weighted MR images reveal that the cells incubated with the nanoconjugates display a greater contrast over control cells.
Gold nanoparticles labeled with Gd(III) complexes
A new class of nanostructured cellular imaging agent has been developed in our lab that uses gold nanoparticles as carriers.16 DNA–Gd(III) conjugates were prepared by covalently attaching Gd(III) complexes to DNA through click chemistry. Then, the conjugates were immobilized on the citrate-stabilized Au nanoparticles to obtain DNA–Gd(III)@Au (Fig. 2a). The ionic relaxivities at 1.5 T of the nanoconjugates were measured to be 16.9 and 20.0 mM−1 s−1 for 13 nm and 30 nm DNA–Gd(III)@Au, respectively. This represents a fourfold and fivefold increase over the unconjugated Gd(III) complex (3.2 mM−1 s−1), respectively. Taking into account the loading of Gd(III) per particle, the 13 nm DNA–Gd(III)@Au exhibited relaxivity of approximately 5779 mM−1 s−1 per particle, demonstrating that DNA–Gd(III)@Au is a highly efficient T1 MR probe.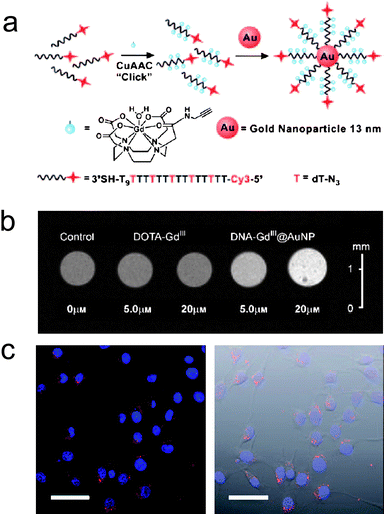 | ||
| Fig. 2 (a) Scheme of the synthesis of Cy3-DNA–Gd(III)@Au; (b) T1-weighted MR images of NIH/3T3 cells incubated with DNA–Gd(III)@Au and Gd(III)–DOTA; (c) Confocal fluorescence micrographs of NIH/3T3 cells incubated with Cy3-DNA–Gd(III)@Au. Scale bar = 50 μm (from ref. 16). | ||
NIH/3T3 and Hela cell experiments showed that the Gd(III) uptake was more than 50-fold higher for DNA–Gd(III)@Au compared to Gd(III)–DOTA at all concentrations. On average, cells absorbed up to 106–107 Gd(III) ions per cell using only μM Gd(III) incubation concentrations. Compared with previous cell-permeable contrast agents using either the small transduction molecule stilbene and oligomeric polyarginine-conjugated Gd(III)–DOTA, DNA–Gd(III)@Au exhibits a very efficient means to label cells.23,24 The high relaxivity and cellular uptake efficiency of DNA–Gd(III)@Au allow that μM Gd(III) incubation concentrations of DNA–Gd(III)@Au were sufficient to produce significant T1-weighted contrast enhancement of small cell populations (Fig. 2b). These results represent the lowest reported incubation concentration of a Gd(III) complex or conjugate to produce a greater than 40% reduction of T1 in cell pellets. Furthermore, the DNA–Gd(III)@Au is resistant to nuclease degradation which is important for long term cell tracking.27
This synthesis can be modified to introduce fluorescent dyes such as Cy3 on the nanoconjugates and to produce multimodal probes (Fig. 2a). The fluorescence micrographs show that the Cy3-DNA–Gd(III)@Au localize in small vesicles in the perinucleur region, suggesting that the nanoconjugates are taken up through an endocytic mechanism (Fig. 2c).
Nanodiamond particles labeled with Gd(III) complexes
Significant interest has focused on carbon-based nanomaterials such as fullerenes and nanotubes for biological applications (biosensors, drug delivery) due to their physical, chemical, and biological properties. However, the biocompatibility of these compounds remains in question.28 Diamond-based nanoparticles have gained attention as an alternative carbon nanomaterial because of their excellent biocompatibility that is due in part to lower induction of cellular oxidative stress than is observed with other carbon nanomaterials.29–32 Imaging of nanodiamond particles has largely centered on optical with fluorescence spectroscopy.30,31 We selected covalent modification of the nanodiamond surface for attachment of Gd(III) complexes to produce nanodiamonds detectable by MR imaging.18 An amine functionalized Gd(III) complex with a six carbon linker was synthesized and coupled to the carboxylic acid groups on the nanodiamond surface (Fig. 3a-b). ICP-MS analysis showed that 48 ± 3 μM of Gd(III) adhered to nanodiamonds per 1 mg/mL nanodiamond reaction.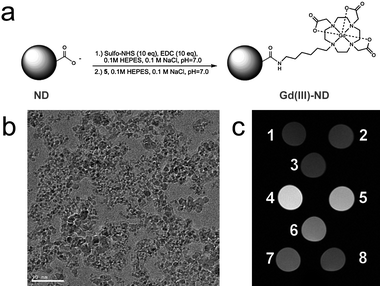 | ||
| Fig. 3 (a) Scheme of the conjugation of the Gd(III) contrast agent to the nanodiamond surface; (b) TEM image of the nanodiamond particles (scale bar = 50 nm); (c) T1-weighted MR images of (1) water, (2) 1 mg/mL undecorated nanodiamond, (3) undecorated nanodiamond + coupling reagents, and (4)-(8) Gd(III)-modified nanodiamond particles with Gd(III) concentrations of 48, 38, 22, 10, and 5 μM, respectively (from ref. 18). | ||
The Gd(III)-modified nanodiamond particles significantly reduced the T1 of water protons with a per Gd(III) relaxivity of 58.82 ± 1.18 mM−1s−1 at 1.5 T. This represents a tenfold increase compared to the monomer Gd(III) complex (r1 = 5.42 ± 0.20 mM−1s−1) and is among the highest per-Gd(III) relaxivities ever reported. This enhanced contrast is clearly seen in the MR images of Gd(III)-modified and unmodified nanodiamond particles (Fig. 3c). The combination of interaction of the water nanophase, which is induced by the strong electrostatic potentials on the nanodiamond facets, with the paramagnetic metal and the size of the nanodiamond clusters (130 nm − 55 nm) may be the contributions for the high relaxivity of the system.
Superparamagnetic nanostructured T2 MR contrast agents
Over the past two decades, dextran-coated superparamgnetic iron oxide (SPIO) and related nanoparticles (e.g., CLIO, Feridex, Resovist, and Combidex) have been used as conventional T2 MR contrast agents in clinical imaging and molecular imaging.33,34 However, these magnetic nanoparticles exhibit low monodispersity and poor crystallinity due to the inherent disadvantages of co-precipitation synthesis method. To improve MR contrast effect, researchers have been developing new synthesis procedures for high-performance superparamagnetic nanostructured MR probes. The thermal decomposition method is one of the most developed and frequently utilized methods to produce monodispersed and highly crystalline magnetic nanostuctures.10,35–38 The magnetic nanostructures synthesized through this procedure are typically coated with hydrophobic ligands and hence water insoluble. It is necessary to transfer the hydrophobic nanostructures from organic phase to aqueous phase.To reach this goal, several strategies have been developed. These include ligand exchange, introduction of amphiphilic molecules and coating with a hydrophilic shell.10 To avoid cumbersome phase transfer processes, novel one-pot processes have been developed to synthesize water-dispersible nanostructures with well-defined shape and controlled sizes.13,39,40 For example, Gao group13,39 synthesized a series of water-soluble and biocompatible Fe3O4 nanoparticles using polar solvent in a one-pot reaction. In this context, we developed several facile synthesis procedures for water-soluble, high-performance magnetic nanostructures. We have investigated the effect of size, shape, assembly and surface modification on MR relaxivities and the potential of these contrast agents for in vitro and in vivo MRI with respect to colloidal stability under physiological conditions, biocompatibility, and surface functionality.
Nanostructured Fe3O4
Enhancing in vivo targeting specificity is a great challenge encountered with iron oxide MR contrast agents. Commonly used iron oxide nanoparticle contrast agents generate local contrast through nonspecific uptake by mononuclear phagocytes, and with a hydrodynamic size of over 50 nm, these particles remain primarily intravascular and are taken up by the reticuloendothelial system (RES),41,42 which severely undermines their targeting specificity. Smaller hydrodynamic sizes are desired to overcome these problems.42,43 We have described a direct synthesis of monodisperse, water-soluble, 3–6 nm size Fe3O4 superparamagnetic nanoparticles via a one-pot reaction using iron(III) acetylacetonate [Fe(acac)3] as the iron precursor and diethylene glycol (DEG) as the solvent, reducing agent, and stabilizer (Fig. 4a).44 PEG modification of the surface of Fe3O4 nanoparticles is accomplished via a ligand-exchange reaction based on the relatively weak coordinating ability of DEG molecules.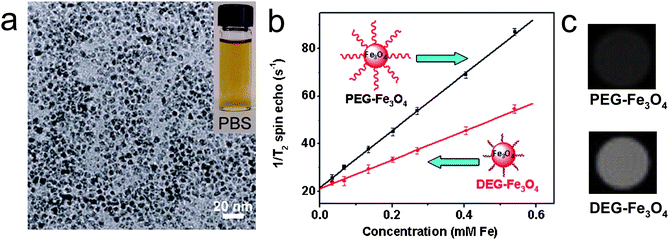 | ||
| Fig. 4 (a) TEM image of 6 nm DEG-Fe3O4; Inset is a photograph of the 6 nm DEG-Fe3O4 suspended in PBS; (b) T2 relaxation rates (1/T2) of 6 nm PEG-Fe3O4 and 6 nm DEG-Fe3O4 at different Fe concentrations; (c) T2-weighted MR images of 6 nm PEG-Fe3O4 and 6 nm DEG-Fe3O4 at Fe concentration of 7.5 mg/L (from ref. 44). | ||
Colloidal stability under physiological conditions is one of the most important issues in biological applications of nanomaterials. Fe3O4 nanoparticles synthesized through this procedure show excellent colloidal stability in phosphate buffered saline (PBS), fetal bovine serum (FBS), and calf bovine serum (CBS) (Fig. 4a). Furthermore, the Fe3O4 nanoparticles synthesized via this approach also tolerate high salt concentrations (≤ 1 M NaCl) and a wide pH range from 5 to 11.
As Fe3O4 nanoparticle nominal size increases from 3 to 4, 5, and to 6 nm, their r2 gradually increases from 29 to 42, 48, and to 61 mM−1s−1, respectively. This size effect on relaxivity is due to surface spin-canting effects (i.e., as the nanoparticle size decreases, the magnetically disordered spin-glass-like surface layer becomes more pronounced, and is reflected in the reduced net magnetic moment and MR contrast-enhancement effect).10 In addition to size effects, surface modification plays an important role on relaxivity. Previous results showed that coordination chemistry of the inner capping ligand(s) and hydrophilicity of the coating layer are important factors to determine relaxivity.45,46 Computer simulation results show that the coating layer that slows down water diffusion can also affect relaxivity (i.e., as the thickness of this layer is increased, r2 increases due to the increased volume of slowly diffusing water surrounding each nanoparticle).47 Our experimental results clearly demonstrate this point. PEG modification of 3, 4, 5 and 6 nm Fe3O4 nanoparticles resulted in r2 increases from 29 to 47, 42 to 69, 48 to 86, and 61 to 119 mM−1 s−1, respectively, since PEG-Fe3O4 forms a larger water-slow diffusion layer than DEG-Fe3O4, as has been shown by DLS (Fig. 4b). This difference can be seen on the T2-weighted MR images (Fig. 4c). In vitro experiments showed that DEG- and PEG-coated Fe3O4 nanoparticles have little effect on NIH/3T3 cell viability.
We have developed a simple one-step process for synthesis of amine-stabilized iron oxide nanoparticles from a single FeCl2 precursor using dodecylamine (DDA) as the reducing and surface-functionalizing agent.48 In this report, we have demonstrated that DDA electrostatically complexes with aqueous iron ion, reduces it and caps the nanoparticles. As such DDA does not dissolve in water at room temperature; however, reaction takes place immediately after it reaches 35 °C, forming highly dispersive Fe3O4 nanoparticles. In contrast, similar results were not observed at 100 °C. This observation suggests that reactivity of reaction strongly dependent on the nature of the amine group. It indicates that iron oxide nanoparticles were produced via Fe(II)-amine complex followed by its thermal decomposition. The reaction was so rapid that Fe3O4 were strongly protected by multlayers of amine molecules to avoid aggregation of nanoparticles. Capping of iron oxide nanoparticles with the amine molecules stabilizes the particles in solution nearly covalently and renders them water-dispersible. Higher dodecylamine concentrations and longer reaction times lead to more stable, monodisperse nanoparticles with high relaxivity, for use in biomedical applications.
Spherical and faceted irregular (FI) CoFe2O4 nanostructures
Shape properties of MR contrast enhancement are not well understood. To investigate these effects, we synthesized spherical and FI CoFe2O4via a high temperature solution phase method (Fig. 5a-b).49 Since thermal activation and MRI properties of the cobalt ferrite nanostructures are well studied and easily quantifiable, we have used it to determine its shape dependent properties in spite of the fact that cobalt is toxic in nature. Spherical CoFe2O4 of various sizes were synthesized with the help of seed mediated growth in the organic phase, while FI CoFe2O4 was synthesized with the same method but in the presence of a magnetic field. The stable cobalt ferrite nanostructures of various shapes and sizes were phase transferred from the organic phase to the aqueous phase using 11-amino undecanoic acid.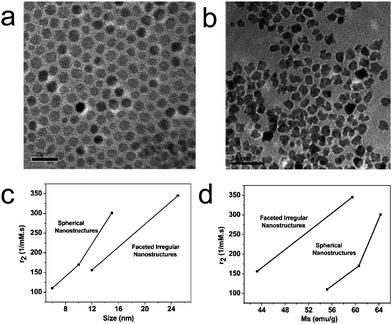 | ||
| Fig. 5 (a-b) TEM images of (a) 6 nm spherical and (b) 12 nm FI CoFe2O4 nanostructures; The scale bars in a and b are 20 nm and 50 nm, respectively; (c-d) Plot of relaxivities versus (c) size and (d) saturation magnetization of the CoFe2O4 nanostructures. (from ref. 49). | ||
Similar to Fe3O4 nanoparticles, the r2 of CoFe2O4 nanostructures increases with size (i.e., from 110, 169 to 301 mM−1 s−1 for 6, 10 and 15 nm spherical CoFe2O4 and from 155 to 345 mM−1 s−1 for 12 and 25 nm FI CoFe2O4). Furthermore, FI CoFe2O4 exhibits lower relaxivity than their spherical counterparts (Fig. 5c). However, with respect to their saturation magnetization, FI CoFe2O4 shows a higher relaxivity than spherical CoFe2O4, which might be due to the reduced magnetization induced by partial pinning of magnetic moments, pseudomagnetic charges because of corners and edges of the nanostructures and a greater surface-to-volume of FI CoFe2O4 (Fig. 5d). These results suggest that the relaxivity is not only dependent on the magnetic saturation of the CoFe2O4 but also affected by its morphology.
Superparamagnetic iron oxide nanoassemblies
Assembly of magnetic nanoparticles has two types of effects on the proton relaxation properties similar to random aggregates of magnetic nanoparticles.8,50 One of them associates with the coarser structure of the nanoassemblies and magnetic field distribution around it, whereas the other one is limited to the inner part of the nanoassemblies (Fig. 6). The coarser effect dominantly influences r2, while the inner one does not influence r2 significantly but mainly affects r1. The enhancement of r1 produced by magnetic nanoparticles requires intimate contact between water molecules and the surface of the magnetic nanoparticles similar to T1 contrast agent based on Gd(III). Assembly of magnetic nanoparticles decreases the surface of magnetic nanoparticles in contact with the water and hence decreases the effect of inner sphere relaxation effect which in turn decreases the r1 value. | ||
| Fig. 6 A schematic representation of outer sphere–inner sphere model of magnetic nanoparticle assembly (from ref. 56). | ||
In regard to T2 contrast enhancement, due to the synergistic interactive magnetism arising from multiple magnetic nanoparticles in the assembly, magnetic nanoparticle assemblies present higher r2 than separated nanoparticles. The r2 of the nanoassemblies can be expressed as:50
 | (2) |
We have synthesized a series of water-soluble Fe3O4 magnetic nanoassemblies through heating a mixture of Fe(acac)3, HOOC–PEG–COOH, and oleylamine in phenyl ether (Fig. 7a).52 The presence of PEG on the Fe3O4 nanoassemblies was demonstrated by FTIR. PEG has been demonstrated to be a good choice to act as surfactant because it can stabilize nanoparticles in a wide pH range due to hydrogen bonding between PEG and water. Furthermore, PEG layers have been shown to be non-toxic, non-immunogenic, non-antigenic and protein-resistant.53
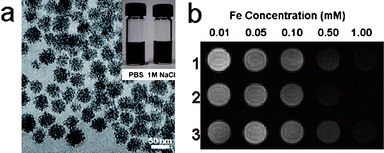 | ||
| Fig. 7 (a) TEM image of the 42 nm Fe3O4 nanoassemblies (scale bar = 50 nm); Inset are photographs of the Fe3O4 nanoassemblies suspended in PBS and 1 M NaCl.; (b) T2-weighted MR images of aqueous solutions of (1) 42 nm, (2) 30 nm and (3) 19 nm Fe3O4 nanoassemblies at various Fe concentrations (from ref. 52). | ||
Consequently, PEG-coated Fe3O4 nanoassemblies synthesized through the above procedure show excellent colloidal stability in H2O, PBS, cell culture media and serum, and tolerate a high salt concentration (1 M NaCl) and a wide pH range from 3 to 11 (Fig. 7a). The hydrodynamic sizes and T2 values of the Fe3O4 nanoassemblies present an excellent stability during the three week measurement period. The presence of surface free carboxylic acid groups was demonstrated by zeta potential results, allowing further conjugation reactions with targeting molecules or other modalities.
At 250 K, the Fe3O4 nanoassemblies exhibit superparamagnetic behavior without magnetic hysteresis and remanence. The saturation magnetizations of 42, 30 and 19 nm Fe3O4 nanoassemblies at 250 K are 33, 45, 36 emu g−1 Fe, respectively. This trend is consistent with that of the primary Fe3O4 nanoparticle size in the Fe3O4 nanoassemblies (i.e., 4.3, 4.8 and 4.5 nm for 42, 30 and 19 nm Fe3O4 nanoassemblies, respectively). The r2 values of 42, 30 and 19 nm Fe3O4 nanoassemblies at 1.5 T are 148, 238, and 126 mM−1 s−1, respectively.
The contrast enhancement differences are due to the synergistic effects of the primary Fe3O4 nanoparticle size and the number of nanoparticles per Fe3O4 nanoassembly as shown in eqn (2) and can be seen on the T2-weighted MR images (Fig. 7b). For comparison, the r2 of 30 nm Fe3O4 nanoassemblies (238 mM−1 s−1, 1.5 T) is 2.3 times of that of the commercial Feridex (104 mM−1 s−1, 1.5 T) which has a similar primary particle size.54 Furthermore, these Fe3O4 nanoassemblies with excellent colloidal stability and high transverse relaxivity have no effect on the viability of NIH/3T3 cells, indicating the Fe3O4 nanoassemblies are promising candidates as high-efficiency T2 contrast agents for a variety of MR imaging applications.
Besides carboxylic acid functionalized Fe3O4 nanoassemblies, we developed a novel one-pot approach to prepare amine functionalized water-soluble Fe3O4 nanoassemblies. It is an environmentally and economically preferable one-step green chemistry approach using Fe-chloride precursors, biocompatible ethylene glycol as solvent and ethylenediamine as surfactants.55,56 The size of the Fe3O4 nanoassemblies is about 40 ± 1 nm while that of the individual nanoparticles is about 6 nm. The Fe3O4 nanoassemblies exhibit superparamagnetic behavior and a high saturation magnetization of 64.3 emu g−1. The r2 of the Fe3O4 nanoassemblies is 314.6 mM−1 s−1, which is 60% higher than that of 6 nm Fe3O4 nanoparticles and 2.7 times higher than that of commercial ferumoxytol. The presence of amine functional groups on the surface of the Fe3O4 nanoassemblies was confirmed by FTIR, thermal and elemental analyses, and provides an accessible surface for routine conjugation of biomolecules through well-developed bioconjugation chemistry.
Conclusions and outlook
Over last 20 years, nanostructure-based MR contrast agents have made remarkable progress. The two primary classes of nanostructure-based MR contrast agents include paramagnetic complexes doped in nanostructured frameworks and inorganic magnetic nanoparticles, which themselves act as MR contrast agents. The attachment of Gd(III) complexes to various nanostuctures such as TiO2, Au and nanodiamond particles not only retains or increases the MR contrast effect of the Gd(III) complex, but provides a scaffold to prepare multimodal probes and overcomes the extracelluar limitation of Gd(III) complexes and achieves cellular imaging agents. Further, the contrast enhancement effects of magnetic nanostructured T2 contrast agents can be effectively tuned through size, shape, assembly or surface modification of the nanostructures.Ultimately, one of the most significant obstacles of nanostructure agents is batch-to-batch reproducibility. Given the high performance of nanostructure-based MR contrast agents, a complementary understanding of their biological effects such as toxicity,18 biodistribution57 and pharmacokinetics58 is required if the next stage (translational research) is to be successful.
Acknowledgements
We thank Dr Amanda L. Eckermann and Dr Mrinmoy De for helpful discussions. This work was supported by the Nanomaterials for Cancer Diagnostics and Therapeutics under Grant 5 U54CA119341-02 and the National Institutes of Health/NIBIB Grant 1 R01EB005866-01.References
- A. E. Merbach and E. Toth, The Chemistry of Contrast Agents in Medical Magnetic Resonance Imaging, Wiley, New York, 2001 Search PubMed.
- S. Aime, C. Cabella, S. Colombatto, S. Geninatti Crich, E. Gianolio and F. Maggioni, J. Magn. Reson. Imaging, 2002, 16, 394–406 CrossRef.
- X. Hu and D. G. Norris, Annu. Rev. Biomed. Eng., 2004, 6, 157–184 CrossRef CAS.
- M. Winter Patrick, D. Caruthers Shelton, A. Wickline Samuel and M. Lanza Gregory, Curr. Cardiol. Rep., 2006, 8, 65–69 Search PubMed.
- P. Caravan, J. J. Ellison, T. J. McMurry and R. B. Lauffer, Chem. Rev. (Washington, D.C.), 1999, 99, 2293–2352 CrossRef CAS.
- M. H. Mendonca Dias and P. C. Lauterbur, Magn. Reson. Med., 1986, 3, 328–330 CrossRef CAS.
- R. C. Semelka and T. K. Helmberger, Radiology, 2001, 218, 27–38 Search PubMed.
- S. Laurent, D. Forge, M. Port, A. Roch, C. Robic, L. Vander Elst and R. N. Muller, Chem. Rev. (Washington, DC, U.S.), 2008, 108, 2064–2110 CrossRef CAS.
- A. I. Hochbaum and P. Yang, Chem. Rev. (Washington, DC, U.S.), 2010, 110, 527–546 CrossRef CAS.
- Y.-w. Jun, J.-H. Lee and J. Cheon, Angew. Chem., Int. Ed., 2008, 47, 5122–5135 CrossRef CAS.
- K. M. L. Taylor, J. S. Kim, W. J. Rieter, H. An, W. Lin and W. Lin, J. Am. Chem. Soc., 2008, 130, 2154–2155 CrossRef CAS.
- H. B. Na, I. C. Song and T. Hyeon, Adv. Mater. (Weinheim, Ger.), 2009, 21, 2133–2148 CrossRef CAS.
- F. Hu, L. Wei, Z. Zhou, Y. Ran, Z. Li and M. Gao, Adv. Mater. (Weinheim, Ger.), 2006, 18, 2553–2556 CrossRef CAS.
- C. Richard, B.-T. Doan, J.-C. Beloeil, M. Bessodes, E. Toth and D. Scherman, Nano Lett., 2008, 8, 232–236 CrossRef CAS.
- B. Sitharaman, K. R. Kissell, K. B. Hartman, L. A. Tran, A. Baikalov, I. Rusakova, Y. Sun, H. A. Khant, S. J. Ludtke, W. Chiu, S. Laus, E. Toth, L. Helm, A. E. Merbach and L. J. Wilson, Chem. Commun., 2005, 3915–3917 RSC.
- Y. Song, X. Xu, K. W. MacRenaris, X.-Q. Zhang, C. A. Mirkin and T. J. Meade, Angew. Chem., Int. Ed., 2009, 48, 9143–9147 CrossRef CAS.
- P. J. Endres, T. Paunesku, S. Vogt, T. J. Meade and G. E. Woloschak, J. Am. Chem. Soc., 2007, 129, 15760–15761 CrossRef CAS.
- L. M. Manus, D. J. Mastarone, E. A. Waters, X.-Q. Zhang, E. A. Schultz-Sikma, K. W. MacRenaris, D. Ho and T. J. Meade, Nano Lett., 2010, 10, 484–489 CrossRef CAS.
- S. Flacke, S. Fischer, M. J. Scott, R. J. Fuhrhop, J. S. Allen, M. McLean, P. Winter, G. A. Sicard, P. J. Gaffney, S. A. Wickline and G. M. Lanza, Circulation, 2001, 104, 1280–1285 CrossRef CAS.
- P. M. Winter, A. M. Morawski, S. D. Caruthers, R. W. Fuhrhop, H. Zhang, T. A. Williams, J. S. Allen, E. K. Lacy, J. D. Robertson, G. M. Lanza and S. A. Wickline, Circulation, 2003, 108, 2270–2274 CrossRef CAS.
- J. L. Major and T. J. Meade, Acc. Chem. Res., 2009, 42, 893–903 CrossRef CAS.
- M. J. Allen and T. J. Meade, JBIC, J. Biol. Inorg. Chem., 2003, 8, 746–750 CrossRef CAS.
- M. J. Allen, K. W. MacRenaris, P. N. Venkatasubramanian and T. J. Meade, Chem. Biol., 2004, 11, 301–307 CrossRef CAS.
- J. Endres Paul, W. Macrenaris Keith, S. Vogt, J. Allen Matthew and J. Meade Thomas, Mol. Imaging, 2006, 5, 485–497 CAS.
- J. Lee, J. E. Burdette, K. W. MacRenaris, D. Mustafi, T. K. Woodruff and T. J. Meade, Chem. Biol. (Cambridge, MA, U.S.), 2007, 14, 824–834 Search PubMed.
- T. Paunesku, S. Vogt, B. Lai, J. Maser, N. Stojicevic, K. T. Thurn, C. Osipo, H. Liu, D. Legnini, Z. Wang, C. Lee and G. E. Woloschak, Nano Lett., 2007, 7, 596–601 CrossRef CAS.
- M. M. Modo and J. W. W. Bulte, Molecular and Cellular MR Imaging, CRC, Boca Raton, 2007 Search PubMed.
- G. Jia, H. Wang, L. Yan, X. Wang, R. Pei, T. Yan, Y. Zhao and X. Guo, Environ. Sci. Technol., 2005, 39, 1378–1383 CrossRef CAS.
- R. J. Narayan, W. Wei, C. Jin, M. Andara, A. Agarwal, R. A. Gerhardt, C.-C. Shih, C.-M. Shih, S.-J. Lin, Y.-Y. Su, R. Ramamurti and R. N. Singh, Diamond Relat. Mater., 2006, 15, 1935–1940 CrossRef CAS.
- S.-J. Yu, M.-W. Kang, H.-C. Chang, K.-M. Chen and Y.-C. Yu, J. Am. Chem. Soc., 2005, 127, 17604–17605 CrossRef CAS.
- C.-C. Fu, H.-Y. Lee, K. Chen, T.-S. Lim, H.-Y. Wu, P.-K. Lin, P.-K. Wei, P.-H. Tsao, H.-C. Chang and W. Fann, Proc. Natl. Acad. Sci. U. S. A., 2007, 104, 727–732 CrossRef CAS.
- A. M. Schrand, L. Dai, J. J. Schlager, S. M. Hussain and E. Osawa, Diamond Relat. Mater., 2007, 16, 2118–2123 CrossRef CAS.
- R. Weissleder, A. S. Lee, A. J. Fischman, P. Reimer, T. Shen, R. Wilkinson, R. J. Callahan and T. J. Brady, Radiology (Easton, Pa.), 1991, 181, 245–249 Search PubMed.
- R. Weissleder, A. Moore, U. Mahmood, R. Bhorade, H. Benveniste, E. A. Chiocca and J. P. Basilion, Nat. Med. (N.Y.), 2000, 6, 351–354 CrossRef CAS.
- J. Rockenberger, E. C. Scher and A. P. Alivisatos, J. Am. Chem. Soc., 1999, 121, 11595–11596 CrossRef CAS.
- J. Park, K. An, Y. Hwang, J.-G. Park, H.-J. Noh, J.-Y. Kim, J.-H. Park, N.-M. Hwang and T. Hyeon, Nat. Mater., 2004, 3, 891–895 CrossRef CAS.
- N. R. Jana, Y. Chen and X. Peng, Chem. Mater., 2004, 16, 3931–3935 CrossRef CAS.
- S. Sun, H. Zeng, D. B. Robinson, S. Raoux, P. M. Rice, S. X. Wang and G. Li, J. Am. Chem. Soc., 2004, 126, 273–279 CrossRef CAS.
- Z. Li, H. Chen, H. Bao and M. Gao, Chem. Mater., 2004, 16, 1391–1393 CrossRef CAS.
- J. Wan, W. Cai, X. Meng and E. Liu, Chem. Commun., 2007, 5004–5006 RSC.
- S. M. Moghimi, A. C. Hunter and J. C. Murray, Pharmacol. Rev., 2001, 53, 283–318 CAS.
- T. Neuberger, B. Schoepf, H. Hofmann, M. Hofmann and B. Von Rechenberg, J. Magn. Magn. Mater., 2005, 293, 483–496 CrossRef CAS.
- J. Xie, K. Chen, H.-Y. Lee, C. Xu, A. R. Hsu, S. Peng, X. Chen and S. Sun, J. Am. Chem. Soc., 2008, 130, 7542–7543 CrossRef CAS.
- F. Hu, K. W. MacRenaris, E. A. Waters, T. Liang, E. A. Schultz-Sikma, A. L. Eckermann and T. J. Meade, J. Phys. Chem. C, 2009, 113, 20855–20860 CrossRef CAS.
- H. Duan, M. Kuang, X. Wang, Y. A. Wang, H. Mao and S. Nie, J. Phys. Chem. C, 2008, 112, 8127–8131 CrossRef CAS.
- T. J. Daou, J. M. Greneche, G. Pourroy, S. Buathong, A. Derory, C. Ulhaq-Bouillet, B. Donnio, D. Guillon and S. Begin-Colin, Chem. Mater., 2008, 20, 5869–5875 CrossRef CAS.
- E. W. LaConte Leslie, N. Nitin, O. Zurkiya, D. Caruntu, J. O'Connor Charles, X. Hu and G. Bao, J. Magn. Reson. Imaging, 2007, 26, 1634–1641 CrossRef.
- M. Aslam, E. A. Schultz, T. Sun, T. Meade and V. P. Dravid, Cryst. Growth Des., 2007, 7, 471–475 CrossRef CAS.
- H. M. Joshi, Y. P. Lin, M. Aslam, P. V. Prasad, E. A. Schultz-Sikma, R. Edelman, T. Meade and V. P. Dravid, J. Phys. Chem. C, 2009, 113, 17761–17767 CrossRef CAS.
- A. Roch, Y. Gossuin, R. N. Muller and P. Gillis, J. Magn. Magn. Mater., 2005, 293, 532–539 CrossRef.
- J. Ge, Y. Hu, M. Biasini, W. P. Beyermann and Y. Yin, Angew. Chem., Int. Ed., 2007, 46, 4342–4345 CrossRef CAS.
- F. Hu, K. W. MacRenaris, E. A. Waters, E. A. Schultz-Sikma, A. L. Eckermann and T. J. Meade, Chem. Commun., 2010, 46, 73–75 RSC.
- J. Qin, S. Laurent, Y. S. Jo, A. Roch, M. Mikhaylova, Z. M. Bhujwalla, R. N. Muller and M. Muhammed, Adv. Mater. (Weinheim, Ger.), 2007, 19, 1874–1878 CrossRef CAS.
- W. S. Seo, J. H. Lee, X. Sun, Y. Suzuki, D. Mann, Z. Liu, M. Terashima, P. C. Yang, M. V. McConnell, D. G. Nishimura and H. Dai, Nat. Mater., 2006, 5, 971–976 CrossRef CAS.
- K. C. Barick, M. Aslam, P. V. Prasad, V. P. Dravid and D. Bahadur, J. Magn. Magn. Mater., 2009, 321, 1529–1532 CrossRef CAS.
- K. C. Barick, M. Aslam, Y.-P. Lin, D. Bahadur, P. V. Prasad and V. P. Dravid, J. Mater. Chem., 2009, 19, 7023–7029 RSC.
- C. R. Sun, K. Du, C. Fang, N. Bhattarai, O. Veiseh, F. Kievit, Z. Stephen, D. H. Lee, R. G. Ellenbogen, B. Ratner and M. Q. Zhang, ACS Nano, 2010, 4, 2402–2410 CrossRef CAS.
- M. Oostendorp, K. Douma, T. M. Hackeng, M. A. M. J. van Zandvoort, M. J. Post and W. H. Backes, Contrast Media Mol. Imaging, 2010, 5, 9–17 Search PubMed.
| This journal is © The Royal Society of Chemistry 2010 |
