Hydrothermal synthesis of α-Fe2O3@SnO2 core–shell nanotubes for highly selective enrichment of phosphopeptides for mass spectrometry analysis†
Jin
Lu
,
Dawei
Qi
,
Chunhui
Deng
*,
Xiangmin
Zhang
and
Pengyuan
Yang
Department of Chemistry & Institutes of Biomedical Sciences, Fudan University, Shanghai, 200433, China. E-mail: chdeng@fudan.edu.cn; Fax: +86-21-65641740
First published on 6th September 2010
Abstract
In this work, we synthesized α-Fe2O3@SnO2 core–shell structure nanotubes by a facile two-step hydrothermal method for selective enrichment of phosphopeptides. The core–shell structure nanotubes were found to have outer diameters of 90–110 nm, thicknesses of 30 nm, and lengths of 260–280 nm. SnO2 nanoparticles with an average crystallite size of around 5 nm form a layer of about 10 nm on both walls of the α-Fe2O3 nanotubes. To demonstrate their ability for selective enrichment of phosphopeptides, we applied α-Fe2O3@SnO2 nanotubes to the isolation and enrichment of the phosphopeptides from standard protein digestion and real samples. The enriched peptides were analyzed by MALDI-MS and LC-ESI MS. Experiment results demonstrate that SnO2 coated α-Fe2O3 nanotubes show excellent potential for selective enrichment of phosphopeptides.
Introduction
Mass spectrometry is the tool of choice to investigate protein phosphorylation, which plays a vital role in cell regulation and diseases such as cancer.1 However, low abundances of phosphopeptides and low ionization efficiency of phosphopeptides typically necessitate isolation and concentration of phosphopeptides prior to MS analysis. Different affinity-based preseparation strategies including immunoprecipitation, chemical-modification strategies, strong cation exchange chromatography, immobilized metal affinity chromatography (IMAC) and metal oxide affinity chromatography (MOAC) have been used for this purpose.2 Using the metal oxides (such as TiO2, ZrO2) microspheres for phosphopeptides enrichment has grown rapidly in recent years because of high recovery and selectivity, even without esterification of the unphosphorylated peptides.3 SnO2 is one of the most intensively studied materials owing to its myriad technologically important applications such as gas sensors, photocatalysis and lithium rechargeable batteries.4 Recently, SnO2 has been employed as affinity probe for phosphopeptides enrichment, and was demonstrated having excellent enrichment selectivity.5 More recently, our group have successfully synthesized core–shell Fe3O4@C@SnO2 magnetic microspheres and applied them for phosphopeptides enrichment.6In recent years one-dimensional nanostructured materials have attracted considerable attention because of their unique physical properties and potential applications in sensors, magnetics, electric transportation, optics, and even as building blocks for nanoscale devices.7 Particularly since carbon nanotubes were discovered in 1991,8 nanotubes become the most popular materials owning to their unique physical and chemical properties such as one-dimensional elongated geometry, high surface-to-volume ratio, accessibility to the inner and outer surfaces and unique electronic metal/semiconductor properties.9 Hence much effort has been devoted to the controllable synthesis of inorganic nanotubes. Besides carbon nanotubes and carbon nanotube based materials, metal oxide nanotubes such as TiO2 nanotubes10 and mixed metal or metal oxide nanotubes11are all extensively studied. Hematite (α-Fe2O3) is the most stable iron oxide under ambient conditions and is of great importance as a ferro fluid and magnetic recording material.12 Because of its excellent properties, much attention has been directed to the controlled synthesis of hematite.13 Recently, Jia et al. have synthesized single-crystalline hematite nanotubes by a hydrothermal reaction method and demonstrated a feasible, large-scale, and controllable synthesis of single-crystalline Fe2O3 nanostructures.14
As described above, nanotubes are one-dimensional structure materials which have a high surface-to-volume ratio and accessibility to inner and outer surfaces. This can be beneficial for specifically binding phosphopeptides. Due to the perfect enrichment property of SnO2, in this work, we combined the two advantageous properties together, synthesized α-Fe2O3@SnO2 core–shell nanotubes and applied them into the enrichment of phosphopeptides. Briefly, the α-Fe2O3 nanotubes were synthesized by a convenient hydrothermal reaction. Then, the α-Fe2O3 nanotubes were submitted to another hydrothermal reaction with stannate trihydrate (K2SnO3·3H2O) in an ethanol–water mixture with urea as a promoter, resulting in α-Fe2O3@SnO2 core–shell nanotubes. Finally, enrichment efficiency and selectivity of the α-Fe2O3@SnO2 nanotubes were demonstrated.
Results and discussion
Synthesis and characterization of α-Fe2O3@SnO2 nanotubes
The synthesis strategy of α-Fe2O3@SnO2 nanotubes was shown in the Scheme 1(a). The single-crystalline α-Fe2O3 nanotubes were synthesized by the solvothermal reaction of an FeCl3 solution in the presence of NH4H2PO4 at 220 °C for 48h. Transmission electron microscope (TEM) observation indicates that the synthesized α-Fe2O3 nanotubes have length of 235 ± 15 nm, outer diameter of about 70 nm and thickness of ca. 10 nm (Fig. 1a). After subsequent hydrothermal deposition of SnO2, the nanotube structure was well retained (Fig. 1b), and the surface of hematite nanotubes were conformally covered by numerous SnO2 nanoparticles, resulting in core–shell structured α-Fe2O3@SnO2 nanotubes. Based on estimation from the TEM images, the composite nanotubes have an outer diameter of 100 ± 10 nm, thickness of 30 ± 2 nm, and length of 270 ± 10 nm. These results suggest that SnO2 nanoparticles form a layer of about 10 nm on both walls of the α-Fe2O3 nanotubes. Furthermore, from the high-resolution TEM image (Fig. 1b, inset), SnO2 nanoparticles with an average diameter less than 5 nm can be seen on the nanotubes' surface, and the α-Fe2O3@SnO2 nanotubes have a rough surface because the SnO2 nanoparticles are randomly deposited on the nanotubes' surface. The rough surface may provide a higher specific area and is beneficial for specifically binding phosphopeptides when they are used for enrichment application. The energy-dispersive X-ray analysis (EDXA) (Fig. 1c) of the obtained α-Fe2O3@SnO2 nanotubes by illuminating electron beams on the obtained core–shell nanotubes reveals the existence of Fe, Sn and O elements, further confirming the formation of SnO2 species on the α-Fe2O3 nanotubes. Besides, the Cu peaks in the spectrum originate from the Cu TEM grid.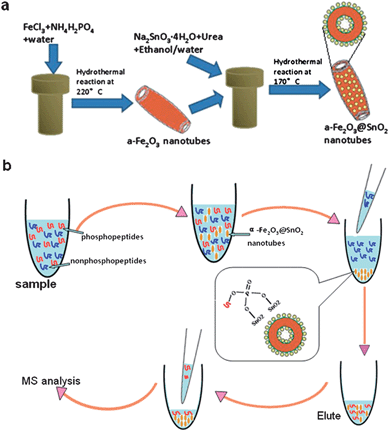 | ||
| Scheme 1 (a) The synthesis route to core–shell structured α-Fe2O3@SnO2 nanotubes; (b) procedures for the analysis of phosphopeptides by using α-Fe2O3@SnO2 nanotubes. | ||
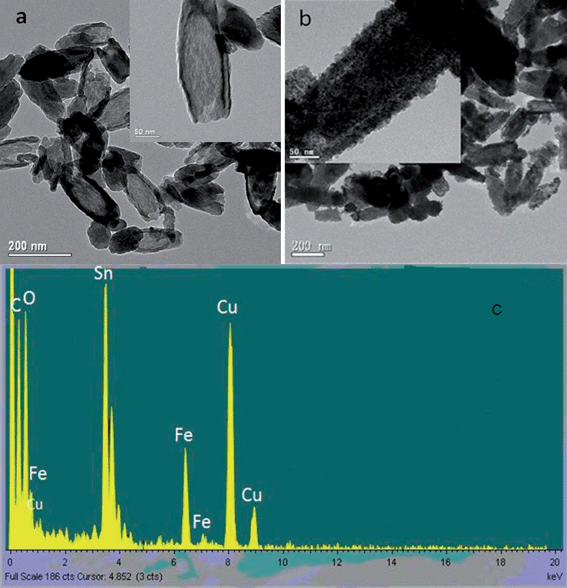 | ||
| Fig. 1 TEM images of the (a) α-Fe2O3 nanotubes and (b) α-Fe2O3@SnO2 core–shell nanotubes. (c) The energy dispersive X-ray (EDX) spectrum data of α-Fe2O3@SnO2 core–shell nanotubes | ||
Fourier transform infrared (FT-IR) spectroscopy was employed to further characterize the as-made α-Fe2O3 and α-Fe2O3@SnO2 nanotubes. The α-Fe2O3 nanotubes show absorption bands ∼470 and ∼540 cm−1 for Fe–O vibrations (Fig. 2a).15 After coating with SnO2, the FT-IR spectrum of α-Fe2O3@SnO2 nanotubes (Fig. 2b) shows a new broad absorption band at 600–700 cm−1, which is ascribed to O–Sn–O vibrations.16 These results provide additional evidence for the successful synthesis of α-Fe2O3@SnO2 core/shell nanotubes.
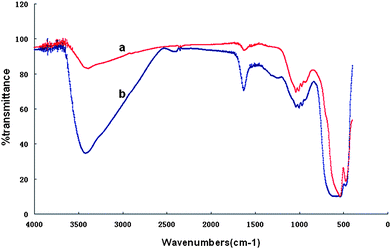 | ||
| Fig. 2 The FTIR spectra of (a) α-Fe2O3 nanotubes and (b) α-Fe2O3@SnO2 nanotubes. | ||
Fig. 3 shows the wide-angle X-ray diffraction (WAXRD) pattern of the α-Fe2O3@ SnO2 nanotubes, where well-resolved diffraction peaks can be clearly visible and exactly indexed to α-Fe2O3 (hematite, JCPDs No. 33-0664) and SnO2 nanocrystal (cassiterite, JCPDs No. 41-1445), respectively. Calculation based on the Scherrer formula from the diffraction of SnO2 reveals a mean crystallite size of about 3.0 nm. These results suggest that the α-Fe2O3@SnO2 core–shell nanotubes are successfully fabricated by the method in this work.
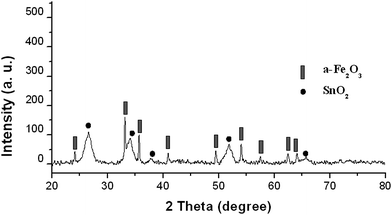 | ||
| Fig. 3 XRD patterns of the α-Fe2O3@SnO2 nanotubes. | ||
The porosity of the core/shell nanotubes were characterized by nitrogen sorption at 77 K. Fig. 4 shows the nitrogen adsorption and desorption isotherms recorded on Micromeritics ASAP 2020 instrument. The nitrogen adsorption–desorption isotherms of α-Fe2O3@SnO2 core/shell nanotubes (Fig. 4a) have irregular type-IV curves, indicative of nanopores with a broad pore size distribution. The Brunauer–Emmett–Teller (BET) surface area is calculated to be 54 m2 g−1. Considering the high density of SnO2 and iron oxide, such a relative high surface is mainly attributed to the rough surface of the composite nanotubes. Calculation based on Barrett–Joyner–Halenda (BJH) model by using the desorption branch gives a multi-modal pore size distribution of the pore size distribution profile, where the size in the range of 8–16 nm may come from the interstitial voids among the packed SnO2 nanoparticles. For comparison, we also characterized the porosity of the α-Fe2O3 nanotubes by nitrogen sorption (Fig. 4b), there is minor adsorption observed at very high relative pressure range (close to 1.0) due to the interstitials among the nanotubes. The BET surface area is measured to be about 18.3 m2 g−1, much less than the α-Fe2O3@SnO2 nanotubes. The pore size distribution (Fig. 4b, inset) indicates the presence of pores of 30.1 and 50.3 nm, respectively, which may be from the packed Fe2O3 nanotubes. These results confirmed that the pore distribution in the range of 1.0 –4.0 nm in Fig. 4a is from the packed SnO2 nanoparticles.
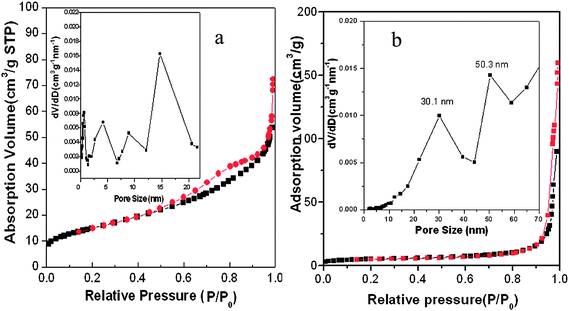 | ||
| Fig. 4 Nitrogen adsorption and desorption isotherms of (a) α-Fe2O3@SnO2 nanotubes and (b) α-Fe2O3 nanotubes at 77 K and their corresponding pore-size distribution (insets) calculated by BJH method from desorption branch. | ||
Selective enrichment of phosphopeptides from tryptic digestion of standard proteins
The α-Fe2O3@SnO2 nanotubes were first used to isolate phosphopeptides from tryptic digests of β-casein, which is commonly contaminated with a trace of α-casein. A direct analysis of 8 × 10⁻⁸ M β-casein by MALDI-TOF MS indicates that nonphosphopeptides dominate the spectrum and only two phosphopeptides (marked with an asterisk) were detected, with weak intensity (Fig. 5a). However, after enrichment by α-Fe2O3@SnO2 nanotubes, the signals for the β-casein phosphopeptides (marked with a black asterisk) significantly increase and dominate the spectrum (Fig. 5b). Furthermore, two phosphopeptides derived from α-casein (marked with a red asterisk) were also observed and no nonphosphorylated peptides were observed, indicating high enrichment efficiency of the nanotubes. The signals marked with a circumflex could be assigned to a dephosphorylated fragment of phosphopeptide through loss of H3PO4.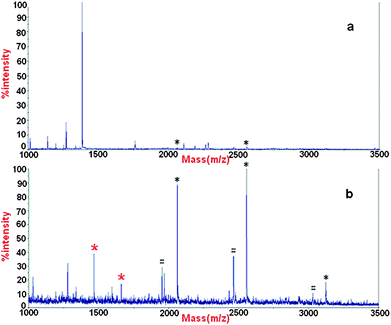 | ||
| Fig. 5 MALDI mass spectrum of peptides derived from β-casein (a) without enrichment and (b) enriched by α-Fe2O3@SnO2 nanotubes. Black * phosphopeptides of β-casein, red * phosphopeptides of α-casein, # the metastable losses of phosphoric acid. | ||
To evaluate the specificity of enrichment of phosphopeptides with α-Fe2O3@SnO2 nanotubes, a relative complex sample, peptide mixture originating from a tryptic digest of β-casein (8 × 10⁻⁸M) and bovine serum albumin (4 × 10⁻⁶ M) with a ratio of 1![[thin space (1/6-em)]](https://www.rsc.org/images/entities/char_2009.gif) :50, was used as the test sample. The spectrum obtained for MALDI-TOF MS of the peptide mixture is shown in Fig. 6a. The MS spectrum for the analysis of phosphopeptides enriched with α-Fe2O3@SnO2 nanotubes is shown in Fig. 7b. It is obvious that almost no nonphosphopetides were described in Fig. 7b. The differences suggest that α-Fe2O3@SnO2 nanotubes could specifically isolate and enrich the phosphopeptides.
:50, was used as the test sample. The spectrum obtained for MALDI-TOF MS of the peptide mixture is shown in Fig. 6a. The MS spectrum for the analysis of phosphopeptides enriched with α-Fe2O3@SnO2 nanotubes is shown in Fig. 7b. It is obvious that almost no nonphosphopetides were described in Fig. 7b. The differences suggest that α-Fe2O3@SnO2 nanotubes could specifically isolate and enrich the phosphopeptides.
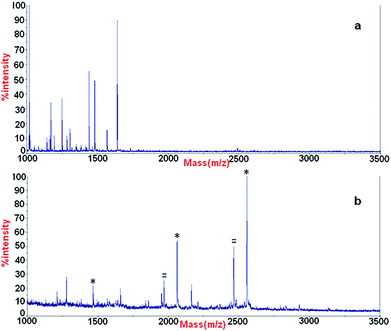 | ||
| Fig. 6 MALDI mass spectrum of (a) peptide mixture originated from β-casein and BSA with a ratio of 1:50 and (b) phosphopeptiedes enriched form peptide mixture using α-Fe2O3@SnO2 nanotubes. * phosphopeptides, # the metastable losses of phosphoric acid. | ||
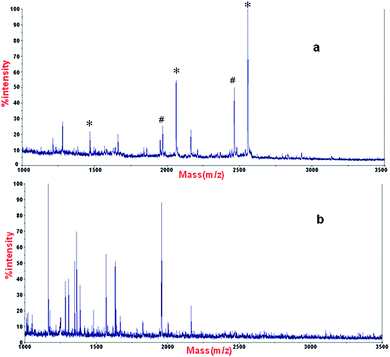 | ||
| Fig. 7 MALDI mass spectra of phosphopeptides enriched from β-casein and BSA with a ratio of 1:50 with (a) α-Fe2O3@SnO2 nanotubes, and (b) α-Fe2O3 nanotubes. * phosphopeptides, # the metastable losses of phosphoric acid. | ||
As we know, Fe2O3 has enrichment properties as well,17 so we made control comparison experiments on the pure α-Fe2O3 nanotubes. The same experiment condition was used for both materials. After enrichment of peptide mixture originating from a tryptic digest of β-casein (8 × 10⁻⁸M) and bovine serum albumin (4 × 10⁻⁶ M) with a ratio of 1:50 by both materials respectively, the analysis of MALDI-TOF MS is shown in Fig. 7. For α-Fe2O3@SnO2 nanotubes, all the theoretic phosphopeptides were identified and almost no unphosphorylated peptides can be seen in the spectrum, but for α-Fe2O3, almost all the identified peptides are unphosphorylated peptides. The results indicate that α-Fe2O3@SnO2 nanotubes have better enrichment specificity than α-Fe2O3 nanotubes.
To study the detection limit of the α-Fe2O3@SnO2 nanotubes used for enrichment of phosphopeptides, we applied the nanotubes to the enrichment from β-casein digest with different concentrations. The mass spectra are shown in Fig. 8. It can be seen that when the concentration of β-casein digest is 2 × 10⁻⁹ M, the ion signals from the phosphopeptides can still be detected, which indicates the high detection sensitivity of α-Fe2O3@SnO2 nanotubes. The results suggest that α-Fe2O3@SnO2 nanotubes we reported here are promising materials for enrichment of phosphopeptides.
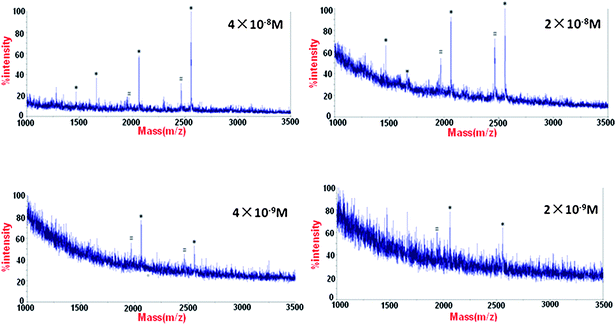 | ||
| Fig. 8 MALDI mass spectra of phosphopeptides enriched from β-casein with different concentration using α-Fe2O3@SnO2 nanotubes. * phosphopeptides, # the metastable losses of phosphoric acid. | ||
To investigate the recovery for the enrichment, first we extracted three phosphopetides by enriching from β-casein using TiO2 materials and then separated them averagely into two. One was used to be analyzed by MALDI-TOF MS and it was shown in Fig. 9a. For the other, we added two standard unphosphorylated peptides with molecular weight 1046(DRVYIHPF) and 1138(PHPFHFFVYK), respectively. Finally the mixture was enriched using our α-Fe2O3@ SnO2 nanotubes. Fig. 9b and Fig. 9c show the MS spectra of the peptide mixture before and after the enrichment using α-Fe2O3@SnO2, respectively. From the relative intensity of the spectra before and after enriching using α-Fe2O3@ SnO2 nanotubes, the recovery for the three phosphopetides is about 85%, 83% and 77%, respectively.
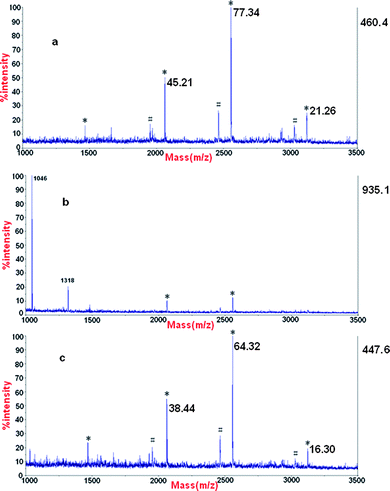 | ||
| Fig. 9 MALDI mass spectra of (a) phosphopeptides enriched from β-casein using TiO2, (b) a mixture of above-mentioned phosphopeptides enriched using TiO2 and standard nonphosphopeptides and (c) phosphopeptides enriched using α-Fe2O3@SnO2 nanotubes from above-mentioned mixture. * phosphopeptides, # the metastable losses of phosphoric acid. | ||
Selective enrichment of phosphopeptides from tryptic digestion of rat brain
To further evaluate the performance of α-Fe2O3@SnO2 nanotubes for phosphopeptides enrichment, the nanotubes were employed to enrich phosphopeptides from tryptic digest of rat brain. The peptides eluted from α-Fe2O3@SnO2 nanotubes were analyzed by LC-ESI-MS. Four technical replicate runs were conducted. The acquired MS/MS and MS/MS/MS spectra were searched separately by the Sequest program as the Experimental section describes. The searching results were filtered with Xcorr values obtained by statistical calculation of reverse database searching results. For p < 0.05, the Xcorr > 2.0, 2.9, and 3.73 for singly, doubly, and triply charged ions, respectively and ΔCn > 0.1 were used to filter the MS/MS database searching results. Due to the poor quality of the spectra for the phosphopeptides, the MS/MS/MS spectra were used to validate the phosphopeptides identified from the MS/MS. For the MS/MS/MS spectra, Xcorr > 1.5, 2.4, and 2.96 and ΔCn > 0.1 were used as criteria. Comparing the phosphopeptides identified from MS/MS and MSMS/MS/MS spectra, it was found that the sequences of 33 unique phosphopeptides were the same in both cases. Fig. 10 is an example for identification of doubly charged phosphopeptide GAEEEEEEEDDDSpEEEIK. From the spectra it can be seen that b- and y-ion series are consistent with the theoretically predicted peaks in both MS/MS and MS/MS/MS spectra, and in MS/MS spectrum that peak at m/z 1045.3 represents the doubly charged form of the selected precursor ion at m/z 2190.7 by losing H3PO4 group. Besides the above 33 phosphopeptides, more phosphopeptides, including multiply phosphorylated peptides, have been identified by the MS/MS spectra, which could not be validated by MS/MS/MS spectrum. However, until now, strictly universal validation criteria have not been established and defined; there are too many subjective factors for interpretation of the spectra of multiply phosphorylated peptides. Therefore, only singly phosphorylated peptide identifications were validated manually in this work. After manual validation, an additional 106 singly phosphorylated peptides were finally identified from MS/MS spectra. Totally, 139 phosphorylation sites-124 on serine (89.21%), 14 on threonine (10.07%) and 1 on tyrosine (0.72%)-were identified. The detailed information of the phosphopeptides enriched from tryptic digests of rat brain by using α-Fe2O3@SnO2 nanotubes are listed in the ESI (see Supplementary Table S1†).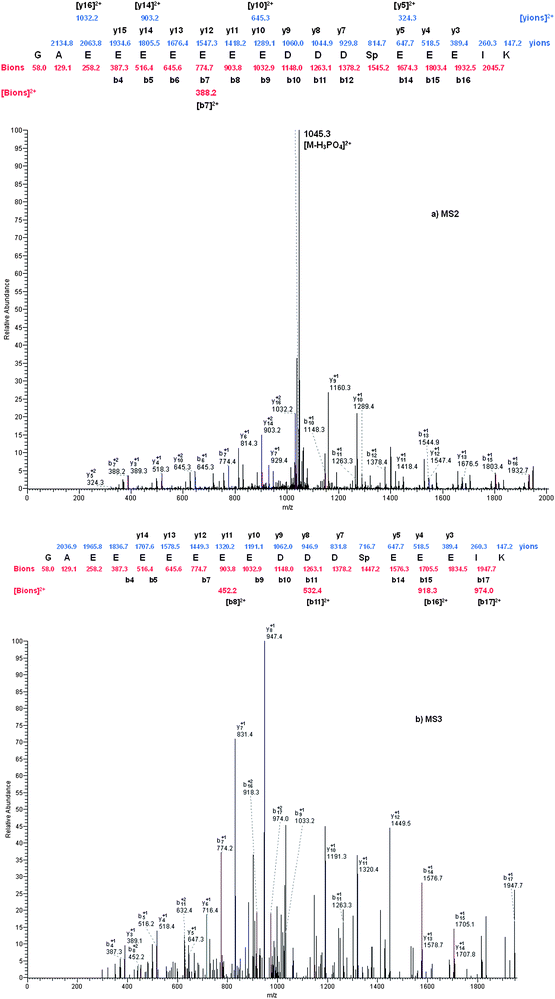 | ||
| Fig. 10 (a) MS2 spectrum of the doubly charged form of a singly phosphorylated peptide identified from the tryptic digest of rat brain. The identified phosphopeptide was K.GAEEEEEEEDDDSpEEEIK.A. (b) MS3 spectrum of the doubly charged neutral loss peak at m/z 1045. | ||
Conclusions
In this work, we successfully synthesized the new material, core–shell structure α-Fe2O3@ SnO2 nanotubes, and successfully demonstrated their potential for efficient and selective enrichment of phosphopeptides. α-Fe2O3@ SnO2 nanotubes were demonstrated to have the ability for selective enrichment of phosphopeptides by using standard protein digestion. Furthermore, we applied α-Fe2O3@ SnO2 nanotubes for selective enrichment of phosphopeptides from tryptic digestion of rat brain, the experimental results showed that the approach based on α-Fe2O3@ SnO2 nanotubes would be effective for phosphopeptides enrichment.Experimental
Bovine β-casein, bovine serum albumin, trypsin (from bovine pancreas, TPCK treated), ammonium bicarbonate (NH4HCO3) and 2, 5-dihydroxybenzoic acid (DHB) were purchased from Sigma Chemical (St. Louis, MO). Acetonitrile was purchased from Merck (Darmstadt, Germany). All aqueous solutions were prepared using Milli-Q water by Milli-Q system (Millipore, Bedford, MA). All other chemicals and reagents were of the highest grade commercially available.Synthesis of α-Fe2O3@SnO2 nanotubes
Single-crystalline hematite nanotubes used in the work were prepared through a hydrothermal reaction according to the reported method.8 Briefly, 3.2 mL of aqueous FeCl3 solution (0.5M) and 2.88 ml of aqueous NH4H2PO4 solution (0.02M) were mixed with vigorous stirring. Distilled water was then added to a final volume of 80 mL. After stirring for ten minutes, the resulting solution was transferred into a Teflon-lined stainless-steel autoclave with a capacity of 100 mL. The autoclave was sealed and heated at 220 °C for 48 h. After the autoclave cooled down naturally, the precipitate was separated by centrifugation, washed with deionzed water and absolute ethanol, and dried under vacuum at 80 °C.For hydrothermal SnO2 deposition, the preparation protocol we used was the same as the SnO2 deposition protocol in our previous work.11 Briefly, 120 mg of α-Fe2O3 nanotubes were dispersed in 96 mL of ethanol–water (37.5 vol% ethanol) mixture. To this suspension, urea (2.25 g) and natrium stannate tetrahydrate (329 mg; Na2SnO3·4H2O) were added. After shaking by hand for about 5 min until the salts dissolved, the suspension was transferred to a Teflon-lined stainless-steel autoclave (200 mL) for heating in an oven at 170 °C for 36 h. After the autoclave cooled down naturally, the precipitate was separated by centrifugation, washed three times with ethanol and deionized water.
Sample preparation
Bovine β-casein and bovine serum albumin were dissolved in 25 mM NH4HCO3 buffer at pH 8.3 and treated with trypsin (2%, w/w) for 16 h at 37 °C respectively. Before the digestion, BSA was reduced with DTT and carboxamidomethylated with iodoacetamide. Bovine β-casein was digested directly.Preparation of the lysate of rat brain
Rats were sacrificed and the brains were promptly removed and placed in ice-cold homogenization buffer consisting of 7 M urea, 2M thiourea and and a mixture of protease inhibitor (1mM phenylmethanesulfonylfluoride) and phosphatase inhibitors (0.2 mM Na3VO4, 1 mM NaF). After mincing with scissors and washing to remove blood, the brains were homogenized in a Pottter-Elvejhem homogenizer with a Teflon piston, using 5 mL of the homogenization buffer per 1 g of tissue. The suspension was homogenized for approximately 2 min, vortexed at 0 °C for 30 min, and centrifuged at 22000 g for 1.5 h. The supernatant contained the total brain proteins.
Appropriate volumes of protein sample were precipitated as above, lyophilized to dryness, and redissolved in reducing solution (6M guanidine hydrochloride, 100 mM NH4HCO3, pH 8.3) with the protein concentration adjusted to 2μg μL−1. Then, 200 μg of this protein sample (100 μL volume) were mixed with 10 μL of 0.5M DTT. The mixture was incubated at 37 °C for 1 h, and then 20 μL of 0.5 M 2-iodoacetamide were added and incubated for an additional 30 min at 37 °C in the dark. The protein mixtures were exchanged into 50 mM NH4HCO3 buffer, pH 8.5, and incubated with trypsin (40:1) at 37 °C overnight.
Selective enrichment of phosphopeptides from tryptic digestion of standard proteins
The peptide mixtures originating from tryptic digestions were diluted by 50% acetonitrile and 0.1% TFA aqueous solution (v/v). First, a suspension of α-Fe2O3@SnO2 nanotubes (400 μg) was added into 200 μL of diluted peptide mixture. Then the mixed solutions were vibrated at 25 °C for 30 min. After that, the mixed solutions were centrifuged and the pellucid solutions were taken out. Then the α-Fe2O3@SnO2 nanotubes were washed three times with 50% acetonitrile and 0.1% TFA aqueous solution (v/v). Finally the α-Fe2O3@SnO2 nanotubes were eluted with 5 μL of 0.4 M ammonia aqueous solution for 10 min and the eluate was analyzed by MADIL-TOF MS.Selectively enrichment of phosphopeptides from tryptic digestion of rat brain
The tryptic digests of rat brain were lyophilized and then dissolved in loading buffer. Two micrograms of α-Fe2O3@SnO2 nanotubes were added into 400 μL of diluted rat brain digests. Then the mixed solutions were shaken at 25 °C for 60 min. After that, the mixed solutions were centrifuged and the pellucid solutions were taken out. The α-Fe2O3@SnO2 nanotubes were washed three times with 50% acetonitrile and 0.1% TFA aqueous solution (v/v). Then the α-Fe2O3@SnO2 nanotubes were eluted with 50 μL of 0.4 M ammonia aqueous solution for 30 min. The eluate was lyophilized and then dissolved in 35 μL loading phase. Finally, the solution was submitted for LC–ESI-MS analysis.MALDI-MS analysis
The above phosphopeptides eluted from α-Fe2O3@SnO2 nanotubes were deposited on the MALDI target using dried droplet method. 0.5 μL of the washing buffer was deposited on the plate and then another 0.5 μL of a mixture of 20 mg mL−1 2,5-dihydroxybenzoic acid in 50% acetonitrile and 1% H3PO4 aqueous solution (v/v) was introduced as a matrix. MALDI-TOF MS experiments were performed in positive ion mode on a 4700 Proteomics Analyzer (Applied Biosystems, USA) with the Nd-YAG laser at 355 nm, a repetition rate of 200 Hz and an acceleration voltage of 20 kV.Nano-flow LC–ESI-MS analysis
Nano-LC MS/MS experiments were performed on an HPLC system composed by 2 LC-20AD nano-flow LC pumps and 1 LC-20AB micro-flow LC pump (all from Shimadzu Corporation, Tokyo, Japan) connected to an LTQ mass spectrometer (Thermo Electron Corporation, San Jose, CA). Sample injection was done via an SIL-20 AC auto-sampler (Shimadzu Corporation, Tokyo, Japan) and loaded onto a CAPTRAP column (0.5 × 2 mm, MICHROM Bioresources Inc., Auburn, CA) for 5 min at a flow rate of 60 μL min−1. The sample was subsequently separated by a PICOFRIT C18 reverse-phase column (0.075 × 100 mm, New Objective Inc., Woburn, MA) at a flow rate of 300 nL min−1. The mobile phases consisted of 5% acetonitrile with 0.1% formic acid (phase A and the loading phase) and 95% acetonitrile with 0.1% formic acid (phase B). To achieve proper separation, a 120-min linear gradient from 5 to 45% phase B was employed. The separated sample was introduced into the mass spectrometer via a 15 μm silica tip (New Objective Inc., Woburn, MA) adapted to a DYNAMIC nano-electrospray source (Thermo Electron Corporation, San Jose, CA). The spray voltage was set at 2.0 kV and the heated capillary at 210 °C. The mass spectrometer was operated in data-dependent mode and each cycle of duty consisted one MS survey scan at the mass range 400–2000 Da, followed by MS2 experiments for 8 strongest peaks and MS3 experiment for the peak corresponding to the neutral loss of 97.97, 48.99, 32.67 Da among the three most intense fragment ions using the LTQ section. Peptides were fragmented in the LTQ section using collision-induced dissociation with helium and the normalized collision energy value set at 35%. Previously fragmented peptides were excluded for 30 s.Peptide sequencing and data interpretation
The peak lists for MS2 and MS3 spectra were generated from the raw data by Bioworks version 3.3 (Thermo Electron) with the following parameters: mass range was 600–3500, intensity threshold was 1400, and minimum ion count was 10. The generated peak lists were searched by the Sequest program included in Bioworks against International Protein Index (IPI) database (IPI rat v3.45 fasta with 40189 entries). The MS/MS spectra were searched with a precursor ion mass tolerance of 2 Da and fragment ion mass tolerance of 1 Da, full tryptic specificity was applied, two missed cleavages were allowed, and fixed modification, carboxyamidomethylation (C); variable modifications, phosphorylation (S, T, Y) and oxidation (M). For the searching with MS/MS/MS data, besides the above settings, dynamic modifications were also set for water loss on Ser and Thr (−18Da). For the identification of phosphopeptides based only on MS/MS or MS/MS/MS spectra, the following criteria were used for filtering the database searching results: cross-correlation value (Xcorr) > 2.0, 2.9, and 3.73 for singly, doubly, and triply charged ions, respectively; delta Cn value (ΔCn) > 0.1. For the phosphopeptide identifications derived from MS/MS/MS spectra used to validate the MS/MS identifications, the following criteria were used: Xcorr > 1.5, 2.4, and 2.96; ΔCn > 0.1. Manual validation was further carried out for peptides passing the above criteria. Criteria used for manual validation included the following. (a) The phosphoric acid neutral loss peak to phosphoserine and phosphothreonine must be the dominant peak. (b) The spectrum must be of good quality with fragment ion clearly above the base-line noise. (c) Sequential members of the b- or y-ion series were observable in the mass spectra. (d) For multiply phosphorylated peptides, the peptides derived from MS2 must be confirmed by MS3 spectra in the same MS cycle.
Characterization of α-Fe2O3@SnO2 nanotubes
The morphologies of the as-synthesized α-Fe2O3@SnO2 nanotubes were studied under transmission electron microscopy (JEM-2100F) and scanning electron microscopy (XL30) respectively. The energy-dispersive X-ray analysis was performed on JEM-2100F. Fourier-transform infrared (FT-IR) spectra were collected on a Nicolet Fourier spectrophotometer, using KBr pellets (USA). Powder X-ray diffraction (XRD) patterns were recorded on a Bruker D4 X-ray diffractometer with Ni-filtered Cu KR radiation (40 kV, 40 mA). Nitrogen adsorption and desorption isotherms were measured using Micromeritics ASAP 2020. The samples were degassed in a vacuum at 200 °C for 8 h prior to measurement. The Brunauer–Emmett–Teller (BET) method was utilized to calculate the specific surface areas (SBET) using adsorption data in a relative pressure range from 0.18 to 0.35. By using the Barrett–Joyner–Halenda (BJH) model, the pore volumes and pore size distributions were derived from the desorption branches of the isotherms, and the total pore volumes (Vt) were estimated from the adsorbed amount at a relative pressure P/P0 of 0.992.Acknowledgements
The work was supported by the National Natural Science Foundation of China (21075022, 20875017, 20735005), the Technological Innovation Program of Shanghai (09JC1401100), the National Basic Research Priorities Program (2007CB914100/3), and Shanghai Leading Academic Discipline Project (B109).References
- (a) A. Sickmann and H. E. Meyer, Proteomics, 2001, 1, 200 CrossRef CAS; (b) A. Chi, C. Huttenhower, L. Y. Geer, J. J. Coon, J. E. P. Syka, D. L. Bai, J. Shabanowitz, D. J. Burke, O. G. Troyanskaya and D. F. Hunt, Proc. Natl. Acad. Sci. U. S. A., 2007, 104, 2193 CrossRef CAS; (c) S. B. Ficarro, M. L. McCleland, P. T. Stukenberg and D. J. Burke, Nat. Biotechnol., 2002, 20, 301 CrossRef CAS.
- (a) S. Ficarro, O. Chertihin and V. A. Westbrook, J. Biol. Chem., 2003, 278, 11579 CrossRef CAS; (b) T. S. Nuhse, A. Stensballe, O. N. Jensen and S. C. Peck, Mol. Cell. Proteomics, 2003, 2, 1234 CrossRef; (c) A. Gruhler, J. V. Olsen, S. Mohammed and P. Mortensen, Mol. Cell. Proteomics, 2005, 4, 310 CrossRef CAS; (d) Y. Oda, T. Nagasu and B. T. Chait, Nat. Biotechnol., 2001, 19, 379 CrossRef CAS; (e) H. Zhou, J. D. Watts and R. Aebersold, Nat. Biotechnol., 2001, 19, 375 CrossRef CAS; (f) Y. Li, D. W. Qi, C. H. Deng, P. Y. Yang and X. M. Zhang, J. Proteome Res., 2008, 7, 1767 CrossRef CAS; (g) X. Q. Xu, C. H. Deng, M. X. Gao, W. J. Yu, P. Y. Yang and X. M. Zhang, Adv. Mater., 2006, 18, 3289 CrossRef CAS.
- (a) Y. Li, J. S. Wu, D. W. Qi, X. Q. Xu, C. H. Deng, P. Y. Yang and X. M. Zhang, Chem. Commun., 2008, 564 RSC; (b) M. R. Larsen, T. E. Thingholm, O. N. Jensen, P. Roepstorff and T. J. D. Jorgensen, Molecular & Cellular Proteomics, 2005, 4, 873 Search PubMed; (c) F. Torta, M. Fusi, C. S. Casari, C. E. Bottani and A. Bachi, J. Proteome Res., 2009, 8, 1932–1942 CrossRef CAS; (d) D. W. Qi, J. Lu, C. H. Deng and X. M. Zhang, J. Chromatogr., A, 2009, 1216, 5533 CrossRef CAS; (e) Y. Li, H. Q. Lin, C. H. Deng, P. Y. Yang and X. M. Zhang, Proteomics, 2008, 8, 238 CrossRef CAS.
- (a) X. W. Lou, C. L. Yuan and L. A. Archer, Adv. Mater., 2007, 19, 3328 CrossRef CAS; (b) Y. J. Chen, P. Gao, R. X. Wang, C. L. Zhu, L. J. Wang, M. S. Cao and H. B. Jin, J. Phys. Chem. C, 2009, 113, 10061 CrossRef CAS; (c) X. W. Lou, J. S. Chen, P. Chen and L. A. Archer, Chem. Mater., 2009, 21, 2868 CrossRef CAS; (d) X. W. Lou, Y. Wang, C. L. Yuan, J. Y. Lee and L. A. Archer, Adv. Mater., 2006, 18, 2325 CrossRef CAS; (e) J. S. Chen, Y. L. Cheah, Y. T. Chen, N. Jayaprakash, S. Madhavi, Y. H. Yang and X. W. Lou, J. Phys. Chem. C, 2009, 113, 20504 CrossRef CAS; (f) L. Y. Jiang, X. L. Wu, Y. G. Guo and L. J. Wan, J. Phys. Chem. C, 2009, 113, 14213 CrossRef CAS; (g) D. F. Zhang, L. D. Sun, C. J. Jia, Z. G. Yan, L. P. You and C. H. Yan, J. Am. Chem. Soc., 2005, 127, 13492 CrossRef CAS; (h) M. T. Niu and F. Huang, ACS Nano, 2010, 6, 12.
- (a) M. Sturm, A. Leitner, J. Smatt, M. Linden and W. Lindner, Adv. Funct. Mater., 2008, 18, 2381 CrossRef CAS; (b) A. Leitner, M. Sturm, O. Hudecz, M. Mazanek, J. H. Smatt, M. Linden, W. Lindner and K. Mechtler, Anal. Chem., 2010, 82, 2726–2733 CrossRef CAS.
- D. W. Qi, J. Lu, C. H. Deng and X. M. Zhang, J. Phys. Chem. C, 2009, 113, 15854 CrossRef CAS.
- (a) Y. N. Xia, P. D. Yang, Y. G. Sun, Y. Y. Wu, B. Mayers, B. Gates, Y. D. Yin, F. Kim and Y. Q. Yan, Adv. Mater., 2003, 15, 353 CrossRef CAS; (b) Y. C. Sui, R. Skomski, K. D. Sorge and D. J. Sellmyer, Appl. Phys. Lett., 2004, 84, 1525 CrossRef CAS.
- S. Iijima, Nature, 1991, 354, 56–58 CrossRef CAS.
- (a) X. Y. Gong, J. Liu, S. Baskaran, R. D. Voise and J. S. Young, Chem. Mater., 2000, 12, 1049 CrossRef CAS; (b) O. R. Lourie, C. R. Jones, B. M. Bartlett, P. C. Gibbons, R. S. Ruoff and W. E. Buhro, Chem. Mater., 2000, 12, 1808 CrossRef CAS; (c) F. N. Dai, H. Y. He and D. F. Sun, J. Am. Chem. Soc., 2008, 130, 14064 CrossRef CAS.
- (a) Q. X. Zhou, Y. J. Ding, J. P. Xiao, G. G. Liu and X. Y. Guo, J. Chromatogr., A, 2007, 1147, 10 CrossRef CAS; (b) Y. Wang, J. Y. Lee and H. C. Zeng, Chem. Mater., 2005, 17, 3899 CrossRef CAS.
- (a) R. O. Fuentes, L. M. Acun, M. G. Zimicz, D. G. Lamas, J. G. Sacanell, A. G. Leyva and R. T. Baker, Chem. Mater., 2008, 20, 7356 CrossRef CAS; (b) W. W. Wang and J. L. Yao, J. Phys. Chem. C, 2009, 113, 3070 CrossRef CAS.
- (a) M. Ozaki, S. Kratohvil and E. Matijevic, J. Colloid Interface Sci., 1984, 102, 146 CrossRef CAS; (b) M. H. Cao, T. F. Liu, S. Gao, G. B. Sun, X. L. Wu, C. W. Hu and Z. L. Wang, Angew. Chem., Int. Ed., 2005, 44, 4197 CrossRef CAS; (c) X. L. Yu, C. B. Cao and X. Q. An, Chem. Mater., 2008, 20, 1936 CrossRef CAS.
- (a) N. Kallay, I. Fischer and E. Matijevic, Colloids Surf., 1985, 13, 145 CrossRef CAS; (b) T. Sugimoto and K. Sakata, J. Colloid Interface Sci., 1992, 152, 587 CAS.
- C. J. Jia, L. D. Sun, Z. G. Yan, L. P. You, F. Luo, X. D. Han, Y. C. Pang, Z. Zhang and C. H. Yan, Angew. Chem., Int. Ed., 2005, 44, 4328 CrossRef CAS.
- Y. S. Wang, A. Muramatsu and T. Sugimoto, Colloids Surf., A, 1998, 134, 265 CrossRef CAS.
- J. R. Zhang, Inorg. Chem. Commun., 2004, 7, 91 CrossRef CAS.
- L. Han, Z. Shan, D. H. Chen, X. J. Yu, P. Y. Yang, B. Tu and D. Y. Zhao, J. Colloid Interface Sci., 2008, 318, 315 CrossRef CAS.
Footnote |
| † Electronic supplementary information (ESI) available: Detailed information of the phosphopeptides enriched from tryptic digests of rat brain using α-Fe2O3@SnO2 nanotubes. See DOI: 10.1039/c0nr00060d |
| This journal is © The Royal Society of Chemistry 2010 |