Single metal nanoparticle spectroscopy: optical characterization of individual nanosystems for biomedical applications
Abhijit
Biswas
*a,
Tao
Wang
a and
Alexandru S.
Biris
b
aCenter for Nanoscience and Technology (NDnano), Department of Electrical Engineering, University of Notre Dame, Notre Dame, IN 46556, USA. E-mail: abiswas@nd.edu
bNanotechnology Center, Applied Science Department, University of Arkansas at Little Rock, Little Rock, AR 72204, USA
First published on 27th July 2010
Abstract
The last decade has witnessed the development of a variety of single nanoparticle spectroscopy methods. This has facilitated unprecedented growth of knowledge and understanding of fascinating optical properties of individual metal nanoparticles. This has opened up exciting possibilities of single nanoparticles for applications in many areas including advanced photonics, biomedical imaging and sensing. The field of single nanoparticles detection and characterization is still growing. This paper reviews recent advances in single nanoparticles spectroscopy using both near-field and far-field optics. It covers spectroscopy methods for extremely small (∼ 1 nm) to relatively large nanoparticles (∼ 200 nm) and their optical properties. Different optical techniques are described. Finally, a perspective on possible practical applications of single nanoparticle spectroscopy focusing on biomedical fields is given.
 Abhijit Biswas | Dr. Biswas is a Research Associate Professor at the Center for Nano Science and Technology (NDnano) and the Department of Electrical Engineering at the University of Notre Dame. He received his Ph.D. in Physics from Banaras Hindu University in India. Then he spent a three-year postdoctoral at Christian-Albrechts University of Kiel in Germany where he worked with Prof. Dr. Franz Faupel. His research focuses on nanocomposites, plasmonics, organic optoelectronics and micro/nanofabrication. Dr. Biswas has over seventy publications including three books and holds several patents. He serves on the editorial board of Vacuum Technology & Coating magazine and writes a monthly column on nanotechnology. |
 Tao Wang | Tao Wang received his Ph.D. degree in materials science at the University of Wisconsin - Madison Center for Nanotechnology with Professors Franco Cerrina and Ryan Kershner in 2009. He has previously conducted research at Louisiana State University and RWTH Aachen, Germany and has also worked as a microsystems engineer at Mezzo Technologies, Inc. He is now a research assistant professor at the Center for Nano Science and Technology and Department of Electrical Engineering at the University of Notre Dame. His current research interests focus on integrated lab-on-a-chip systems with optical or magnetic manipulation, nanomaterials and MEMS devices. |
 Alexandru S. Biris | Dr. Biris is an Associate Professor with the University of Arkansas at Little Rock, Applied Science Department and in parallel he serves as the Director/Chief Scientist of the UALR Nanotechnology Center. His research is focused in the area of nanotechnology with an emphasis of carbon nanotube synthesis and applications. He is also involved in various research projects in the controlled nanofabrication of thin films and nanomedicine (specific delivery of nanomaterials to cancer cells, photo-thermal ablation of tumors/cancer cells using nanomaterials and tissue engineering). He has over 120 peer reviewed papers presented in various Journals and holds several patents. |
1. Introduction
The novel confinement induced properties exhibited by metal nanoparticles with sizes ranging from a few nanometers to several hundreds of nanometers have received an exponentially growing interest in recent years in emerging nanoscience and nanotechnology.1,2 This interest is motivated by the potential technological and biomedical applications of the metal nanoparticles including photonic,3 subwavelength optical devices,4–7 scanning near field optical microscopy,8,9 optical data storage10 and chemical or biological sensing or biological labeling11,12 based on their specific optical properties that differ dramatically from those of bulk equivalents. It is known that the unique optical properties of metal nanoparticles arise from the optical resonances due to collective oscillations of the conduction electrons during interactions with light. The resonant excitation of these oscillations exhibits an intense resonance band in the near UV-visible to near IR spectral range, which is known as particle plasmon or surface plasmon resonance (SPR).13 The SPR characteristics such as spectral location, magnitude, and width strongly depend on the intrinsic properties of the nanoparticle size, nanoparticle shape and structure as well as the local environment.13Investigations of the optical scattering or absorption properties of single nanoparticles provide important insights into the intrinsic properties of the individual particles. These include quantum size dependence, energy level discreteness and surface reaction efficiency that are of central interest in both fundamental and applied nanosciences to detect and characterize optically-responsive nanoobjects. Ability to study single nanoparticle system allows overcoming the problems of various sources of inhomogeneities that are present in the measurements of nanoparticle ensembles or aggregates. These include variation in nanoparticle sizes, nanoparticle shapes or structural defects such as interfaces, as well as possible interaction effects between densely dispersed nanoparticles. In metal nanoparticle ensembles, only averaged optical responses are observed owing to the fluctuations of all structural parameters from object to object, masking the details of the individual particles. Single nanoparticle studies can be used to learn about the interaction of the nanoparticle system or nanosystem with its nanoscopic environment and the nature of the underlying inhomogeneities.14
While optical studies of single metal nanoparticles have a long history in physical science that dates back to Zsigmondy's work in 1966,15 the first single metal nanoparticles spectroscopic studies were reported by the Schultz and Feldmann groups.14,16–18 They were able to show, for example, that spherical particles have resonances in the blue, while triangular shaped particles scatter red light based on correlated transmission electron microscopy/single particle Rayleigh scattering measurements.16,19
Recent advances in the area of nano-optics, for example, spectral analysis of an individual particle in its local environment using full field imaging20 and dark-field microscopy studies,21 photothermal method that uses a photo-induced change in the refractive index of the environment leading to a considerable improvement in signal-to-background ratio and a better sensitivity,22 and studying far field spectra by a spatial modulation spectroscopy23 have facilitated unprecedented accuracy in studying the material properties of single nanoparticles. Further, combination of high temporal or spectral resolution with the ultimate spatial resolution at the single nanoparticle level gives a new insight into the electronic relaxation processes of nanoparticles,24,25 as well as into their vibrational properties.26
This review article is focused on covering recent developments in far-field and near-field single nanoparticle optical spectroscopic techniques, individual nanoparticle optical properties and the effects of nanoscopic environment, and practical applications of single nanoparticles spectroscopy in biomedical fields.
2. General theoretical considerations: nanoparticle absorption and scattering
When a metallic nanoparticle interacts with light, the oscillating electric field causes the conduction electrons to oscillate coherently. When the electron cloud is displaced relative to the nuclei, a restoring force arises from Coulomb attraction between electrons and nuclei that results in oscillation of the electron cloud relative to the nuclear frame-work. This is schematically depicted in Figure 1. The oscillation frequency depends on the density of electrons and effective electron mass, besides the shape and the charge distributions.27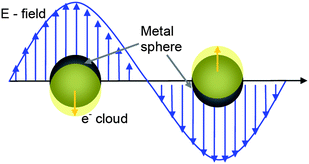 | ||
| Fig. 1 schematic illustrating electron cloud oscillation in metal nanoparticles upon light irradiation. | ||
The collective oscillation of the electrons is called the dipole plasmon resonance of the particle (sometimes denoted dipole particle plasmon resonance). Higher modes of plasmon excitation such as the quadrupole mode occur in case of larger nanoparticle size or non-spherical shape. In higher modes, half of the electron cloud moves parallel to the applied field and half moves antiparallel.13
The general theory of light scattering by a spherical metal particle was developed by G. Mie, which states that the scattering cross-section of a nanoparticle of radius R much smaller than the wavelength of the light λ (2 π R «λ) varies as R6, while its absorption cross-section varies as R3 only28,29 This implies that absorption is more important than scattering for very small particles. Accordingly, absorption-based detection methods are more sensitive to small particles. On the other hand, scattering becomes more important when the overall size of the nanoparticle is comparable to the wavelength of light, and in such cases, scattering based detection techniques are more suitable. The efficiencies of light absorption and scattering of nanoparticles are characterized by their respective cross-sections; σabs and σscatt. Assuming the nanoparticles small (<100 nm) compared to λ, the cross-sections σabs and σscatt can be given by the following expressions:
where m is the ratio of refractive indices of the particle and the medium. The scattering cross-section for extinction is given by:
| σext = σscatt + σabs |
Alternatively, the expressions of σscatt and σabs can also be given by:
where ε = ε (λ) and εm = εm (λ) are respectively the complex dielectric functions of the metallic nanoparticle and of the matrix in which it is embedded. It can be seen that absorption and scattering are maximum at the SPR wavelengths where ε + 2 εm = 0.20
Light interacts with the particle over a cross-sectional area larger than the geometric cross section of the particle when the nanoparticle diameter is comparable to the wavelength of light. According to general Mie theory, often σscatt is divided by the geometric cross-sectional area to give scattering efficiency parameter, Qsca.28
| Qscatt = σscatt/π r2 |
Figure 2 shows the absorption and scattering cross-sections of nanoparticles with different sizes and comparable to λ, which verifies that light absorption is more important than scattering for Au nanospheres of diameters below 100 nm (in water probed by 532-nm laser light).22
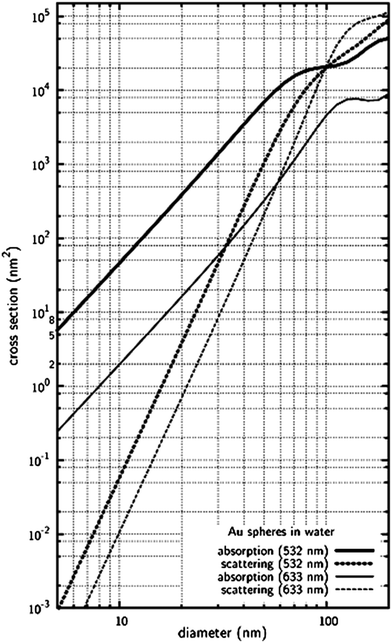 | ||
| Fig. 2 Variations of absorption and scattering cross-sections of gold nanospheres as a functions of diameter based on Mie theory. Reprinted with permission from ref. 22, copyright (2006) by the PCCP Owner Societies. | ||
Moving beyond the limitations of Mie theory, a finite-element method was employed to calculate light scattering for electromagnetic radiation interacting with arbitrary microstructures (larger than λ). The finite-element method permits computation of the light-scattering properties of realistically shaped rutile titania particles and the effects of optical interactions between neighboring particles in a pigmented film.30 The scattering cross-section can be expressed as:
| S = σscatt/V |
In an analytical formulation for resonant light scattering from metal nanoparticles of arbitrary shape and larger size compared to λ, the scattering cross-section was derived as follows31
| σscatt = (k4/6 π)α2, |
The first term in the denominator becomes zero in the limit of ε1 » ε2. L is the depolarization factor, ε (= ε1 + ε2) is the relative permittivity of the particle, εm is the relative permittivity of the surrounding medium, and V is the volume.31 A and B are material independent parameters depend on ε, where A(L) = −0.4865L – 1.046L2 + 0.8481L3, and B (L) = 0.01909L + 0.1999L2 + 0.6077L3. We describe in the following sections scattering- and absorption-based near-field and far-field spectroscopy of nanoparticles.
3. Near-field and far-field optical spectroscopy of metal nanoparticles
Spectroscopic studies of the local electromagnetic field distribution around a particle or in the immediate vicinity of metallic nanostructures require a spatial resolution beyond the optical diffraction limit, where the experimental requirements can be very stringent.22 The diffraction limit in conventional microscopy arises from the size of the spot that a light beam can be focused to with normal lens elements. The maximal resolution obtainable with the numerical aperture of 1.3–1.4 with high-quality objective lenses is approximately equal to half the wavelength of the radiation used, which for visible light applications results in a spatial resolution of 250–300 nm.32 Early in the 20th century, Synge proposed a new type of optical microscope based on a microscopic aperture with dimensions much smaller than the optical wavelength in an opaque screen that was designed to circumvent the limitations imposed by the diffraction limit.33–35 This led to development of the modern day near field scanning optical microscope (NSOM).36–38Figure 3 shows schematic illustration of the Synge's idea of near-field optics.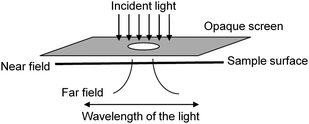 | ||
| Fig. 3 Schematics of the idea of near-field optical microscopy proposed by Synge. Reprinted with permission from ref. 32, copyright (1999) by the American Chemical Society. | ||
NSOM takes advantage of the optical near-fields and allows imaging beyond the diffraction limit by putting a scanned nanoprobe in the near-field of the sample. Optical near-fields or evanescent optical fields of noble metal nanoparticles correspond to those electromagnetic waves that extend only a few nanometers from the metal surface. Evanescent fields of metal nanoparticles are due to the large scattering and absorption cross-sections that result from the surface plasmon resonance. Near-field optical spectroscopy allows characterization of electromagnetic fields or modifying matter at the sub-wavelength scale. The technique provides a unique way to understand the interactions between objects and fields at the nanometer scale. Knowledge of these interactions provides important insights into the unique nanoscale optical phenomena such as the observation of squeezed plasmons in interacting metal nanoparticles.9,39–41 Despite the achievements of near-field techniques to probe samples beyond the diffraction limit, they have certain disadvantages. They are restricted to the surface of the sample, and therefore considered to be invasive. They are also complicated by non-trivial contrast mechanisms and technically demanding along with costly fabrication of the probes.
In the scenario when the nanoparticles are far apart from each other, i.e. the interparticle distance becomes large compared to the optical wavelength, far-field optical sepectroscopic methods can address individual nanoparticles in an experimentally less demanding way, while still providing valuable information.22 Recent research has suggested that the capacity of far-field optics can be expanded to visualize objects smaller than the wavelength of light with precise localizing subwavelength-sized objects.42
3.1 Near-field and far-field single nanoparticles spectroscopy: state-of-the-art
Several detection techniques have been developed that have facilitated to study individual metal nanoparticles and their properties. Far-field optical studies of noble metal particles (mainly silver and gold) mostly include scattering methods that rely on darkfield illumination, spectral signatures of the metal particles, or both.43 It is based on a scattered wave emitted either by the nanoparticles, or by its close environment. By tuning the probing wavelength to the plasmon resonance of the nanoparticles, one considerably improves selectivity against non-metallic objects, and one can access sizes down to a few tens of nanometers.14,16,44 A time-resolved absorption measurement for a single nanometer-sized particle based on a differential interference contrast (DIC) microscopy using pulsed laser light was shown to be effective for the transient absorption spectroscopy of a single metallic nanoparticle.45 By including an atomic force microscope, the size and shape of the particles were directly determined, in addition to the spectroscopic information. The use of a wavelength-tunable laser as the probing beam made it possible to observe transient absorption spectra.45 While near-field optics offers advantages of higher spatial resolution and of correlations with topography,39,46 they are harder to implement and are largely limited to surfaces and interfaces.9 Further, near-field optics for nano-objects with strongly environment dependent optical responses, such as metal nanoparticles require complex deconvolution of the experimental data taking into account the characteristics of the particle and tip and of their interaction at a nanoscale.23,46–48Far-field detection techniques have limitations in terms of signal-to-noise ratio. Scattered intensity also steeply decreases for small particles (< 30 nm) and therefore these methods are not suitable for the detection of small particles 22,43. Some studies have shown that the limit for detection by direct absorption or by scattering methods to lie at diameters of about 5–10 nm for reasonable integration times of the order of 10 ms, and reasonable intensities in the order of 1 MW cm−2.26,49
The other techniques are based on the generation of new wavelengths by the nanoparticle, either in a linear photoluminescence process50–52 or in nonlinear processes.53–55 The photothermal method uses a photo-induced change in the refractive index of the environment as an additional step to scatter a wave with a different wavelength. The refractive index change due to heating of the environment by a pump beam or the time-resolved optical response of the particle to a short pump pulse leads to considerable improvement in signal-to-background ratio, and thus to a much higher sensitivity.22 We present in the next section an overview of the recent advances in both far-field and near-field single nanoparticle spectroscopy instrumentation and optical properties of larger as well as smaller particles.
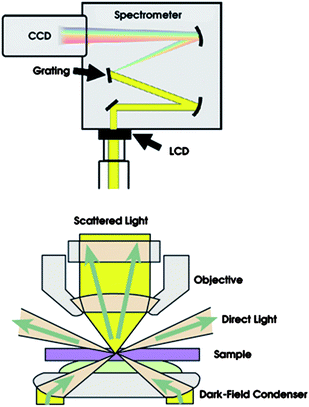 | ||
| Fig. 4 Schematics of the dark-field microscope setup. The scattered light is directed either to the ocular or to an imaging spectrometer, where the light is dispersed and the resulting spectrum captured by a CCD camera. Reprinted with permission from ref. 56, copyright (2007) by the American Chemical Society and Courtesy: Hank Hogan, Speedy Spectroscopy of Single Nanoparticles, Photonics Spectra, July (2007). | ||
In this design, the entrance slit of the spectrometer is replaced by an electronically addressable liquid crystal device with 800 × 600 pixels (230 × 230 pixels used in the actual experiments) with 32 µm2 pixel size and response time of 40 ms. By converting the measured single-particle spectra into particle geometry using a theoretically derived transfer function, the authors deduced absolute values for particle geometry at each point in time.56
One viable strategy in real-time nanoparticle detection is detecting the scattered light interferometrically. This allows accessing the scattered electric field amplitude as opposed to the scattered power. For such interferometric detection, Plakhotnik and Palm proposed that the reference wave can be created using reflection of the light beam from the surface of the sample's glass substrate.57 In this scheme, the light beam is focused through a microscope objective onto a glass substrate on which metal nanoparticles are adsorbed and which is covered by either immersion oil or water. The mechanism is governed by a small part of the incident beam that is reflected due to the refractive index mismatch between the medium and the glass substrate. This reflected field acts as the reference field (Eref) and interferes with the field scattered from the particle (Escatt), leading to an intensity at the detector Idet22
| Idet=|Eref+Escatt|2 = |Ei|2(r2 + |s|2−2r|s|sinϑ) |
In a recent work, a promising approach was shown that allows overcoming this problem. Ignatovich and Novotny introduced a background-free real-time detection scheme capable of recognizing low-index nanoparticles such as single viruses in water. Their method is based on interferometrically measuring the electromagnetic field amplitude of the scattered light. It does not use the sample interface reflection as a source for the reference wave. The authors used a split detector (to balance laser noise) to generate a background-free signal that renders unprecedented sensitivity for small particles. Within a one-millisecond time window the authors were able to reliably detect a single 10 nm polystyrene particle or a single 5 nm gold particle.58
Their scheme is based on a Michelson-like interferometer in the beam path and is depicted schematically in Figure 5. The technique allows adjusting separately the amplitude of the reference field and the scattered field from the particle, while keeping the reference field larger than the backscattered field from the sample background. This results in the off-center scatterers producing a signal. At the same time the static background (the r2 term in the above equation) is the same for both detector halves and consequently drops out.
![Schematics of interferometric detection scheme of scattering of gold nanoparticles as demonstrated by Ignatovich et al [58]. (a) A beam splitter (BS) splits the laser beam into a reference beam and a beam that is focused by a high numerical aperture into a nanoscale channel comprising a microfluidic system. An optionally attenuated reference beam recombines the scattered light from a passing particle, which then directed onto a split photodetector. This renders a background-free signal. (b) & (c) A single nanoparticle flowing through a narrow channel and producing a peak. Reprinted with permission from ref. 58, copyright (2006) by the American Physical Society.](/image/article/2010/NR/c0nr00133c/c0nr00133c-f5.gif) | ||
| Fig. 5 Schematics of interferometric detection scheme of scattering of gold nanoparticles as demonstrated by Ignatovich et al [58]. (a) A beam splitter (BS) splits the laser beam into a reference beam and a beam that is focused by a high numerical aperture into a nanoscale channel comprising a microfluidic system. An optionally attenuated reference beam recombines the scattered light from a passing particle, which then directed onto a split photodetector. This renders a background-free signal. (b) & (c) A single nanoparticle flowing through a narrow channel and producing a peak. Reprinted with permission from ref. 58, copyright (2006) by the American Physical Society. | ||
By focusing a supercontinuum white-light source, it was possible to record the plasmon scattering spectra of small single gold nanoparticles.60 Supercontinuum white light confocal microscopy was employed for the detection and spectroscopy of single gold nanoparticles. A combination of confocal microscopy using supercontinuum laser illumination and an interferometric detection technique was used to identify single nanoparticles of diameter below 10 nm.60
Development of far-field spectroscopy techniques for small particles that are free from spurious interactions with the observation apparatus is of prime interest to overcome the problems of particle-tip coupling in near-field detection. The lower intrinsic spatial resolution of far-field optical detection and characterization can be overcome by spatially modulating the position of an isolated particle in the focal spot of a laser beam. This approach is known as spatial modulation spectroscopy (SMS). The SMS technique being quantitative, a full optical identification of the nanoparticle geometry (size, shape and orientation) can be performed. Thus, the full ‘optical image’ of a nanoobject much smaller than the optical wavelength can be obtained with a far-field technique. The characterization of a single metal nanoobject by comparing its theoretical and experimental far-field spectra measured by SMS was reported in the case of gold and silver nanoparticles. Quantitative determination of the polarization dependent absorption cross-section spectrum of a single nanoparticle was shown to be an effective way to determine nanoparticle shape, size and orientation on a surface.23
Spatial modulation technique has been shown to detect very weak light absorption of single gold nanospheres down to 5 nm.61 SMS has the key advantages of requiring very low light power and of yielding quantitative information including the absolute value of the absorption cross-section of a single nanoobject that can be measured down to a few nm2.61 Advances in SMS technique such as combining SMS with a broadband supercontinuum source, have allowed investigations of the spectral and polarization dependences of the optical absorption of a single absorbing nanoparticle.23 Depending on the amplitude of the extinction cross-section of the investigated nanoparticle, measurements can be performed over a broad spectral range using either laser-based high brightness sources or a white lamp.62Figure 6 shows the principle of SMS technique.23
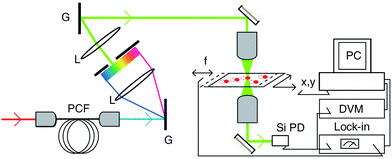 | ||
| Fig. 6 The principle of the single particle space modulation spectroscopy technique. The right part of the figure shows the space modulation microscope system that contains two ×100 microscope objectives and the acquisition system (a silicon photodiode (PD), lock-in amplifier, digital voltmeter (DVM) and a personal computer. Reprinted with permission from ref. 23, copyright (2006) by Institute of Physics Publishing, U.K. | ||
In SMS method, the sample position is modulated along the y direction at the frequency f by a piezo-electric element and displaced by an x, y piezo-scanner. A photonic crystal fibre (PCF) is used where the light source is created by injecting femtosecond pulses. It then disperses the created supercontinuum in a grating pair system (G), the part of the supercontinuum selected by a slit being injected in the transmission microscope, Figure 6.23
For a laser beam of power Pi incident on a particle of size much smaller than the focal spot diameter, the expression for total transmitted power was deduced and given by23,62
The sample image is recorded in the following way: when recovering the modulated transmission at the fundamental, f, or harmonic, 2 f, frequency, while scanning the sample position, one obtains a sample image in which each particle yields a signal proportional to the first or second derivatives of I (x, y), respectively.23,62 For larger modulation amplitudes δy, the above expansion for Pt has to be calculated numerically.63 Further, it was previously shown that quantitative analysis of the experimentally measured f or 2 f component of the power transmission change ΔT/T = (Pi − Pt)/Pi yields the absolute value of the single particle absorption cross section σa ≈ σe.61 Based on this method, gold nanoparticles with diameters down to 5 nm were detected and in agreement with the Mie theory, their absorption cross-sections were found to be proportional to the particle volume in the 5–20 nm range.61
Photothermal detection methods provide opportunities to do absorption spectroscopy of small single nanoparticles in highly scattering environments. Photothermal methods lead to a considerable improvement in signal-to-background ratio, and thus to a much higher sensitivity. As discussed in the beginning, small metal nanoparticles are very efficient light absorbers owing to their large absorption cross-section and a fast electron–phonon relaxation time in the picosecond range.64 However, almost all of the absorbed energy is converted into heat due to extremely weak luminescence yield of these particles.65. 66 The absorption induced rise in temperature results in a change in the local refractive index. This photothermal process can be leveraged to develop detection and characterization methods for small single nanoparticles.
Photothermal detection method was first proposed by Tokeshi et. al in 2001.67 They used a thermal lens effect to detect very low concentrations of absorbing molecules in solutions.67 Later, a photothermal Interference Contrast (PIC) method was developed by Boyer et. al. for the detection of the small refractive index change around an absorbing nanoparticle.68 A more sensitive photothermal method was developed by Berciaud et. al. called Photothermal Heterodyne Imaging (PHI),69 which was alternatively called “Laser Induced Scattering Around a NanoAbsorber”.70 Using PHI technique, the authors were able to detect and characterize single nanoparticles as small as 1.4 nm (absorption cross section ∼ 10−14 cm2), with only 67 gold atoms.69
The principle of PHI method is as follows: it is based on a combination of a time-modulated heating beam and a non-resonant probe beam overlapping on the sample. Upon illumination by the intensity modulated heating beam, metal nanoparticles behave as a heating point source and subsequently generate a time–modulated index of refraction in their vicinity. The probe beam which then interacts with this profile results in a scattered field that contains side bands with frequency shifts at the modulation frequency. The reflection of the incident probe at the interface between a cover slip and the sample (i.e. nanoparticles) or its transmission produces a reference field. The interference between this reference field and the scattered field produces a beatnote at the modulation frequency, which is then extracted using a lock-in amplifier. This principle is depicted schematically in Figure 7.69
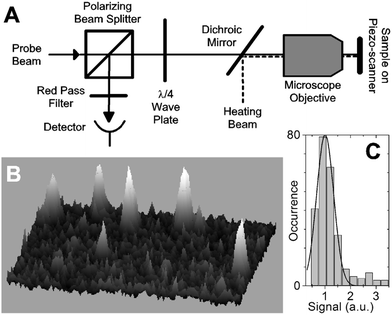 | ||
| Fig. 7 (a) Experimental scheme of the PHI technique (b) A three-dimensional representation of an image (5 × 5 µm2) containing individual 67 atom gold clusters (1.4 nm diameter). (c) The monomodal shape of the distribution of 272 peaks detected in a sample prepared with 67 atom gold clusters reveals that individual clusters are detected. Reprinted with permission from ref. 69, copyright (2004) by the American Physical Society. | ||
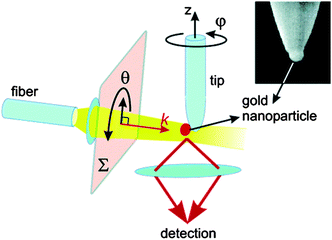 | ||
| Fig. 8 Schematics of the tomographic measurement setup. θ is the polarization angle and angle φ is defined with respect to the orientation of the tip in the beginning of the experiment. The inset shows an electron microscope image of a typical tip carrying Au nanoparticle. Reprinted with permission from ref. 71, copyright (2004) by the American Chemical Society. | ||
In order to resolve the inhomogeneity for each particle and also determine its orientation in space, the particle of interest was mounted to the end of a sharp glass tip that was rotated in-situ. A glass fiber tip was first treated with a nanometer thin layer of APTMS (3-aminopropyltrimethoxysilane), acting as adhesive for gold nanoparticles. The tip was then mounted in a SNOM stage, allowing the researchers to approach it with nanometer precision to a substrate that supported the nanoparticles.71Figure 9 shows optical scattering spectra of Au nanoparticles recorded at different orientations.
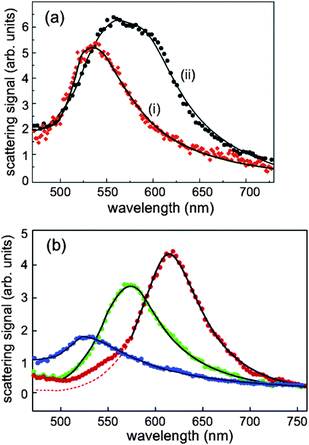 | ||
| Fig. 9 (a) (i) A plasmon spectrum corresponding to a spherical particle. (ii) The circles display a spectrum recorded at θ = 10°, φ = 60° from an ellipsoidal particle (b) The red, green, and blue curves show the narrowest spectra recorded at (φ = 30°, θ = 350°), (φ = 30°, θ = 80°), and (φ = 120°, θ = 290°), respectively. The solid lines show the fits. Reprinted with permission from ref. 71, copyright (2004) by the American Chemical Society. | ||
The results for an ellipsoidal particle in Figure 7 (b) showed a pronounced dependence on the choice of φ and θ. The resonance wavelengths λ = 614 nm, λ = 571 nm and λ = 528 nm showed a systematic blue shift as the axis of the ellipsoid particle became shorter. These results provide important insights on resolving the intrinsic inhomogeneity of a single nanoparticle. The information about the frequencies and line widths of plasmon resonances as well as the orientation of a metallic nanoparticle is important to understand its interaction with a nearby molecule, which gives rise to effects such as enhancement of fluorescence and Raman signals.71
4. Single nanoparticle surface enhanced raman spectroscopy (SERS)
Raman spectroscopy is an advanced analytical technique based on the inelastic scattering (not absorption) of photons that interact with molecules in biological or chemical samples. The schematic of a Raman spectrometer is shown in Figure 10.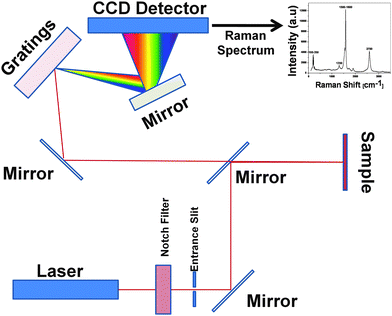 | ||
| Fig. 10 The optical path schematic of a Raman system. | ||
The amount of photon energy shift indicates the type of bonds present in the sample molecules (C![[double bond, length as m-dash]](https://www.rsc.org/images/entities/char_e001.gif) O, CH2, CH3, CCl, etc). As a result, Raman spectroscopy is a very accurate technique that can identify with great specificity various molecular bonds and therefore produce a precise spectral fingerprint unique to the particular molecules and their structures. The intensity of spectral bands is directly proportional to concentration for each species. Positions of the Raman peaks are specific to each type of bond; some of the stronger and more important peaks are: δ(CC) aliphatic chains at 250–400 cm−1, υ(C–S) aliphatic at 630–790 cm−1, υ(C–Cl) at 550–800 cm−1, υ(CC) aromatic ring chain vibrations at 1580–1600 cm−1, υ(C-(NO2)) at 1340–1380 cm−1, υ(N
O, CH2, CH3, CCl, etc). As a result, Raman spectroscopy is a very accurate technique that can identify with great specificity various molecular bonds and therefore produce a precise spectral fingerprint unique to the particular molecules and their structures. The intensity of spectral bands is directly proportional to concentration for each species. Positions of the Raman peaks are specific to each type of bond; some of the stronger and more important peaks are: δ(CC) aliphatic chains at 250–400 cm−1, υ(C–S) aliphatic at 630–790 cm−1, υ(C–Cl) at 550–800 cm−1, υ(CC) aromatic ring chain vibrations at 1580–1600 cm−1, υ(C-(NO2)) at 1340–1380 cm−1, υ(N![[double bond, length as m-dash]](https://www.rsc.org/images/entities/char_e001.gif) N) aromatic at 1410–1440 cm−1, υ(C
N) aromatic at 1410–1440 cm−1, υ(C![[double bond, length as m-dash]](https://www.rsc.org/images/entities/char_e001.gif) C) at 1500–1900 cm−1, υ(-S–H) at 2550–2600 cm−1, etc.
C) at 1500–1900 cm−1, υ(-S–H) at 2550–2600 cm−1, etc.
In view of the specificity of the chemical bond composition of molecular species, Raman spectroscopy can be used to monitor diverse biological processes, such as changes in the lipid content and metabolism, protein changes in either expression or post synthetic modification, and a wide range of other processes that may be affected by the aging process.72–74 As an example of a basic-biology application of Raman spectroscopy to address metabolic changes associated with longevity, lipid storage levels were examined in Caenorhabditis elegans, comparing wild-type to mutants with disrupted feeding or signaling pathways.72 A mutant (pha-3) with impaired feeding (mimicking caloric restriction) had only a third the lipid content of controls, whereas daf-2 and daf-4 mutants, defective in insulinlike and TGF-ß signaling respectively, showed 40 and 100% increases, accompanied by increases in lipid fluidity. Raman is able to distinguish age-associated lipofuscins from neutral lipids, and to report lipid unsaturation levels,73 providing a powerful tool to understand the consequences of genetic modifications affecting lipid metabolism in C. elegans. Furthermore, the impacts of aging and genetic modification can be monitored as functions of time, providing information on the kinetics of lipid accumulation.
Very few studies have applied Raman scattering to changes that occur during natural aging at the structural and molecular levels. Raman spectroscopy was used to monitor protein-structure modifications of intact mouse lens as affected by age, with observation of a significant aging decline in the tryptophan-specific band at 880 cm−1, in parallel with a decrease of the 2579 cm−1 band corresponding to the S–H stretching mode.75 This implies an inverse relationship between tryptophan and the level of S–S bonds, as expected if S–H levels reflect the redox balance and tryptophan levels decline chiefly due to oxidation of this residue, regarded as an index of protein oxidative damage. Intensity of the 3390 cm−1 band (O–H stretching) also decreased, implying lens dehydration. Raman spectroscopy has been used to analyze individual cells in vivo and in vitro, e.g., to follow the distribution and interactions of proteins, DNA and other molecules during apoptosis.76 Gastric carcinoma cells, monitored during apoptotic induction, revealed a decrease in Raman bands corresponding to lipids, proteins, and nucleic acids; in the latter, phosphodiester bonds were highly depleted, indicating degradation.
In cancer research, Raman has been used for real-time diagnosis, detection of metastasis and circulating cancer cells (both superficial and internal cancers), and to monitor the bio-distribution of nanomaterials in vitro.77–79 Raman 2D mapping requires only a little further development to reveal the variation in concentration of a specific bond within complex environments.80 Each pixel of the image is generated from one Raman peak with a spectral resolution of <0.8 µm. In principle, images could portray the distribution of specific spectra, based on the relative peak heights characteristic of a molecular species.
The main disadvantage of normal Raman spectroscopy is the low signal-to-noise ratio for less abundant molecules. An important advancement was the demonstration of impressive Raman signal enhancement through interaction between metal nanostructures and biological molecules.81–83 The resulting Surface Enhanced Raman Spectroscopy (SERS) typically enhances Raman signal for surface-proximal molecules by factors of 106–1015. The resulting unprecedented gain in sensitivity and the potential for single-molecule detection accounts for most of the 416 SERS citations in PubMed (2009). This enormous enhancement allows spectroscopic detection and identification of single molecules located on the single nanoparticle surface or at the junction of two particles.86 At the single-particle level, maximum enhancement factor through electromagnetic fields has been theoretically predicted to be of the order of 1011.86
The total SERS enhancement is the result of two major factors:87–89 electromagnetic field effects and chemical charge transfer considerations. The Raman effect is significantly enhanced when the electromagnetic field between the noble metals nanostructural surfaces is amplified due to the oscillation of the conduction band electrons (plasmon resonance) induced by the laser radiation. In order for this effect to take place a distance of a few nm is required. Furthermore, a charge transfer takes place between the metal nanostructures and the molecules adsorbed on their surfaces which is also responsible for the SERS effect. To better understand these rather different mechanisms, Doering and Nie90 directly examined chemical enhancement by using an integrated flow injection and ultra-sensitive optical imaging/spectroscopy system (Figure 11).
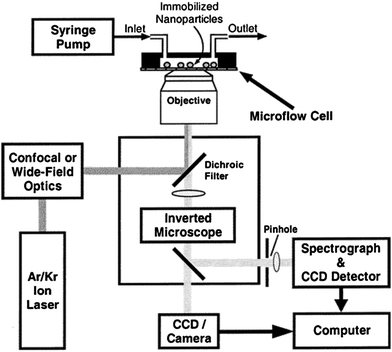 | ||
| Fig. 11 Schematic diagram of the integrated flow-injection and optical imaging spectroscopy for single-particle SERS. Reprinted with permission from ref. 90, copyright (2002) by the American Chemical Society. | ||
The key features of their spectroscopy set up are (1) colloidal Ag nanoparticles that are immobilized on a glass surface inside a microflow device and (2) single particle SERS signals are observed in real time while the immobilized particles are treated by chemical reagents in the flow cell (Figure 11). The authors observed that SERS spectral changes primarily come from chemical enhancement at surface active sites, which showed that SERS can be used as a powerful tool for single-molecule and single-site vibrational spectroscopy.90
5. Biomedical applications of single nanoparticle detection and spectroscopy
Advances in single nanoparticle spectroscopy have generated exciting possibilities for many fascinating applications of metal nanoparticles in cellular biology and nanoscience. Single nanoparticles detection techniques could be employed for practical applications in fields such as particle tracking inside cells, and detection of biowarfare agents (viruses).91The determination and exact quantification of gene expression is becoming increasingly important in basic pharmaceutical and clinical research. While fluorescence-based DNA assays are most widely used, they suffer from the presence of autofluorescence in some biological samples. This results in severe interference with the detection of the target molecules. DNA assays based on metal nanoparticles are promising candidates and offer a viable alternative approach. Photothermal detection techniques have been demonstrated as a new readout strategy of DNA micro-arrays based on single gold nanoparticles.70
A number of applications based on nanoparticle SERS have begun to emerge in which antibodies, peptides and DNA oligonucleotides are attached to nanoparticles probes for molecular imaging and analysis in living specimens.84,85 When a small protein is attached to silver nanoparticles, SERS spectra are dominated by the vibrations of molecular groups near the anchor points of the proteins,82,83 demonstrating the potential for molecular selectivity. Nanoparticles are readily delivered in vivo into cells or organisms, both for SERS enhancement and as contrast agents for other optical processes, to study protein-protein interactions or specific metabolic processes.
More recently it was shown that the size and the shape of the noble metal nanostructures can play a major role in various laser guided medical applications. Besides the strong Raman enhancement properties of Au or Ag nanomaterials they also have the ability of inducing photo-thermal ablation of cells and tissues.87,88,92 The size and the shape of the Au or Ag nanoparticles have a characteristic plasmon frequency that is in a direct correlation with their size and especially shape. The ability of controlling the shape from spherical to rod or fiber-like is very interesting given the change in the peak plasmon resonance that can be matched with the near-infrared (NIR) wavelength of most of the bio-medical lasers. In this case, the fiber-like nanoparticles can act as both NIR SERS agents and photothermal inducing structures for the ablation of cells and tissues through heat generation. The gold nanoparticles have been used extensively as photothermal/photoacoustic agents under laser radiation for the detection and killing of clustered or individually circulating cancer cells.92–95 The basic concept is shown in Figure 12.
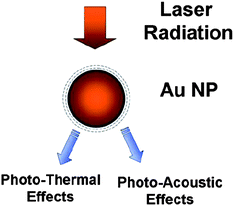 | ||
| Fig. 12 Photo-thermal and photo acoustic effects induced by the laser radiation into gold nanoparticles. | ||
Given the unique bio-medical detection capabilities of the SERS technology, more advanced hybrid nanomaterials were proposed. Nanoparticles were formed96 of a magnetic core and a silica shell covered with Ag films and produced 1000 times Raman signal enhancement of various organic compounds adsorbed on their surfaces. These nanostructures have also been successfully used to target breast-cancer cells (SKBR3) and floating leukemia cells (SP2/O). The cells tagged with the nanomaterials were easily removed using magnetic fields. Such multifunctional nanomaterials can be used for SERS, targeting of cancer cells and MRI thermal agents for the ablation of the cells and tumors.
Only recently, Au nanostructures bio-functioanlized with polymeric layers such as PEG and targeting molecules – antibodies/folates - have successfully been used to molecularly map the lymphatic endothelial receptors.97 The nanostructures were composed of single wall carbon nanotubes covered with a thin gold layer and have proved to have a low toxicity level. Given the extremely high enhanced near-infrared contrast of these hybrid nanomaterials, only extremely low laser fluence levels were required for the comprehensive mapping of the endothelial vessels. As a result, the gold nanostructures with various dimensions and morphologies could be successfully used as bio-imaging agents and potential photo-acoustic and pho-thermal agents to detect and destroy cancer cells in circulation as well as infections. It is expected that in the future more complex hybrid systems composed of nanostructural components, various coatings for improving their bio-compatibility, and biological systems such as targeting molecules for specific delivery to cells and tissues, to play a continuously more important role in the opto-medical applications that range from cancer detection and destruction, to imaging and gene delivery technologies.
The development of portable single nanoparticles detection probes has allowed direct optical sensing of environmental changes using a single nanoparticle. This opens up potential applications using a single particle as chemical and biological sensor on a nanometer scale.98 A high throughput single nanoparticle spectroscopy method was recently developed for analysis of hundreds of nanoparticles per second and the technique was shown to be an effective high throughput analysis of nanoparticle SERS tags.99 The authors showed that by measuring Raleigh and Raman scattering from individual tags, tag preparations can be characterized based on their brightness and uniformity. The rapid analysis of the individual nanoparticles with high spectral resolution is useful in many areas of biomedical engineering.99Figure 13 shows the high throughput single nanoparticle spectroscopy method, which employs high throughput Raman flow spectrometer with hydrodynamic focusing of the sample in a sheath flow cuvette to make simultaneous measurements of nanoparticle Rayleigh and Raman light scatter. Nanoparticles in the sample pass through the center of the ∼4 pL probe volume defined by the dimensions of the laser beam, sample stream, and focal spot of the collection optics.99
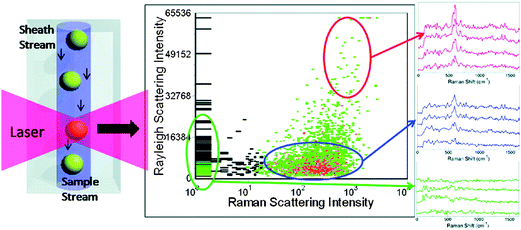 | ||
| Fig. 13 Single nanoparticle flow spectrometer. (a) Sample is hydrodynamically focused to flow through a focused laser beam. Note that the figure is not to scale. (b) Schematic of the Raman flow spectrometer setup. (c) Single tag Raman scattering spectra of an inactive SERRS tag (black) and Raman-active tags prepared with oxazine 170 (red), thionin (blue), and malachite green (green) of varying intensities. Reprinted with permission from ref. 99, copyright (2009) by the American Chemical Society. | ||
Single nanomaterials spectroscopy could be extended to semiconductor nanoparticles for new biophotonic applications. Recent studies have shown that it may be possible to obtain the intrinsic properties of excitons in single semiconductor nanocrystals. Photoluminescence (PL) blinking of nanoparticles and carbon nanotubes is a unique optical phenomenon revealed by single nanomaterials spectroscopy.100,101 PL blinking is attributed to a random switching between light-emitting and nonemitting states. The PL intensity and blinking statistics are sensitive to the experimental conditions such as surrounding environments, nanomaterials size, temperature, etc. These attributes could be leveraged to develop highly-sensitive biosensors and photonic devices.
6. Conclusion and outlook
In this review we have described recent advances in single nanoparticle spectroscopy methods that are based on both far-field and near-field optics. The study of the physical properties of very small metallic aggregates and nonluminescent semiconductor nanocrystals to relatively large particles is now possible at the individual particle level. Thus, it provides the opportunity to investigate many of the properties of individual metal nanoparticles, notably electronic and vibrational relaxation. Single Nanoparticles spectroscopy is a young field and researchers continue to improve the detection and characterization capabilities of individual nanoparticle. Near-field optics offers advantages of higher spatial resolution. However, they are harder to implement and are largely limited to surfaces and interfaces. While there have been much progress in developing far-field optical techniques, they have wavelength-limited resolution problem. For the purposes of detection and tracking in advanced biological applications, sensitivity is crucial, and it would be an interesting challenge to combine the latest technologies of single nanoparticles far-field optics with the subwavelength resolution of near-field optics to achieve ultimate detection and characterization capabilities of individual nanosystems. This is particularly attractive for the study of single nanoparticle-labeled molecules in live cells and in other biomedical fields.References
- Nanosciences, Nanotechnologies and Nanophysics, edited by C. Dupas, Ph. Houdy, and M. Lahmani, Springer, New York, 2006 Search PubMed.
- Nanoscale Science and Technology, edited by R. Kelsall, I. W. Hamley, and M. Geoghegan, Wiley, New York, 2006 Search PubMed.
- Z. Yuan, et al., Science, 2002, 295, 102 CrossRef CAS.
- M. Salerno, J. R. Krenn, B. Lamprecht, G. Schider, H. Ditlbacher, N. Felidj, A. Leitner and F. Aussenegg, Opto-Electron. Rev., 2002, 10, 217 Search PubMed.
- J. R. Krenn, Nat. Mater., 2003, 2, 210 CrossRef CAS.
- S. Maier, P. G. Kik, H. A. Atwater, S. Meltzer, E. Harel, B. Koel and A. A. G. Requicha, Nat. Mater., 2003, 2, 229 CrossRef CAS.
- W. L. Barnes, A. Dereux and T. W. Ebbesen, Nature, 2003, 424, 824 CrossRef CAS.
- T. Kalkbrenner, M. Ramstein, J. Mlynek and V. Sandoghdar, J. Microsc., 2001, 202, 72 CrossRef CAS.
- G. P. Wiederrecht, Eur. Phys. J.: Appl. Phys., 2004, 28, 3 CrossRef CAS.
- H. Ditlbacher, J. R. Krenn, B. Lamprecht, A. Leitner and F. R. Aussenegg, Opt. Lett., 2000, 25, 563 Search PubMed.
- J. Yguerabide and E. E. Yguerabide, Anal. Biochem., 1998, 262, 157 CrossRef CAS.
- G. Raschke, S. Kowarik, T. Franzl, C. Sonnichsen, T. A. Klar, J. Feldmann, A. Nichtl and K. Kurzinger, Nano Lett., 2003, 3, 935 CrossRef CAS.
- U. Kreibig and M. Vollmer, Optical Properties of Metal Clusters, Springer Series in Materials Science, Springer, Berlin, vol. 25 ( 1995) Search PubMed.
- C. Sonnichsen, S. Geier, N. E. Hecker, G. von Plessen, J. Feldmann, H. Ditlbacher, B. Lamprecht, J. R. Krenn, F. R. Aussenegg, V. Z.-H. Chan, J. P. Spatz and M. Moöller, Appl. Phys. Lett., 2000, 77, 2949 CrossRef CAS.
- R. Zsigmondy, Nobel Lectures, Chemistry 1922–1941, Elsevier Publishing Company, Amsterdam, 1966 Search PubMed.
- S. Schultz, D. R. Smith, J. J. Mock and D. A. Schultz, Proc. Natl. Acad. Sci. U. S. A., 2000, 97, 996 CrossRef CAS.
- C. Sönnichsen, T. Franzl, T. Wilk, G. Von Plessen, J. Feldmann, O. Wilson and P. Mulvaney, Phys. Rev. Lett., 2002, 88, 077402 CrossRef CAS.
- J. J. Mock, M. Barbic, D. R. Smith, D. A. Schultz and S. Schultz, J. Chem. Phys., 2002, 116, 6755 CrossRef CAS.
- C. Sönnichsen, T. Franzl, T. Wilk, G. Von Plessen and J. Feldmann, New J. Phys., 2002, 93, 4.
- E. Absil, G. Tessier, D. Fournier, M. Gross and M. Atlan, Full field imaging and spectroscopy of individual gold nanoparticles, Eur. Phys. J.: Appl. Phys., 2008, 43, 155 CrossRef CAS.
- Min Hu, Carolina Novo, Alison Funston, Haining Wang, Hristina Staleva, Shengli Zou, Paul Mulvaney, Younan Xiae and Gregory V. Hartland, Dark-field microscopy studies of single metal nanoparticles: understanding the factors that influence the linewidth of the localized surface Plasmon resonance, J. Mater. Chem., 2008, 18(17), 1949 RSC.
- M. A. van Dijk, A. L. Tchebotareva, M. Orrit, M. Lippitz, S. Berciaud, D. Lasne, L. Cognetc and B. Lounisc, Absorption and scattering microscopy of single metal nanoparticles, Phys. Chem. Chem. Phys., 2006, 8, 3486 RSC.
- Otto Muskens, Dimitris Christofilos1, Natalia Del Fatti and Fabrice Valĺee, Optical response of a single noble metal Nanoparticle, J. Opt. A: Pure Appl. Opt., 2006, 8, S264 CrossRef.
- S. Berciaud, L. Cognet, P. Tamarat and B. Lounis, Nano Lett., 2005, 5, 515 CrossRef CAS.
- O. L. Muskens, N. Del Fatti and F. Vallé, Nano Lett., 2006, 6, 552 CrossRef CAS.
- M. A. van Dijk, M. Lippitz and M. Orrit, Phys. Rev. Lett., 2005, 95, 267406 CrossRef.
- S. Link and M. A. El-Saed, J. Phys. Chem. B, 1999, 103, 8410 CrossRef CAS.
- G. Mie, Ann. Phys., 1908, 330, 377 CrossRef.
- H. C. van de Hulst, Light Scattering by Small Particles, Dover Publications, 1981 Search PubMed.
- Erik S. Thiele and Roger H. French, Light-Scattering Properties of Representative, Morphological Rutile Titania Particles Studied Using a Finite-Element Method, J. Am. Ceram. Soc., 1998, 81, 469.
- H. Kuwata, H. Tamaru, K. Esumi and K. Miyano, Resonant light scattering from metal nanoparticles: Practical analysis beyond Rayleigh approximation, Appl. Phys. Lett., 2003, 83, 4625 CrossRef CAS.
- Robert C. Dunn, Near-Field Scanning Optical Microscopy, Chem. Rev., 1999, 99, 2891 CrossRef CAS.
- E. H. Synge, Philos. Mag, 1928, 6, 356 CAS.
- E. H. Synge, Philos. Mag, 1931, 11, 65 CAS.
- E. H. Synge, Philos. Mag, 1932, 13, 297.
- E. A. Ash and G. Nicholls, Nature, 1972, 237, 510 CrossRef CAS.
- D. W. Pohl, W. Denk and M. Lanz, Appl. Phys. Lett., 1984, 44, 651 CrossRef.
- U. Durig, D. W. Pohl and F. Rohner, J. Appl. Phys., 1986, 59, 3318 CrossRef.
- R. Hillenbrand and F. Keilmann, Optical oscillation modes of Plasmon particles observed in direct space by phase-contrast near-field microscopy, Appl. Phys. B, 2001, 73, 239 CAS.
- M. Quinten, A. Leitner, J. R. Krenn and F. R. Aussenegg, Opt. Lett., 1998, 23, 1331 Search PubMed.
- M. L. Brongersma, J. W. Hartman and H. A. Atwater, Phys. Rev. B: Condens. Matter Mater. Phys., 2000, 62, R16356 CrossRef CAS.
- A. Bloeβ, Y. Durand, M. Matsushita, H. Van Dermeer, G. J. Brakenhoff and J. Schmidt, Optical far-field microscopy of single molecules with 3.4 nm lateral resolution, J. Microsc., 2002, 205, 76 CrossRef.
- A. van Dijk Meindert, Markus Lippitz and Michel Orrit, Far-Field Optical Microscopy of Single Metal Nanoparticles, Acc. Chem. Res., 2005, 38, 594 CrossRef CAS.
- J. Yguerabide and E. E. Yguerabide, Anal. Biochem., 1998, 262, 157 CrossRef CAS.
- Yasutaka Matsuo and Keiji Sasaki, Time-resolved Laser Scattering Spectroscopy of a Single Metallic Nanoparticle, Jpn. J. Appl. Phys., 2001, 40, 6143 CrossRef CAS.
- T. Klar, M. Perner, S. Grosse, G. von Plessen, W. Spirkl and J. Feldmann, Surface-plasmon resonances in single metallic nanoparticles, Phys. Rev. Lett., 1998, 80, 4249 CrossRef CAS.
- A. A. Mikhailovsky, M. A. Petruska, M. I. Stockman and V. I. Klimov, Opt. Lett., 2003, 28, 1686 Search PubMed.
- A. Liu, A. Rahmani, G. W. Bryant, L. J. Richter and S. J. Stranick, J. Opt. Soc. Am. A, 2001, 18, 704 CrossRef.
- K. Lindfors, T. Kalkbrenner, P. Stollner and V. Sandoghdar, Phys. Rev. Lett., 2004, 93, 037401 CrossRef CAS.
- M. R. Beversluis, A. Bouhelier and L. Novotny, Phys. Rev. B: Condens. Matter Mater. Phys., 2003, 68, 115433 CrossRef.
- C. D. Geddes, A. Parfenov and J. R. Lakowicz, J. Fluoresc., 2003, 13, 297 CrossRef CAS.
- L. A. Peyser, A. E. Vinson, A. P. Bartko and R. M. Dickson, Science, 2001, 291, 103 CrossRef CAS.
- Y. H. Liau, A. N. Unterreiner, Q. Chang and N. F. Scherer, J. Phys. Chem. B, 2001, 105, 2135 CrossRef CAS.
- M. Lippitz, M. A. van Dijk and M. Orrit, Nano Lett., 2005, 5, 799 CrossRef CAS.
- M. Pelton, M. Liu, S. Park and N. F. Scherer, ArXiv cond-mat, 2005, 0506158 Search PubMed.
- Jan Becker, Olaf Schubert and Carsten Söennichsen, Gold Nanoparticle Growth Monitored in situ Using a Novel Fast Optical Single-Particle Spectroscopy Method, Nano Lett., 2007, 7, 1664 CrossRef CAS.
- T. Plakhotnik and V. Palm, Phys. Rev. Lett., 2001, 87, 183602 CrossRef.
- Filipp V. Ignatovich and Lukas Novotny, Real-Time and Background-Free Detection of Nanoscale Particles, Phys. Rev. Lett., 2006, 96, 013901 CrossRef.
- D. Boyer, P. Tamarat, A. Maali, B. Lounis and M. Orrit, Science, 2002, 297, 1160 CrossRef CAS.
- K. Lindfors, T. Kalkbrenner, P. Stoller and V. Sandoghdar, Detection and Spectroscopy of Gold Nanoparticles Using Supercontinuum White Light Confocal Microscopy, Phys. Rev. Lett., 2004, 93, 037401–1 CrossRef CAS.
- A. Arbouet, D. Christofilos, N. Del Fatti, F. Valĺee, J. R. Huntzinger, L. Arnaud, P. Billaud and M. Broyer Phys, Phys. Rev. Lett., 2004, 93, 127401 CrossRef CAS.
- P. Billaud, J.-R. Huntzinger, E. Cottancin1, J. Lerm'e, M. Pellarin, L. Arnaud, M. Broyer, N. Del Fatti and F. Valĺee, Optical extinction spectroscopy of single silver nanoparticles, Eur. Phys. J. D, 2007, 43, 271 CrossRef CAS.
- A. J. Haes, S. Zou, G. C. Schatz and R. P. Van Duyne, J. Phys. Chem. B, 2004, 108, 6961 CrossRef CAS.
- M. Perner, S. Grésillon, J. Marz, G. von Plessen, J. Feldmann, J. Porstendorfer, K. J. Berg and G. Berg, Phys. Rev. Lett., 2000, 85, 792 CrossRef CAS.
- E. Dulkeith, T. Niedereichholz, T. A. Klar, J. Feldmann, G. von Plessen, D. I. Gittins, K. S. Mayya and F. Caruso, Phys. Rev. B: Condens. Matter Mater. Phys., 2004, 70, 205424 CrossRef.
- J. P. Wilcoxon, J. E. Martin, F. Parsapour, B. Wiedenman and D. F. Kelley, J. Chem. Phys., 1998, 108, 9137 CrossRef CAS.
- M. Tokeshi, M. Uchida, A. Hibara, T. Sawada and T. Kitamori, Anal. Chem., 2001, 73, 2112 CrossRef CAS.
- D. Boyer, P. Tamarat, A. Maali, B. Lounis and M. Orrit, Science, 2002, 297, 1160 CrossRef CAS.
- Stéphane Berciaud, Laurent Cognet, Gerhard A. Blab and Brahim Lounis, Photothermal Heterodyne Imaging of Individual Nonfluorescent Nanoclusters and Nanocrystals, Phys. Rev. Lett., 2004, 93, 257402 CrossRef.
- G. A. Blab, L. Cognet, S. Berciaud, I. Alexandre, D. Husar, J. Remacle and B. Lounis, Biophys. J., 2006, 91(12), 4598 CrossRef CAS.
- Thomas Kalkbrenner, Ulf Ha°kanson and Vahid Sandoghdar, Tomographic Plasmon Spectroscopy of a Single Gold Nanoparticle, Nano Lett., 2004, 4, 2309 CrossRef CAS.
- T. Hellerer, C. Axäng, C. Brackmann, P. Hillertz, M. Pilon and M. Enejder, Monitoring of lipid storage in Caenorhabditis elegans using coherent anti-Stokes Raman scattering (CARS) microscopy, Proc. Natl. Acad. Sci. U. S. A., 2007, 104, 14658–14663 CrossRef CAS.
- T. T. Le, H. M. Duren, M. N. Slipchenko, C. D. Hu and J. X. Cheng, Label-free quantitative analysis of lipid metabolism in living Caenorhabditis elegans, J. Lipid Res., 2010, 51, 672, DOI:10.1194/jlr.D000638 (in press); ePub ahead of print.
- H. Schmidt, J. Blum, K. Sowoidnich, B. Sumpf, F. Schwagele and H. D. Kronfeldt, In-situ characterization of meat aging with diode-laser Raman spectroscopy, Proc SPIE, 2009, 7315, 731509, DOI:10.1117/12.818182.
- Y. Ozaki, A. Mizuno, K. Itoh, M. Yoshiura, T. Iwamoto and K. Iriyama, Raman spectroscopic study of age-related structural changes in the lens proteins of an intact mouse lens, Biochemistry, 1983, 22, 6254–6259 CrossRef CAS.
- H. Yao, Z. Tao, M. Ai, L. Peng, G. Wang, B. He and Y. Li, Raman spectroscopic analysis of apoptosis of single human gastric cancer cells, Vib. Spectrosc., 2009, 50, 193–197 CrossRef CAS.
- A. S. Biris, E. I. Galanzha, Z. Li, M. Mahmood, Y. Xu and V. P. Zharov, In vivo Raman flow cytometry for real-time detection of carbon nanotube kinetics in lymph, blood, and tissues, J. Biomed. Opt., 2009, 14, 021006, DOI:10.1117/1.3119145.
- A. S. Biris, D. Boldor, J. Palmer, W. T. Monroe, M. Mahmood, E. Dervishi, Y. Xu, Z. Li, E. I. Galanzha and V. P. Zharov, Nanophotothermolysis of multiple scattered cancer cells with carbon nanotubes guided by time-resolved infrared thermal imaging, J. Biomed. Opt., 2009, 14, 021007 CrossRef.
- X. L. Yan, R. X. Dong, L. Zhang, X. J. Zhang and Z. W. Zhang, Raman spectra of single cells from gastrointestinal cancer patients, World J Gastroenterol, 2005, 11, 3290–3292 Search PubMed.
- I. Pavel, E. McCarney, A. Elkhaled, A. Morrill, K. Plaxco and M. Moskovits, Label-free SERS detection of small proteins modified to act as bifunctional linkers, J. Phys. Chem. C, 2008, 112, 4880–4883 CrossRef CAS.
- M. Sládková, B. Vlčková, I. Pavel, K. Šišková and M. Šlouf, Surface-enhanced Raman scattering from a single molecularly bridged silver nanoparticle aggregate, J. Mol. Struct., 2009, 924–926, 567–570 CrossRef CAS.
- I. Pavel, E. McCarney, A. Elkhaled, A. Morrill, K. Plaxco and M. Moskovits, Label-Free SERS Detection of Small Proteins Modified to Act as Bifunctional Linkers, J Phys Chem C Nanomater Interfaces, 2008, 112, 4880–4883 Search PubMed.
- C. Song, Z. Wang, R. Zhang, J. Yang, X. Tan and Y. Cui, Highly sensitive immunoassay based on Raman reporter-labeled immuno-Au aggregates and SERS-active immune substrate, Biosens. Bioelectron., 2009, 25, 826–831 CrossRef CAS.
- E. A. Vitol, Z. Orynbayeva, M. J. Bouchard, J. zizkhan-Clifford, G. Friedman and Y. Gogotsi, In situ intracellular spectroscopy with surface enhanced Raman spectroscopy (SERS)-enabled nanopipettes, ACS Nano, 2009, 3, 3529–3536 CrossRef CAS.
- T. Vo-Dinh, H. N. Wang and J. Scaffidi, Plasmonic nanoprobes for SERS biosensing and bioimaging, J Biophotonics, 2009 Search PubMed.
- X. M. Qian and S. M. Nie, Chem. Soc. Rev., 2008, 37, 912 RSC.
- Geoffrey von Maltzahn, Andrea Centrone, Ji-Ho Park, Renuka Ramanathan, Michael J. Sailor, T. Alan Hatton, Sangeeta and N. Bhatia, Adv. Mater., 2009, 21, 3175–3180 CrossRef.
- A. Centrone, E. Penzo, M. Sharma, J. W. Myerson, A. M. Jackson, N. Marzari and F. Stellacci, Proc. Natl. Acad. Sci. U. S. A., 2008, 105, 9886 CrossRef CAS.
- S. M. Nie and S. R. Emery, Science, 1997, 275, 1102 CrossRef CAS.
- William E. Doering and Shuming Nie, J. Phys. Chem. B, 2002, 106, 311 CrossRef CAS.
- Laurent Cognet and Brahim Lounis, Ultra-sensitive detection of individual gold nanoparticles: spectroscopy and applications to biology, Gold Bulletin, 2008, 139, 41/2.
- V. P. Zharov, E. I. Galanzha, E. V. Shashkov, N. G. Khlebtsov and V. V. Tuchin, In vivo photoacoustic flow cytometry for monitoring of circulating single cancer cells and contrast agents, Opt. Lett., 2006, 31, 3623–3625 Search PubMed.
- V. Zharov, K. Mercer, E. Galitovskaya, M. Smeltzer, Biophysical Journal, Volume 90, Issue 2, Pages 619–627 Search PubMed.
- Maaike Everts, Vaibhav Saini, Jennifer L. Leddon, Robbert J. Kok, Mariam Stoff-Khalili, Meredith A. Preuss, C. Leigh Millican, Guy Perkins, Joshua M. Brown, Hitesh Bagaria, David E. Nikles, Duane T. Johnson, Vladimir P. Zharov and David T. Curiel, Nano Lett., 2006, 6, 587 CrossRef CAS.
- Eugene V. Krotov, Maxim V. Zhadobov, Alexander M. Reyman, Grigory P. Volkov and Vladimir P. Zharov, Appl. Phys. Lett., 2002, 81, 3918 CrossRef.
- Bong-Hyun Jun, Mi Suk Noh, Jaeyun Kim, Gunsung Kim, Homan Kang, Min-Soo Kim, Young-Tae Seo, Jongho Baek, Jong-Ho Kim, Juyoung Park, Seongyong Kim, Yong-Kweon Kim, Taeghwan Hyeon, Myung-Haing Cho, Dae Hong Jeong and Yoon-Sik Lee, Small, 2010, 6(1), 119–125 CrossRef CAS.
- Jin-Woo Kim, Ekaterina I. Galanzha, Evgeny V. Shashkov, Hyung-Mo Moon and Vladimir P. Zharov, Golden carbon nanotubes as multimodal photoacoustic and photothermal high-contrast molecular agents, Nat. Nanotechnol., 2009, 4, 688 CrossRef CAS.
- Sang-Kee Eah, Heinrich M. Jaeger, Norbert F. Scherer, Gary P. Wiederrecht and Xiao-Min Lin, Appl. Phys. Lett., 2005, 86, 031902 CrossRef.
- David S. Sebba, Dakota A. Watson and John P. Nolan, ACS Nano, 2009, 3, 1477 CrossRef CAS.
- Kazunari Matsuda, Tadashi Inoue, Yoichi Murakami, Shigeo Maruyama and Yoshihiko Kanemitsu, Phys. Rev. B: Condens. Matter Mater. Phys., 2008, 77, 193405 CrossRef.
- Koshin Hosoki, Takeshi Tayagaki, Shinpei Yamamoto, Kazunari Matsuda and Yoshihiko Kanemitsu, Phys. Rev. Lett., 2008, 100, 207404 CrossRef.
| This journal is © The Royal Society of Chemistry 2010 |


