Facile synthesis of lanthanide nanoparticles with paramagnetic, down- and up-conversion properties†
Zhengquan
Li
a and
Yong
Zhang
*ab
aDivision of Bioengineering, Faculty of Engineering, National University of Singapore, 7 Engineering Drive 1, Singapore 117574. E-mail: biezy@nus.edu.sg; Fax: +65-68723069; Tel: +65-65164871
bNanoscience & Nanotechnology Initiative, National University of Singapore, 9 Engineering Drive 1, Singapore 117576
First published on 23rd April 2010
Abstract
Lanthanide materials play an important role in biomedical researches, among which paramagnetic, down- and up-conversion lanthanide nanoparticles are of particular interest. However, little effort has been made to develop versatile lanthanide nanoparticles with these properties combined in a single particle. Herein, we present a facile strategy to make multifunctional lanthanide nanoparticles by doping sensitized lanthanide complexes into porous silica coated on up-conversion NaYF4 nanocrystals. The nanoparticles not only show strong down- and up-conversion fluorescence but also exhibit high magnetic resonance properties.
1. Introduction
Lanthanide complexes and nanoparticles can serve as excellent fluorescent probes in various biomedical researches, due to their sharp fluorescence emission peaks, high quantum efficiency, bright and monochromatic emissions, large Stokes shift, and extraordinarily long fluorescence lifetime.1–7 Fluorescent lanthanide materials could be roughly divided into two types based on their fluorescence emission mechanism: down-conversion (DC) and up-conversion (UC). Down-converting lanthanide materials have demonstrated to be useful in fast screening and quantitative detection of biological samples, while up-converting materials have shown some unique optical properties, for example, high light penetration depth in biological tissues, low photo-damage to cells/tissues and low auto-fluorescence due to the excitation in the NIR window.8–13 In addition, many lanthanide ions such as Gd3+ exhibit remarkable paramagnetic properties and have been used in magnetic resonance imaging (MRI) as a contrast agent.14 Although lanthanide nanoparticles with single or dual functions have been developed, little has been done to develop a three-in-one lanthanide nanoparticle with combined paramagnetic, DC and UC properties in a single particle. Furthermore, it has not been reported how to make a single nanoparticle with both DC and UC fluorescence emission.For biomedical applications, there is a great interest to develop multimodal probes that can be used with both MRI scanner and fluorescence based optical devices.15 Co-registration of MRI contrast agents and fluorescent probes with high 3D spatial resolution and high sensitivity may provide consecutive and complementary information during diseases diagnosis and therapy. Many hybrid nanoparticles having the capacity of being detected in dual modalities have been reported,16–23 However, most of the phosphors used are down-converting fluorescent materials such as organic dyes and quantum dots which are known to display many intrinsic limitations.24 On the other hand, to visualize complex biological or pathological process at the molecular level, multiplexing fluorescence imaging is a powerful tool. This stimulates the interest to develop fluorescent probes which could be simultaneously excited at different wavelengths by different light sources.25,26 As such, combination of MRI contrast agents, DC and UC phosphors into a single particle will highly facilitate the use of the nanoparticles in many biomedical applications.
We have recently developed a method to make lanthanide nanoparticles with both paramagnetic and upconversion fluorescent properties by coating paramagnetic gadolinium complexes (Gd-DTTA) onto upconverting fluorescent nanocrystals.16 Using this method, no DC emission was observed from the nanoparticles when down-converting lanthanide ions such as Tb3+ and Eu3+ were complexed to DTTA, although these ions could form a strong complex with DTTA. However, if a suitable sensitizer is used to replace DTTA and the energy absorbed by the sensitizer can be efficiently transferred to lanthanide ions, it is possible to make the nanoparticles with DC emission. Herein, we present a facile strategy to synthesize upconverting lanthanide nanoparticles coated with sensitized lanthanide complexes with paramagnetic property and DC fluorescence emission, to combine the three properties into single nanoparticles. The energy transfer from the upconverting nanocrystals to down-converting lanthanide complexes is also studied. The nanoparticles with such a structure also have other advantages: (1) the lanthanide ions emitting UC and DC fluorescence are located in the core and shell respectively, so non-radiative transition between these ions is unlikely to occur and the crosstalk between these signals is minimum; (2) multi-color UC phosphors could be made based on the fluorescence resonance energy transfer (FRET) from the UC nanocrystals to the sensitized DC complexes; (3) magnetic lanthanide ions are located in the porous silica shell and stand a very good chance of getting in direct contact with water when used in a solution, so the magnetic resonance signal is greatly enhanced.
2. Result and discussion
Transmission electron microscope (TEM) images of the prepared NaYF4![[thin space (1/6-em)]](https://www.rsc.org/images/entities/char_2009.gif) :
:![[thin space (1/6-em)]](https://www.rsc.org/images/entities/char_2009.gif) Yb,Er@Si-DTPA-4-AS nanoparticles are shown in Fig. 1a, b. The nanoparticles have a uniform core-shell structure with narrow size distribution. The NaYF4 nanocrystal core is about 20 nm in diameter,27 and the shell is about 12 nm thick. Many nano holes are found in the silica shell. A thicker silica shell can be formed when more reagents are added during the formation of the organo-silica shell (Fig. 1c). As illustrated in Fig. 1d, the Si-DTPA-4-AS complex doped in the silica shell provides numerous active reaction sites for covalently binding various lanthanide ions such as Tb and Gd. The 4-AS group is a sensitizer for energy transfer to lanthanide ions and the DTPA group could irreversibly bind to lanthanide ions.
Yb,Er@Si-DTPA-4-AS nanoparticles are shown in Fig. 1a, b. The nanoparticles have a uniform core-shell structure with narrow size distribution. The NaYF4 nanocrystal core is about 20 nm in diameter,27 and the shell is about 12 nm thick. Many nano holes are found in the silica shell. A thicker silica shell can be formed when more reagents are added during the formation of the organo-silica shell (Fig. 1c). As illustrated in Fig. 1d, the Si-DTPA-4-AS complex doped in the silica shell provides numerous active reaction sites for covalently binding various lanthanide ions such as Tb and Gd. The 4-AS group is a sensitizer for energy transfer to lanthanide ions and the DTPA group could irreversibly bind to lanthanide ions.
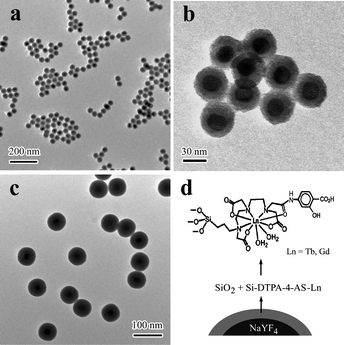 | ||
Fig. 1 TEM images of NaYF4![[thin space (1/6-em)]](https://www.rsc.org/images/entities/char_2009.gif) : :![[thin space (1/6-em)]](https://www.rsc.org/images/entities/char_2009.gif) Yb,Er@Si-DTPA-4-AS nanoparticles with a 10 nm (a, b) and 25 nm (c) thick silica shell, and schematic illustration of the nanoparticles with lanthanide complexes doped in the silica shell (NaYF4 Yb,Er@Si-DTPA-4-AS nanoparticles with a 10 nm (a, b) and 25 nm (c) thick silica shell, and schematic illustration of the nanoparticles with lanthanide complexes doped in the silica shell (NaYF4![[thin space (1/6-em)]](https://www.rsc.org/images/entities/char_2009.gif) : :![[thin space (1/6-em)]](https://www.rsc.org/images/entities/char_2009.gif) Yb,Er@Si-DTPA-4-AS-Ln, Ln = Gd, Tb). Yb,Er@Si-DTPA-4-AS-Ln, Ln = Gd, Tb). | ||
As shown in Fig. 2, once metalized with Tb ions, the NaYF4![[thin space (1/6-em)]](https://www.rsc.org/images/entities/char_2009.gif) :
:![[thin space (1/6-em)]](https://www.rsc.org/images/entities/char_2009.gif) Yb,Er@Si-DTPA-4-AS nanoparticles emitted multicolor DC fluorescence under the excitation of a UV lamp at 325 nm. The peaks at 489 nm, 545 nm, 586 nm and 620 nm are corresponding to the energy transitions from 5D4 to 7Fj (j = 6 − 3) of Tb ions.28 Meanwhile, these nanoparticles also emitted strong UC fluorescence when excited by a 980 NIR laser. The peaks at 408 nm, 521 nm, 539 nm and 651 nm are corresponding to the energy transitions from 2H13/2, 2H11/2, 4S3/2 and 4F9/2 to 4I15/2 of Er3+ ions. When NaYF4
Yb,Er@Si-DTPA-4-AS nanoparticles emitted multicolor DC fluorescence under the excitation of a UV lamp at 325 nm. The peaks at 489 nm, 545 nm, 586 nm and 620 nm are corresponding to the energy transitions from 5D4 to 7Fj (j = 6 − 3) of Tb ions.28 Meanwhile, these nanoparticles also emitted strong UC fluorescence when excited by a 980 NIR laser. The peaks at 408 nm, 521 nm, 539 nm and 651 nm are corresponding to the energy transitions from 2H13/2, 2H11/2, 4S3/2 and 4F9/2 to 4I15/2 of Er3+ ions. When NaYF4![[thin space (1/6-em)]](https://www.rsc.org/images/entities/char_2009.gif) :
:![[thin space (1/6-em)]](https://www.rsc.org/images/entities/char_2009.gif) Yb,Tm nanocrystals were used as the core, two blue emissions (450 nm and 479 nm) were observed, owing to the transitions of 1D2 to 3F4 and 1G4 to 3H6 of Tm3+ ions, respectively.27 The spectra indicated that both DC or UC emission peaks are in the visible range, suggesting that multicolor fluorescence emission could be achieved in a single nanoparticle under either UV or NIR excitation. The fluorescence from the lanthanide nanoparticles under excitation of different light sources could be observed by our naked eyes and photographs were taken (Figure S1, ESI†). For imaging applications, fluorescence with certain colors could be selected and measured by using band-pass filters installed with the optical microscope.
Yb,Tm nanocrystals were used as the core, two blue emissions (450 nm and 479 nm) were observed, owing to the transitions of 1D2 to 3F4 and 1G4 to 3H6 of Tm3+ ions, respectively.27 The spectra indicated that both DC or UC emission peaks are in the visible range, suggesting that multicolor fluorescence emission could be achieved in a single nanoparticle under either UV or NIR excitation. The fluorescence from the lanthanide nanoparticles under excitation of different light sources could be observed by our naked eyes and photographs were taken (Figure S1, ESI†). For imaging applications, fluorescence with certain colors could be selected and measured by using band-pass filters installed with the optical microscope.
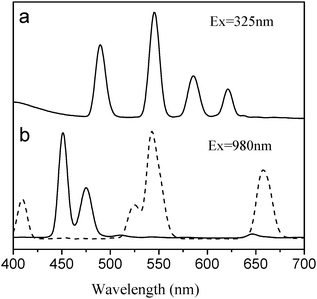 | ||
Fig. 2 Fluorescence emission spectrum of NaYF4![[thin space (1/6-em)]](https://www.rsc.org/images/entities/char_2009.gif) : :![[thin space (1/6-em)]](https://www.rsc.org/images/entities/char_2009.gif) Yb,Er@Si-DTPA-4-AS-Tb nanoparticles excited by a UV lamp at 325 nm (a) and up-conversion fluorescence spectra of NaYF4 Yb,Er@Si-DTPA-4-AS-Tb nanoparticles excited by a UV lamp at 325 nm (a) and up-conversion fluorescence spectra of NaYF4![[thin space (1/6-em)]](https://www.rsc.org/images/entities/char_2009.gif) : :![[thin space (1/6-em)]](https://www.rsc.org/images/entities/char_2009.gif) Yb,Er@Si-DTPA-4-AS-Tb (solid line) and NaYF4 Yb,Er@Si-DTPA-4-AS-Tb (solid line) and NaYF4![[thin space (1/6-em)]](https://www.rsc.org/images/entities/char_2009.gif) : :![[thin space (1/6-em)]](https://www.rsc.org/images/entities/char_2009.gif) Yb,Tm@Si-DTPA-4-AS (dot line) nanoparticles excited by a NIR laser at 980 nm (b). Yb,Tm@Si-DTPA-4-AS (dot line) nanoparticles excited by a NIR laser at 980 nm (b). | ||
The Tb3+ fluorescence was also observed when the NaYF4![[thin space (1/6-em)]](https://www.rsc.org/images/entities/char_2009.gif) :
:![[thin space (1/6-em)]](https://www.rsc.org/images/entities/char_2009.gif) Yb,Tm@Si-DTPA-4-AS-Tb nanoparticles were excited by the NIR laser. This is based on a FRET process. The NaYF4
Yb,Tm@Si-DTPA-4-AS-Tb nanoparticles were excited by the NIR laser. This is based on a FRET process. The NaYF4![[thin space (1/6-em)]](https://www.rsc.org/images/entities/char_2009.gif) :
:![[thin space (1/6-em)]](https://www.rsc.org/images/entities/char_2009.gif) Yb,Tm nanocrystals have two emission peaks at 345 nm and 360 nm in the UV region, while the sensitizer has a broad excitation band centered at 325 nm which partially overlaps with the emission peaks of the NaYF4
Yb,Tm nanocrystals have two emission peaks at 345 nm and 360 nm in the UV region, while the sensitizer has a broad excitation band centered at 325 nm which partially overlaps with the emission peaks of the NaYF4![[thin space (1/6-em)]](https://www.rsc.org/images/entities/char_2009.gif) :
:![[thin space (1/6-em)]](https://www.rsc.org/images/entities/char_2009.gif) Yb,Tm nanocrystals (Figure S4, ESI†). Therefore, when excited by the NIR laser, the sensitizer could be excited by the light emitted from the UC nanocrystals, and then transfers the energy to Tb ions and emit their fluorescence. The UC fluorescence spectra of the NaYF4
Yb,Tm nanocrystals (Figure S4, ESI†). Therefore, when excited by the NIR laser, the sensitizer could be excited by the light emitted from the UC nanocrystals, and then transfers the energy to Tb ions and emit their fluorescence. The UC fluorescence spectra of the NaYF4![[thin space (1/6-em)]](https://www.rsc.org/images/entities/char_2009.gif) :
:![[thin space (1/6-em)]](https://www.rsc.org/images/entities/char_2009.gif) Yb,Tm@Si-DTPA-4-AS-Tb nanoparticles are shown in Fig. 3. With the increase in Tb concentration, a new UC emission peak at about 545 nm increasingly emerged, which is corresponding to the emission from Tb. Meanwhile, the peak at 398 nm, corresponding to the emission of the sensitizer, increased a little only, suggesting that most of the energy adsorbed from the nanocrystals has been transferred to Tb. Using the same method, it is possible to produce nanoparticles with multi-color upconversion emission based on FRET. Some other sensitizers with an excitation peak near 350 nm could also be used such as carbosytril-124 (cs124).29
Yb,Tm@Si-DTPA-4-AS-Tb nanoparticles are shown in Fig. 3. With the increase in Tb concentration, a new UC emission peak at about 545 nm increasingly emerged, which is corresponding to the emission from Tb. Meanwhile, the peak at 398 nm, corresponding to the emission of the sensitizer, increased a little only, suggesting that most of the energy adsorbed from the nanocrystals has been transferred to Tb. Using the same method, it is possible to produce nanoparticles with multi-color upconversion emission based on FRET. Some other sensitizers with an excitation peak near 350 nm could also be used such as carbosytril-124 (cs124).29
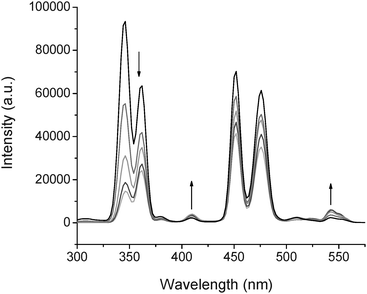 | ||
Fig. 3 Up-conversion emissions spectra of 1 mM NaYF4![[thin space (1/6-em)]](https://www.rsc.org/images/entities/char_2009.gif) : :![[thin space (1/6-em)]](https://www.rsc.org/images/entities/char_2009.gif) Yb,Tm@Si-DTPA-4-AS nanoparticles metalized with different concentrations of Tb (from 0.2 mM to 1 mM). Yb,Tm@Si-DTPA-4-AS nanoparticles metalized with different concentrations of Tb (from 0.2 mM to 1 mM). | ||
The fluorescence intensity of the NaYF4![[thin space (1/6-em)]](https://www.rsc.org/images/entities/char_2009.gif) :
:![[thin space (1/6-em)]](https://www.rsc.org/images/entities/char_2009.gif) Yb,Er@Si-DTPA-4-AS-Tb nanoparticles could be controlled by changing the amount of Tb. Fig. 4a shows that the fluorescence intensity of the nanoparticles increased nearly linearly when the amount of Tb was increased from 0.2 mM to 1 mM. Meanwhile, the fluorescence intensity of the sensitizer gradually decreased, suggesting an efficient energy transfer from the sensitizer to the lanthanide ions. Although a nonlinear energy transfer from the sensitizer to Gd3+ was found (Fig. 4b), the fluorescence of the nanoparticles could still be well controlled by controlling the Tb concentration, even if both Tb and Gd ions were present in the nanoparticle (Fig. 4c). With the same concentration of Tb, the fluorescence intensities of the nanoparticles metalized with pure Tb or Tb/Gd are comparable. The results showed that the fluorescence from Tb is not affected by Gd and multi-function of the nanoparticles could be achieved by co-doping of lanthanide ions. The fluorescence stability of the NaYF4
Yb,Er@Si-DTPA-4-AS-Tb nanoparticles could be controlled by changing the amount of Tb. Fig. 4a shows that the fluorescence intensity of the nanoparticles increased nearly linearly when the amount of Tb was increased from 0.2 mM to 1 mM. Meanwhile, the fluorescence intensity of the sensitizer gradually decreased, suggesting an efficient energy transfer from the sensitizer to the lanthanide ions. Although a nonlinear energy transfer from the sensitizer to Gd3+ was found (Fig. 4b), the fluorescence of the nanoparticles could still be well controlled by controlling the Tb concentration, even if both Tb and Gd ions were present in the nanoparticle (Fig. 4c). With the same concentration of Tb, the fluorescence intensities of the nanoparticles metalized with pure Tb or Tb/Gd are comparable. The results showed that the fluorescence from Tb is not affected by Gd and multi-function of the nanoparticles could be achieved by co-doping of lanthanide ions. The fluorescence stability of the NaYF4![[thin space (1/6-em)]](https://www.rsc.org/images/entities/char_2009.gif) :
:![[thin space (1/6-em)]](https://www.rsc.org/images/entities/char_2009.gif) Yb,Er@Si-DTPA-4-AS-Tb,Gd nanoparticles for up to 10 days was also studied and the results are given in Fig. 5d. It is important to use a proper sensitizer for the lanthanide complex, as lower fluorescence intensity was observed when 5-AS was used to replace 4-AS as a sensitizer (Figure 2S and S3, ESI†).
Yb,Er@Si-DTPA-4-AS-Tb,Gd nanoparticles for up to 10 days was also studied and the results are given in Fig. 5d. It is important to use a proper sensitizer for the lanthanide complex, as lower fluorescence intensity was observed when 5-AS was used to replace 4-AS as a sensitizer (Figure 2S and S3, ESI†).
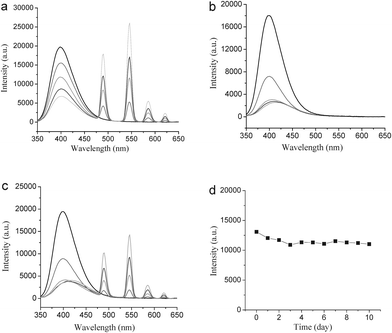 | ||
Fig. 4 Fluorescence emission spectra of 1 mM NaYF4![[thin space (1/6-em)]](https://www.rsc.org/images/entities/char_2009.gif) : :![[thin space (1/6-em)]](https://www.rsc.org/images/entities/char_2009.gif) Yb,Er@Si-DTPA-4-AS-Ln3+ nanoparticles solution, (Ln: a, pure Tb; b, pure Gd; c, Tb and Gd with equal amount), with different concentrations of lanthanide ions (0.2 mM, black line; 0.4 mM, red line; 0.6 mM, green line; 0.8 mM blue line; 1 mM, cyan line), and fluorescence intensity of 1 mM NaYF4 Yb,Er@Si-DTPA-4-AS-Ln3+ nanoparticles solution, (Ln: a, pure Tb; b, pure Gd; c, Tb and Gd with equal amount), with different concentrations of lanthanide ions (0.2 mM, black line; 0.4 mM, red line; 0.6 mM, green line; 0.8 mM blue line; 1 mM, cyan line), and fluorescence intensity of 1 mM NaYF4![[thin space (1/6-em)]](https://www.rsc.org/images/entities/char_2009.gif) : :![[thin space (1/6-em)]](https://www.rsc.org/images/entities/char_2009.gif) Yb,Er@Si-DTTA-Gd,Tb(1 Yb,Er@Si-DTTA-Gd,Tb(1![[thin space (1/6-em)]](https://www.rsc.org/images/entities/char_2009.gif) : :![[thin space (1/6-em)]](https://www.rsc.org/images/entities/char_2009.gif) 1) nanoparticles solution measured at 545 nm with time (d). 1) nanoparticles solution measured at 545 nm with time (d). | ||
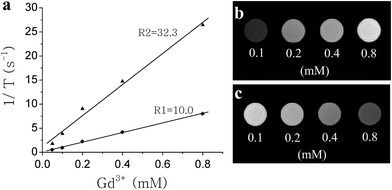 | ||
Fig. 5 Longitudinal (R1) and transverse (R2) relaxivities of NaYF4![[thin space (1/6-em)]](https://www.rsc.org/images/entities/char_2009.gif) : :![[thin space (1/6-em)]](https://www.rsc.org/images/entities/char_2009.gif) Yb,Er@Si-DTPA-4-AS-Gd3+ nanoparticles (a) and T1-weighted (TR = 400 ms, TE = 8 ms) (b) and T2-weighted (TR = 3000 ms, TE = 16 ms) (c) MR images of aqueous NaYF4 Yb,Er@Si-DTPA-4-AS-Gd3+ nanoparticles (a) and T1-weighted (TR = 400 ms, TE = 8 ms) (b) and T2-weighted (TR = 3000 ms, TE = 16 ms) (c) MR images of aqueous NaYF4![[thin space (1/6-em)]](https://www.rsc.org/images/entities/char_2009.gif) : :![[thin space (1/6-em)]](https://www.rsc.org/images/entities/char_2009.gif) Yb,Er@Si-DTPA-4-AS-Gd3+ nanoparticles solution with different Gd3+ concentrations. Yb,Er@Si-DTPA-4-AS-Gd3+ nanoparticles solution with different Gd3+ concentrations. | ||
The MR relaxivity of the NaYF4![[thin space (1/6-em)]](https://www.rsc.org/images/entities/char_2009.gif) :
:![[thin space (1/6-em)]](https://www.rsc.org/images/entities/char_2009.gif) Yb,Er@Si-DTPA-4-AS nanoparticles metalized with Gd3+ is shown in Fig. 5a. The longitudinal (R1) and transverse (R2) relaxivities of the nanoparticles are 10.0 mM−1 s−1 and 32.3 mM−1 s−1 on a per millimolar Gd3+ basis, respectively. The MR relativity data are impressive when compared with some commonly used contrast agents such as Gd-DTPA (R1 = 3.7 mM−1 s−1 and R2 = 5.8 mM−1 s−1 on a per Gd3+ basis).14 In particular, if calculated on a per millimolar nanoparticle basis, the lanthanide nanoparticles can reach a remarkably high relaxivity value because a single nanoparticle has carried numerous Gd3+ ions inside. This suggests that the lanthanide nanoparticles have the potential to provide a better signal when used for MRI due to their high content of Gd3+, in contrast to single molecule-based MRI contrast agents.19T1-weighted and T2-weighted images of aqueous nanoparticles solution with different concentrations are given in Fig. 4b and 4c, respectively. The signal increased with the concentration of the nanoparticles under the T1-weighted mode, while the signal became darkened gradually with the increase of the nanoparticle concentration under the T2-weighted mode. The results suggested that the nanoparticles could be used for both T1- and T2-weighted MR imaging.
Yb,Er@Si-DTPA-4-AS nanoparticles metalized with Gd3+ is shown in Fig. 5a. The longitudinal (R1) and transverse (R2) relaxivities of the nanoparticles are 10.0 mM−1 s−1 and 32.3 mM−1 s−1 on a per millimolar Gd3+ basis, respectively. The MR relativity data are impressive when compared with some commonly used contrast agents such as Gd-DTPA (R1 = 3.7 mM−1 s−1 and R2 = 5.8 mM−1 s−1 on a per Gd3+ basis).14 In particular, if calculated on a per millimolar nanoparticle basis, the lanthanide nanoparticles can reach a remarkably high relaxivity value because a single nanoparticle has carried numerous Gd3+ ions inside. This suggests that the lanthanide nanoparticles have the potential to provide a better signal when used for MRI due to their high content of Gd3+, in contrast to single molecule-based MRI contrast agents.19T1-weighted and T2-weighted images of aqueous nanoparticles solution with different concentrations are given in Fig. 4b and 4c, respectively. The signal increased with the concentration of the nanoparticles under the T1-weighted mode, while the signal became darkened gradually with the increase of the nanoparticle concentration under the T2-weighted mode. The results suggested that the nanoparticles could be used for both T1- and T2-weighted MR imaging.
3. Experimental section
3.1 Reagents and materials
All the reagents were purchased from Sigma-Aldrich and used directly without further purification. High-quality NaYF4:20%Yb,2%Er nanocrystals and NaYF4:20%Yb,0.3%Tm nanocrystals were synthesized using a user-friendly method we recently developed.27 The complex DTPA-4-AS was prepared according to a protocol reported previously,30 and then coupled to 3-aminopropyltriethoxysilane (APS) to form a silanized complex, Si-DTPA-4-AS.3.2 Synthesis of NaYF4![[thin space (1/6-em)]](https://www.rsc.org/images/entities/h3_char_2009.gif) :
:![[thin space (1/6-em)]](https://www.rsc.org/images/entities/h3_char_2009.gif) Yb,Er@Si-DTPA-4-AS nanoparticles
Yb,Er@Si-DTPA-4-AS nanoparticles
In a typical synthesis, a mixing solution of 4.5 mL Tri-100, 4.25 mL 1-hexanol, 40 mL cyclohexane, 0.75 mL aqueous ammonia (10 wt.%) and 5 mL of NaYF4![[thin space (1/6-em)]](https://www.rsc.org/images/entities/char_2009.gif) :
:![[thin space (1/6-em)]](https://www.rsc.org/images/entities/char_2009.gif) Yb,Er nanocrystal solution (0.02 M) were vigorously stirred in a 100 mL flask for 20 min to form a transparent microemulsion solution. Then, 25 uL of tetraethyl orthosilicate (TEOS) was added into the microemulsion and stirred for 12 h for initially depositing a thin silica layer on these nanocrystals. Subsequently, 100 uL of aqueous Si-DTPA-4-AS solution (0.1 M) and 40 uL of TEOS were added into the solution every 2 h for 5 times, followed by stirring for another 48 h. During this period, the Si-DTPA-4-AS complex and TEOS were cross-linked within the microemulsion and gradually formed an organo-silica shell on the NaYF4
Yb,Er nanocrystal solution (0.02 M) were vigorously stirred in a 100 mL flask for 20 min to form a transparent microemulsion solution. Then, 25 uL of tetraethyl orthosilicate (TEOS) was added into the microemulsion and stirred for 12 h for initially depositing a thin silica layer on these nanocrystals. Subsequently, 100 uL of aqueous Si-DTPA-4-AS solution (0.1 M) and 40 uL of TEOS were added into the solution every 2 h for 5 times, followed by stirring for another 48 h. During this period, the Si-DTPA-4-AS complex and TEOS were cross-linked within the microemulsion and gradually formed an organo-silica shell on the NaYF4![[thin space (1/6-em)]](https://www.rsc.org/images/entities/char_2009.gif) :
:![[thin space (1/6-em)]](https://www.rsc.org/images/entities/char_2009.gif) Yb,Er nanocrystals. Finally, the NaYF4
Yb,Er nanocrystals. Finally, the NaYF4![[thin space (1/6-em)]](https://www.rsc.org/images/entities/char_2009.gif) :
:![[thin space (1/6-em)]](https://www.rsc.org/images/entities/char_2009.gif) Yb,Er@Si-DTTA-4-AS nanoparticles were precipitated from the microemulsion solution by adding ethanol and washed with water–ethanol for three times. The nanoparticles were then dispersed in de-ionised (DI) water.
Yb,Er@Si-DTTA-4-AS nanoparticles were precipitated from the microemulsion solution by adding ethanol and washed with water–ethanol for three times. The nanoparticles were then dispersed in de-ionised (DI) water.
3.3 Metallization of NaYF4![[thin space (1/6-em)]](https://www.rsc.org/images/entities/h3_char_2009.gif) :
:![[thin space (1/6-em)]](https://www.rsc.org/images/entities/h3_char_2009.gif) Yb,Er@Si-DTPA-4-AS nanoparticles with lanthanide ions
Yb,Er@Si-DTPA-4-AS nanoparticles with lanthanide ions
Aliquot of the prepared NaYF4![[thin space (1/6-em)]](https://www.rsc.org/images/entities/char_2009.gif) :
:![[thin space (1/6-em)]](https://www.rsc.org/images/entities/char_2009.gif) Yb,Er@Si-DTTA-4-AS nanoparticles were dispersed in a 10 mL of 0.05M Tis-HCl buffer solution (pH = 7.4) with a concentration of 1 mM (on Si-DTTA-4-AS basis). Different volume (0∼1 mL) of aqueous lanthanide chloride (e.g. TbCl3 or GdCl3) solution (10 mM) was then dropwisely added inside the nanoparticles solution under stirring. After incubation for 12 h, the nanoparticles were centrifuged down and washed with water for at least three times and dispersed in DI water.
Yb,Er@Si-DTTA-4-AS nanoparticles were dispersed in a 10 mL of 0.05M Tis-HCl buffer solution (pH = 7.4) with a concentration of 1 mM (on Si-DTTA-4-AS basis). Different volume (0∼1 mL) of aqueous lanthanide chloride (e.g. TbCl3 or GdCl3) solution (10 mM) was then dropwisely added inside the nanoparticles solution under stirring. After incubation for 12 h, the nanoparticles were centrifuged down and washed with water for at least three times and dispersed in DI water.
3.4 Characterization
TEM images were recorded on a JEOL 2010F TEM operating at 200 kV. The TEM samples were prepared by dropping an ethanol solution of the nanoparticles on a carbon-film coated copper grid. The accurate concentrations of lanthanide ions were determined using a conductively coupled plasma-atomic emission spectrometry (ICP-AES). Fluorescence spectra were acquired on a SpetroPro 2150i fluorescence spectrometer equipped with both a high-pressure Hg lamp and a commercial 980 nm NIR laser. Magnetic relaxivity was measured from vials containing the nanoparticles and images were acquired using a 3 Tesla clinical magnetic resonance imaging scanner (Siemens Trio, Erlangen, Germany). A series of single echo (echo time (TE) = 8 ms) spin-echo images were acquired at nine repetition times (TR: 25–6400 ms) to obtain T1 relaxation times. T2 relaxation times were obtained from a single multi-echo spin-echo sequence (TR: 3000 ms) which acquired images at 32 echo times (TE: 8–256 ms). T1 values were obtained by fitting an increasing exponential function (saturation recovery equation) to signal-TR plot. T2 values were obtained by fitting a decreasing mono-exponential function to signal-TE plots. R1 and R2 were calculated as the slope of linear regression fits of inverse relaxation times (relaxation rates) plotted against Gd3+ concentration.4. Conclusions
In summary, we have developed a method to synthesize three-in-one multi-functional lanthanide nanoparticles with strong DC, UC fluorescence and high magnetic resonance properties in a single particle. Lanthanide complexes with DC fluorescence and paramagnetic property were doped into the porous silica coated on UC nanocrystals, and various lanthanide ions could be complexed for enhanced functionality. Nanoparticles with multi-color UC fluorescence could be produced via a FRET process. The method could also be used to make nanoparticles with additional functionality by attaching different lanthanide ions.Acknowledgements
We acknowledge financial support from Singapore A*STAR BMRC (grant number R-397-000-062-305) and National University of Singapore.References
- J. C. G. Bunzli, Acc. Chem. Res., 2006, 39, 53–61 CrossRef.
- D. Dosev, M. Nichkova and I. M. Kennedy, J. Nanosci. Nanotechnol., 2008, 8, 1052–1067 CAS.
- J. Georges, Analyst, 1993, 118, 1481–1486 RSC.
- J. Shen, L. D. Sun and C. H. Yan, Dalton Trans., 2008, 5687–5697 RSC.
- H. Siitari, I. Hemmila, E. Soini, T. Lovgren and V. Koistinen, Nature, 1983, 301, 258–260 CAS.
- F. Vetrone and J. A. Capobianco, Int. J. Nanotechnol., 2008, 5, 1306–1339 Search PubMed.
- J. L. Yuan and G. L. Wang, TrAC, Trends Anal. Chem., 2006, 25, 490–500 CrossRef CAS.
- N. M. Idris, Z. Q. Li, L. Ye, E. K. W. Sim, R. Mahendran, P. C. L. Ho and Y. Zhang, Biomaterials, 2009, 30, 5104–5113 CrossRef CAS.
- Z. Q. Li, Y. Zhang and S. Jiang, Adv. Mater., 2008, 20, 4765 CrossRef CAS.
- S. F. Lim, R. Riehn, W. S. Ryu, N. Khanarian, C. K. Tung, D. Tank and R. H. Austin, Nano Lett., 2006, 6, 169–174 CrossRef CAS.
- M. Wang, C. C. Mi, W. X. Wang, C. H. Liu, Y. F. Wu, Z. R. Xu, C. B. Mao and S. K. Xu, ACS Nano, 2009, 3, 1580–1586 CrossRef CAS.
- S. W. Wu, G. Han, D. J. Milliron, S. Aloni, V. Altoe, D. V. Talapin, B. E. Cohen and P. J. Schuck, Proc. Natl. Acad. Sci. U. S. A., 2009, 106, 10917–10921 CrossRef CAS.
- L. Q. Xiong, Z. G. Chen, M. X. Yu, F. Y. Li, C. Liu and C. H. Huang, Biomaterials, 2009, 30, 5592–5600 CrossRef CAS.
- M. Bottrill, L. K. Nicholas and N. J. Long, Chem. Soc. Rev., 2006, 35, 557–571 RSC.
- J. Kim, Y. Piao and T. Hyeon, Chem. Soc. Rev., 2009, 38, 372–390 RSC.
- Z. Q. Li, Y. Zhang, B. Shuter and N. M. Idris, Langmuir, 2009, 25, 12015–12018 CrossRef CAS.
- Z. Y. Liu, G. S. Yi, H. T. Zhang, J. Ding, Y. W. Zhang and J. M. Xue, Chem. Commun., 2008, 694–696 RSC.
- W. J. M. Mulder, R. Koole, R. J. Brandwijk, G. Storm, P. T. K. Chin, G. J. Strijkers, C. D. Donega, K. Nicolay and A. W. Griffioen, Nano Lett., 2006, 6, 1–6 CrossRef CAS.
- L. Prinzen, R. Miserus, A. Dirksen, T. M. Hackeng, N. Deckers, N. J. Bitsch, R. T. A. Megens, K. Douma, J. W. Heemskerk, M. E. Kooi, P. M. Frederik, D. W. Slaaf, M. van Zandvoort and C. P. M. Reutelingsperger, Nano Lett., 2007, 7, 93–100 CrossRef CAS.
- W. J. Rieter, J. S. Kim, K. M. L. Taylor, H. Y. An, W. L. Lin, T. Tarrant and W. B. Lin, Angew. Chem., Int. Ed., 2007, 46, 3680–3682 CrossRef CAS.
- S. Santra, R. P. Bagwe, D. Dutta, J. T. Stanley, G. A. Walter, W. Tan, B. M. Moudgil and R. A. Mericle, Adv. Mater., 2005, 17, 2165–2169 CrossRef CAS.
- C. P. Tsai, Y. Hung, Y. H. Chou, D. M. Huang, J. K. Hsiao, C. Chang, Y. C. Chen and C. Y. Mou, Small, 2008, 4, 186–191 CrossRef CAS.
- C. L. Wu, J. Q. Hong, X. Q. Guo, C. B. Huang, J. P. Lai, J. S. Zheng, J. B. Chen, X. Mu and Y. B. Zhao, Chem. Commun., 2008, 750–752 RSC.
- F. Wang, W. B. Tan, Y. Zhang, X. P. Fan and M. Q. Wang, Nanotechnology, 2006, 17, R1–R13 CrossRef.
- H. Hu, L. Q. Xiong, J. Zhou, F. Y. Li, T. Y. Cao and C. H. Huang, Chem.–Eur. J., 2009, 15, 3577–3584 CrossRef CAS.
- P. Li, Q. Peng and Y. D. Li, Adv. Mater., 2009, 21, 1945–1948 CrossRef CAS.
- Z. Q. Li and Y. Zhang, Nanotechnology, 2008, 19, 345606 CrossRef.
- T. Terai, K. Kikuchi, S. Y. Iwasawa, T. Kawabe, Y. Hirata, Y. Urano and T. Nagano, J. Am. Chem. Soc., 2006, 128, 6938–6946 CrossRef CAS.
- M. Li and P. R. Selvin, J. Am. Chem. Soc., 1995, 117, 8132–8138 CrossRef CAS.
- M. P. Bailey, B. F. Rocks and C. Riley, Analyst, 1984, 109, 1449–1450 RSC.
Footnote |
| † Electronic supplementary information (ESI) available: Fluorescence images of the nanoparticle solutions; illustration of the modified complex and DC emission spectra of the nanoparticles; FTIR spectra. See DOI: 10.1039/c0nr00073f/ |
| This journal is © The Royal Society of Chemistry 2010 |
