Size and size distribution balance the dispersion of colloidal CeO2 nanoparticles in organic solvents†
Toshihiko
Arita
*a,
Jungwoo
Yoo
a,
Yu
Ueda
a and
Tadafumi
Adschiri
b
aInstitute of Multidisciplinary Research for Advanced Materials, Tohoku University, 2-1-1 Katahira, Aobaku, Sendai 980-8577, Japan. E-mail: tarita@tagen.tohoku.ac.jp; Fax: (+81) 22-217-5631; Tel: (+81) 22-217-5630
bWPI Research Center: Advanced Institute for Materials Research, Tohoku University, 2-1-1 Katahira, Aobaku, Sendai 980-8577, Japan
First published on 22nd February 2010
Abstract
Colloidal CeO2 nanoparticles (HNPs) stabilized with a decanoic fatty acid self-assembled monolayer (SAM) (decHNPs) showed very good dispersibility, i.e., perfect dispersion in cyclohexane up to 20 wt%. However, the HNPs stabilized with a dodecanoic acid SAM (dodHNPs) did not show good dispersion, i.e., at most 0.2 wt%. Interestingly, when we mixed equal portions of 5 wt% decHNPs in cyclohexane and 2 wt% dodHNPs in cyclohexane, the mixture showed much better dispersion than 1 wt% of dodHNPs in cyclohexane. This might indicate that the size and size distribution of the major components of the HNP solution are the most dominant factors for determining the dispersibility of HNPs in solution.
Conducting studies on nanoparticles (NPs) is very important in several research branches of nanotechnology, since nano-sized materials are used for manufacturing nano-sized devices. In order to develop science and technology of NPs, it is apparent that we need to improve the handling of NPs.1,2 Considerable improvements in the handling of NPs have been achieved, and the surface modification of NPs is considered to be a promising method for avoiding the aggregation of NPs.1,3 It is also important to understand the dispersion mechanism of NPs in solvents.4,5 In all cases, it is essential to develop NPs that can perfectly disperse in a solvent. There are several techniques to obtain surface-modified NPs, such as coating the surface of NPs after they are synthesized, and in situ surface modification synthesis of NPs. Among these techniques, we have focused on supercritical hydrothermal synthesis of in situ surface-modified NPs.6 Our surface-modified NPs such as CeO2 NPs have accurately controlled shape and size distributions, as reported elsewhere.7,8 Recently, we have verified that surface modifiers (fatty acids) were arrayed as a self-assembled monolayer (SAM) and that the wet state SAM behaved similar to that of a high-density polymer brush.9 In addition, we have found that NPs showed very good dispersity in several nonpolar organic solvents.10
In this paper, we propose a novel concept for understanding the dispersion of surface-modified NPs in liquid media, which emphasizes the importance of the potential balance between the NPs dissolved in solution and the relaxation time to reach dispersion equilibrium of the NP solution system. To the best of our knowledge, thus far, no experimental fact has been reported that considers the size distribution effect of nanofluids and the relaxation of solutions concurrently. It is possible that the interparticle potentials between nanoparticles are well balanced in a nanofluid, which is under a perfect dispersion state.11 If we unbalance the interparticle potential distribution of the solution, a relaxation may occur quickly and the perfect dispersion will collapse. In other words, the dispersion of NPs in a liquid system may strongly depend on the interparticle potential distribution of the NPs. In the case of the NPs covered with a dense surface modifier monolayer, the electrostatic repulsion force between NPs does not have to be considered.12–15 The dominant force between NPs can be described by van der Waals attractive forces and osmotic and elastic repulsions due to the modifier layer should be taken into account in the frame of DLVO theory16 which has been used to explain and describe the dispersion of colloidal solutions.17,18 The image of such a dispersion state is shown in Scheme 1. Paradoxically speaking, if we pour a nanofluid in a perfect dispersion into a NP solution with agglomeration, the dispersion of the NPs may be improved in the mixture. The interparticle potentials between nanoparticles are improved and are better balanced, thus the dispersity of the NPs may become better.
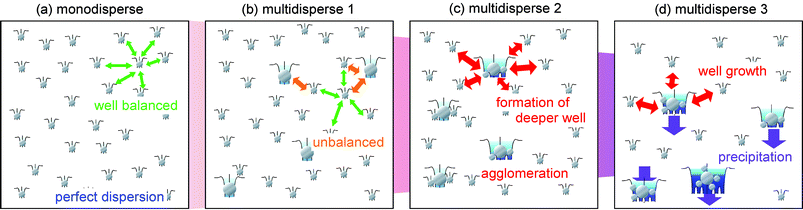 | ||
| Scheme 1 Schematic description of the dispersion mechanism of a solution containing fully surface stabilized NPs, i.e., without surface electrostatic potential. Every NP has its own potential depending on its size. When the solution is filled with monodispersed NPs, as shown in (a), the potential balance in the solution may be sufficient to maintain perfect dispersion for a long time. On the other hand, when the solution is unbalanced by the addition of several large-sized NPs, as shown in (b), the system immediately loses the potential balance and shows agglomeration. Larger NPs have a deeper potential well than smaller NPs; therefore, larger NPs can absorb the other NPs in their vicinity, as shown in (c). Once the agglomerates are formed in the solution, the potential well of the agglomerates increases with the size of agglomerates. Finally, when the large agglomerates become too heavy to disperse in the solution, precipitation occurs, as shown in (d). | ||
In fact, we found an interesting and important phenomenon for understanding of the dispersion of surface-modified NPs in solvents. When we mixed equal portions of perfectly (transparently) dispersed CeO2 NP solution in cyclohexane with CeO2 NP solution in cyclohexane with white turbidity, the turbidity was cleared and the mixture showed stable dispersion. The concentration of the not well-dispersed CeO2 NPs was higher than the solubility limit for a perfect dispersion of these NPs. This means that the balance of interparticle potentials varied from unbalanced to balanced, causing the solution to show better dispersion. This finding indicates that the size distribution may be a key issue when preparing high-NP-concentration nanofluids.11
The hybrid CeO2 nanoparticles (HNPs) used in this study were synthesized by the supercritical hydrothermal method8 and purified by the poor solvent precipitation method.9 The purified HNPs were stored and handled inside an oxygen- and moisture-free glove box. The HNPs were characterized by Fourier transfer infrared spectrometry (FTIR, Jasco FT/IR 680 plus), thermogravimetry (TG, Rigaku TG8120), X-ray diffraction (XRD, Rigaku, Ultima IV), and transmission electron microscopy (TEM, Hitachi H-7650). Fig. 1(a) and (b) depict the TEM image of the decanoic-acid-modified CeO2 (decHNP) and dodecanoic-acid-modified CeO2 (dodHNP) NPs synthesized and used in this study, respectively. The HNPs had an accurately controlled cubic shape. The size distributions calculated from these images using the image analysis software program (SigmaScan Pro4, Jandel Sceintific) are shown as histograms in Fig. 1(c). Apparently, decHNPs had a narrower size distribution than dodHNPs. The densities of the decanoic and dodecanoic acid layers on the HNPs were calculated from the TG weight loss by assuming that the core of the NP has a cubic shape. The lengths of edges of the decHNPs and the dodHNPs were calculated from the averaged lattice length of the NPs, as determined by TEM measurement and were 6.5 nm and 9.7 nm, respectively. The calculated densities were 4.85 chains nm−2 and 5.26 chains nm−2, respectively. These densities were large enough for regarding decanoic and dodecanoic acid layers on the HNPs as a fatty acid SAMs in the quasi-crystalline state.9,19 The dispersibility of the HNPs in cyclohexane was measured using an ultraviolet–visible spectrometer (UV–VIS, Jasco, V-570), dynamic light scattering (DLS, Malvern Zetasizer Nano ZS) and our own eyes (by taking photographs with a Canon digital camera Powershot G2).
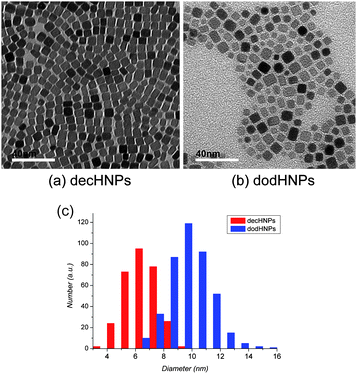 | ||
| Fig. 1 TEM images of (a) decHNPs (b) dodHNPs and (c) size distribution histogram of HNPs. | ||
The decHNPs showed very good dispersity in cyclohexane, even up to 20 wt% and possibly more at room temperature (see the ESI†). However, the dodHNPs showed much poorer dispersity than the decHNPs. Slightly less than 0.3 wt% of the dodHNPs could perfectly disperse in cyclohexane at room temperature. As mentioned above, the dispersion of a colloidal solution has been interpreted through the DLVO theory.16 According to the theory,17,18 the interparticle potential between two colloidal particles that have SAMs in the quasi-crystalline state on the surface, Vt, can be expressed by the sum of the van der Waals' attractive force, VvW, the elastic repulsion, VElas and the osmotic repulsion, VOsm.12 Both types of HNP used in this study have SAMs in the quasi-crystalline state on their surfaces, making it unnecessary to count on electrostatic repulsion, i.e., VR = 0. Actually, we measured the zeta potential of the decHNPs in cyclohexane and it turned out to be 0 (see supporting information). In addition, elastic repulsion has a smaller contribution than the other forces15 so that here we approximately regard it as 0. As a result, the total interparticle potential can be represented as Vt = VvW + VOsm. Here, we could say that Vt is determined by the size of HNPs and the chain-length of surface modifier. (Some examples of calculated Vt(r) values are shown in the ESI†).
The material and the composition of the core materials of both HNPs were identical, and the material and the structure of the shells (the surface-modifier layer) could almost be regarded as identical. Thus, we suggest the major differences between the decHNPs and the dodHNPs were the average size and the size distribution. Even if we hardly regarded the modifier layers as identical, the alkyl chain length of the modifier for the dodHNPs was longer than that for the decHNPs. This meant that the modifier of the dodNHPs was more advantageous than that of the decHNPs. The slightly longer alkyl chain of the dodHNPs could derive a longer interparticle distance i.e., the repulsive force between the dodHNPs could work from a farther distance than the decHNPs. In addition, the higher graft density of the dodHNPs than that of the decHNPs could be advantageous in showing stronger osmotic repulsion between the two modifier layers. Considering the contribution of Brownian motion, we could understand the HNPs would have high dispersity in cyclohexane because the depths of the potential wells are smaller than the threshold energy, −3/2kBT. According to the analysis of the potential curves (see the ESI), it can be suggested that the core size seriously affected the dispersity of the HNPs because the larger core had a stronger attractive force due to its longer separation distance. This is a reasonable explanation for the poor dispersibility of dodHNPs, despite the advantages raised from the denser and longer surface modifier of the dodHNPs. In other words, the balance between the chain-length of the modifier and the core size is the dominant factor which determine dispersity of the HNPs in the case where HNPs have a SAM of the modifier in the quasi-crystalline state on the surface. In the following sections, we tried to investigate in detail the reason why the decHNPs showed better dispersity than the dodHNPs and what is the dominant factor that determines the dispersion of HNPs in solution.
We mixed the dodHNP solution (showing precipitation) into a highly concentrated but transparent decHNP solution and observed whether the mixture still showed precipitation or not. After equal portions of the 2 wt% dodHNP solution and the 5 wt% decHNP solution were blended, the mixture was examined visually and measured using DLS and UV–VIS.
Surprisingly, the mixture showed much less turbidity than the 1 wt% dodHNP solution. The image shown in Fig. 2 clearly indicates that the mixture was more transparent than the 1 wt% dodHNP solution. The DLS result also indicates the size of dispersant in the mixture was smaller than that in the 1 wt% dodHNP solution. In addition, as shown in Fig. 3, time-dependent changes of the UV–VIS absorption spectra of these solutions could also suggest that the dispersion of the HNPs in the mixture was more stable than that in the 1 wt% dodHNP solution. This is very important data because if the core size of the HNPs determine the dispersibility of the solution, the mixture should have showed unstable dispersibility. The mixture included the same partial concentration of large-core-sized dodHNPs, i.e., dodHNPs that had size larger than 10 nm, as the 1 wt% dodHNP solution.
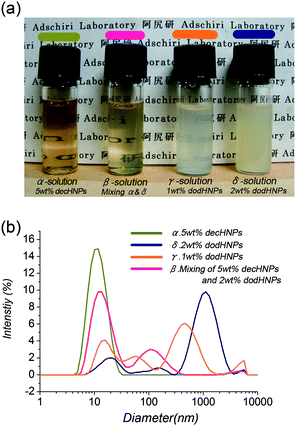 | ||
| Fig. 2 Images (a) and DLS results (b) of HNPs in cyclohexane. All imaging and DLS measurements were completed within 15 min of sample solution preparation. | ||
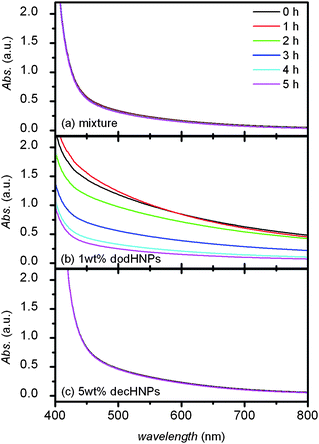 | ||
| Fig. 3 UV–VIS transmittance spectra of the mixture of decHNPs and dodHNPs in cyclohexane (a), 1 wt% of the dodHNPs in cyclohexane (b) and 5 wt% of the decHNPs in cyclohexane (c). | ||
The explanation of the enhanced dispersion in the mixture is somewhat difficult. The average core size of HNPs would affect the dispersity of the HNPs to some extent; however, it would not be a major contribution as mentioned above. We suggest that the main determining factor in the dispersion of the HNPs would be the balance of the individual potentials distributed in the solution. In the case of a molecular solution, the potential between each solute molecule should be identical because all the solute molecules have identical structure and components, except for the number of isotopes the solute molecules have. Even though the solute molecule includes many isotopes, the intermolecular potentials are not very different compared with those in the NP solutions. In contrast, the interparticle potentials for a normal NP solution should be different, depending on the size of each concerned NP pair. This could strongly influence the van der Waals potential and the dispersibility of the NPs in solvents.
In advance of discussing the size and size distribution of the HNP solution, we examined the surfactant effect on the dispersion of the HNP solution. In our case, the ligand exhange between dodHNPs and decHNPs may enhance the dispersion of HNPs. The partial exchange of the modifier from dodecanoic acid to decanoic acid forms a jagged surface which may increase the interaction with solvent molecules by capturing the solvent molecules in the jagged gaps. These two effects should be examined. In order to confirm the influence of both the addition of surfactants and the jagged surface of HNPs, we added dodecanoic and decanoic acids to dodHNP cyclohexane solutions to see whether the dispersion of the mixture improved or not.
The concentrations of decanoic acid added to the 1 wt% dodHNP solution were determined to be 0.1, 0.2, 0.5, 1, 2, 5, 10, 25, 40 mM and the concentrations of dodecanoic acid added to the 1 wt% dodHNP solution were determined to be 0.1, 0.2 and 0.5 mM. The total amount of dodecanoic acid included in the 1 wt% dodHNP solution in cyclohexane was calculated as 4.23 mM and that of decanoic acid included in the 2.5 wt% decHNP solution in cyclohexane was calculated as 15.7 mM. We set the concentration of additional decanoic acids to be lower than the total decanoic acid concentration of the mixture.
For addition of decanoic acid to the 1 wt% dodHNP solution, the dispersion enhancing effect of the surfactant was observed in the decanoic acid concentration range of 1 to 10 mM, however, the dispersion was not drastically improved by adding 0.1 to 0.5 mM of decanoic acid as shown in Fig. 4. It can also be seen in Fig. 4 that the dispersion became worse again after 25 mM. The solvent used in this study was cyclohexane, therefore, the equilibrium between the chemisorption and desorption of dodecanoic acid must side towards chemisorption. This presumption was supported by the 1H NMR spectra of the decHNPs in several solvents.9 If the decanoic acids were desorbed from the surface in large amounts, the sharp peaks corresponding to decanoic acids should appear in the solution-state NMR spectra, but the solution-state 1H NMR spectrum of the decHNPs in C6D12 did not show such peaks. In the NMR spectra of the docHNPs in d4-methanol and d6-acetone, a much more polar solvent than cyclohexane, (and a better solvent for CeO2 than cyclohexane) sharp peaks due to desorbed decanoic acids were observed with negligible intensities. The equilibrium concentration of desorbed decanoic acid from the decHNPs in the 5 wt% decHNP cyclohexane solution was much lower than 0.14 mM (see the ESI†). Therefore it is convincing that the equilibrium concentration of the desorbed decanoic acid in the decHNP cyclohexane solution is too low to induce a surfactant effect. However the possibility of ligand exhange between dodecanoic acid and decanoic acid in the dodHNP solution is not ruled out by the NMR result.
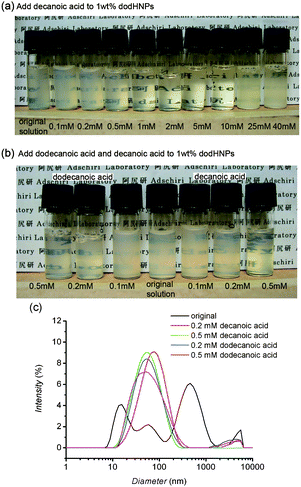 | ||
| Fig. 4 Images (a), (b) and DLS results (c) of dodHNPs in cyclohexane. All the images and DLS were taken within 15 min of sample solution preparation. Decanoic acid was added to the 1 wt% dodHNP cyclohexane solution (0.8 ml) until the concentration of decanoic acid became 0.1, 0.2, 0.5, 1, 2, 5, 10, 25 and 40 mM. Dodecanoic acid also was added to the 1 wt% dodHNP cyclohexane solution (0.8 ml) until the concentration became 0.1, 0.2 and 0.5 mM. | ||
Comparison of dispersity between the dodHNP solutions with the same concentration of decanoic and dodecanoic acids revealed that the dispersion in the dodHNP solutions with 0.1 to 0.5 mM of dodecanoic acid was similar to that of the dodHNP solution with 0.1 to 0.5 mM of decanoic acid. These facts indicate the partial exchanging of the modifier from dodecanoic acid to decanoic acid forming a jagged surface is not advantageous for dispersion of HNPs. The reason why the mixture showed better dispersion than the 1 wt% dodHNP solution cannot be explained by the surfactant effect or the ligand exchanging effect. Here, we propose that the size and size distribution of HNPs would determine the dispersion of HNPs in such a nonpolar solvent.
Before the mixing, the size standard deviations of the HNPs were 1.11 for the decHNPs and 1.45 for the dodHNPs, respectively. After mixing of the two solutions, the size standard deviation of the HNPs dissolved in the solution was calculated to be 1.54. This is larger than that of the dodHNPs and that of the decHNPs, however, when we compare the size distribution according to the Gaussian distribution i.e., the peak width, w, of HNPs, the peak width of HNPs mixture shows a smaller value, wmix = 2.57, than that of the dodHNPs, wdod = 2.78. The result of Gaussian distribution fitting is shown in Fig. 5 and the detail of the calculation is shown in the ESI.
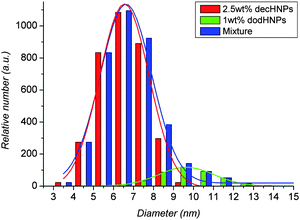 | ||
| Fig. 5 The size distributions (filled blocks) and Gaussian fitting results (lines) of the mixture of decHNPs and dodHNPs in cyclohexane (blue), 1 wt% of the dodHNPs in cyclohexane (green) 2.5 wt% of the decHNPs in cyclohexane (red). | ||
As we already discussed previously, the core size must be an important factor for dispersion of the HNPs. Combining the core size, i.e., the median of the Gaussian distribution, with the size distribution of the cores, i.e., the width of the Gaussian distribution, the better dispersion of the HNPs in the mixture can be explained. The width of the Gaussian distribution directly reflects the extent of the size distribution of the majority in the system, on the other hand, the standard deviation reflects the extent of the total size distribution of the system; thus, the width of the Gaussian distribution would be a better measure for the potential balance of the HNP dispersed system. Actually, the mixture had almost equal median, μmix, 6.62, to that of decHNPs, 6.54, and also had a narrow and similar peak width, 2.57, to that of decHNPs, 2.48. The dodHNPs had a very different value, μdod = 9.63 and wdod = 2.78. This suggestion is consistent with the time-dependent changes of the UV–VIS spectra. Because the size and the size distribution of the HNPs in the mixture were well balanced, the potential distribution would be suited to disperse most of HNPs stably. The potential balance between the HNPs in the solution would determine both the size of the dispersant (cluster size of HNPs) in the solution and the relaxation time needed to reach dispersion equilibrium for the HNP solution system. Computer simulation may help the understanding of these phenomena, and must be a future target of this study.
In conclusion, we investigated the size and the size distribution dependent dispersion of HNPs in cyclohexane. It turned out that the Gaussian median and half-width might be dominant factors in controlling the dispersion of the HNPs. This would mean the total potential balance between the HNPs in the solution strongly affects both the size of the dispersed clusters and the relaxation time required to reach dispersion equilibrium for the HNP solution. If solutions in the perfect dispersion of the HNPs are unbalanced, relaxation towards aggregation immediately occurs, and the perfect dispersion collapses. In other words, if a perfectly dispersed HNP solution is added to a not-well-dispersed HNP solution, the dispersion of the HNPs may be improved as we saw in this study. It is just like distributing the agglomerated clusters of the HNPs and extracting the possible well-dispersed HNPs.
Acknowledgements
This study was supported by a Scientific Research Grant from the Ministry of Education, Science, Sports, and Culture of Japan. This study was also partly supported by the New Energy and Industrial Technology Development Organization Japan (NEDO). The author (T. Arita) thanks Grant-in-Aid for Young Scientists (B) No. 19750094 for their financial support.References
- C. B. Murray, C. R. Kagan and M. G. Bawendi, Annu. Rev. Mater. Sci., 2000, 30, 545–610 CrossRef CAS.
- M. E. Mackay, A. Tuteja, P. M. Duxbury, C. J. Hawker, B. Van Horn, Z. Guan, G. Chen and R. S. Krishnan, Science, 2006, 311, 1740–1743 CrossRef CAS.
- W. R. Caseri, Mater. Sci. Technol., 2006, 22, 807–817 CrossRef CAS.
- E. Bourgeat-Lami, J. Nanosci. Nanotechnol., 2002, 2, 1–24 CrossRef CAS.
- A. R. Studart, E. Amstad and L. J. Gauckler, Langmuir, 2007, 23, 1081–1090 CrossRef CAS.
- T. Adschiri, Chem. Lett., 2007, 36, 1188–1193 CrossRef CAS.
- K. Kaneko, K. Inoke, B. Freitag, A. B. Hungria, P. A. Midgley, T. W. Hansen, J. Zhang, S. Ohara and T. Adschiri, Nano Lett., 2007, 7, 421–425 CrossRef CAS.
- J. Zhang, S. Ohara, M. Umetsu, T. Naka, Y. Hatakeyama and T. Adschiri, Adv. Mater., 2007, 19, 203–206 CrossRef CAS.
- T. Arita, J. Yoo and T. Adschiri, J. Nanopart. Res., 2009 DOI:10.1007/s11051-009-9826-4.
- T. Arita, Y. Ueda, K. Minami, T. Naka and T. Adschiri, Ind. Eng. Chem. Res., 2010, 49, 1947–1952 CrossRef CAS.
- S. K. Das, S. U. S. Choi, W. Yu and T. Pradeep, Nanofluids Science and Technology, John Wiley & Sons Inc., 2008 Search PubMed.
- B. Vincent, J. Edwards, S. Emmett and A. Jones, Colloids Surf., 1986, 18, 261–281 CrossRef CAS.
- F. T. Hesselink, A. Vrij and J. T. G. Overbeek, J. Phys. Chem., 1971, 75, 2094–2103 CrossRef CAS.
- D. H. Napper, J. Colloid Interface Sci., 1977, 58, 390–407 CrossRef CAS.
- P. S. Shah, J. D. Holmes, K. P. Johnston and B. A. Korgel, J. Phys. Chem. B, 2002, 106, 2545–2551 CrossRef CAS.
- J. Lyklema, H. P. van Leeuwen and M. Minor, Adv. Colloid Interface Sci., 1999, 83, 33–69 CrossRef CAS.
- E. J. W. Venvey and J. T. G. Overbeek, Theory of the Stability of Lyophobic Colloids, Elsevier, 1948 Search PubMed.
- B. V. Derjaguin and E. M. Landau, Acta Physicochim., 1941, 14, 633 Search PubMed.
- H. Heinz, R. A. Vaia and B. L. Farmer, Langmuir, 2008, 24, 3727–3733 CrossRef CAS.
Footnote |
| † Electronic supplementary information (ESI) available: Experimental details, characterization of HNPs, NMR and UV–VIS spectra. See DOI: 10.1039/b9nr00395a |
| This journal is © The Royal Society of Chemistry 2010 |