Measuring the lengthening kinetics of aligned nanostructures by spatiotemporal correlation of height and orientation
Eric R.
Meshot†
a,
Mostafa
Bedewy†
a,
Kevin M.
Lyons
a,
Arthur R.
Woll
b,
K. Anne
Juggernauth
ac,
Sameh
Tawfick
a and
A. John
Hart
*a
aDepartment of Mechanical Engineering, University of Michigan, 2350 Hayward Street, Ann Arbor, MI 48109, USA. E-mail: ajohnh@umich.edu; Tel: + 734.615.6146
bCornell High Energy Synchrotron Source, Cornell University, Wilson Lab, Route 366 & Pine Tree Road, Ithaca, NY 14853, USA
cMacromolecular Science and Engineering Research Center, University of Michigan, 2300 Hayward Street, Ann Arbor, MI 48109, USA
First published on 29th March 2010
Abstract
Owing to their inherent tortuosity, the collective height of vertically aligned nanostructures does not equal the average length of the individual constituent nanostructures, and therefore temporal height measurement is not an accurate measure of the genuine growth kinetics. We use high-resolution spatial mapping of alignment by small-angle X-ray scattering (SAXS) to transform real-time measurements of array height to the average length of the nanostructures. Applying this approach to carbon nanotube (CNT) forest growth transforms the kinetics from a sub-linear to a linear relationship with time, highlighting the potential for insights into the limiting growth mechanisms of CNTs and other one-dimensional nanostructures.
Accurate measurement and interpretation of the growth kinetics of one-dimensional nanostructures are crucial for characterizing their formation and for engineering structure–property relationships. Arrays of vertically aligned nanostructures such as tubes, wires, fibers, as well as fibrillar biomolecules, are commonly observed to exhibit tortuous morphologies that vary depending on the stiffness of their areal density and their individual constituent structures.1,2 Therefore, quantifying growth kinetics using array height can be inaccurate and does not represent the true lengthening kinetics of the structures. As a result, to accurately develop a fundamental understanding of the growth kinetics of high-aspect ratio nanostructures, evolution of alignment should be considered along with direct measurements of the collective height of the nanostructures.
Carbon nanotubes (CNTs) are selected herein as an ideal example because understanding the limiting mechanisms of CNT synthesis by chemical vapor deposition (CVD) requires detailed studies of the reaction kinetics. In studies of vertically aligned CNT (forest) growth kinetics, the reaction rate is conventionally inferred from the rate of increase of the forest height, and thus many studies have proposed kinetic models based on in situ and ex situ measurements.3–7 Further, CNT forests are of practical interest for use in high-performance thermal, electrical, mechanical, and fluidic interfaces.8–14 If we understand what governs the structural characteristics, growth rate, and terminal height of CNT forests, we can gain insight into the limiting reaction mechanisms of both individual CNTs and CNT populations; this will enable more efficient production of CNTs for many emerging applications.
Importantly, previous studies assume that the measurements of CNT forest height directly represent the kinetics of CNT formation, and thus they imply that the forest height corresponds to the CNT length. However, despite their preferentially vertical orientation, it is widely known that the CNTs within a forest are packed at a relatively low density, and that the CNTs exhibit tortuosity, which depends on the areal density of CNTs, the CNT diameter, the reaction conditions, and other factors. This tortuosity has previously been observed by electron microscopy15–18 and has been quantified by polarized Raman spectroscopy,19neutron scattering,20 and X-ray scattering.21,22 Because CNTs are sinuous even within well-aligned forests, the CNTs are longer than what is inferred from the forest height. Further, the tortuosity (alignment) of CNTs typically varies within a forest,20–22 and this variation is especially pronounced at the bottom of the forest when growth self-terminates abruptly16 due to a decay of the CNT number density.17
In this study, we uniquely measure the kinetics of CNT lengthening within a forest, by quantitatively combining in situ forest height measurements with ex situ spatial mapping of CNT alignment by small-angle X-ray scattering (SAXS). Novel use of capillary optics with SAXS enables high-resolution measurement of CNT tortuosity along the height of a forest. Finally, we apply this information to transform the measurement of CNT forest height to the average CNT length, revealing in this case that CNT length is linear with time rather than sub-linear as indicated by the height measurement alone. This example highlights the potential of our measurement technique to improve the understanding of the growth and termination mechanisms of one-dimensional nanostructures.
Forests of multi-wall CNTs with a mean outer diameter of 8.4 nm are synthesized in a desktop apparatus (SabreTube, Absolute Nano) by a decoupled chemical vapor deposition (CVD) method.23 In this method, thermal treatment of the precursor and heating of the catalyst are independently controlled at temperatures Tp and Ts, respectively. CNTs are grown on 5 × 5 mm2 (100) silicon substrates, which are cut from 100 mm diameter wafers. The wafers are first coated with ≈100 nm of thermally-grown SiO2, and then a supported catalyst film of 1/10 nm Fe/Al2O3 is deposited by electron beam evaporation.24 The catalyst substrate is annealed in a reducing environment (H2/He) to form nanoparticles at a temperature equal to the growth temperature (Ts = 750 °C), and the hydrocarbon precursors are typical products of thermal decomposition and rearrangement of a C2H4/H2 mixture.23,25 Forest heights are measured in real-time by optical triangulation using a laser displacement sensor (LK-G152, Keyence), which is conveniently mounted outside the growth chamber.16 We record data at a sampling rate of 2 Hz, which enables monitoring of rapid changes in the forest growth rate. Other methods of measuring CNT forest height in situ include optical imaging,26,27 optical interference,28 single-slit laser diffractography,29 time-resolved reflectivity,3 and pulsing of the gas atmosphere to create witness marks.30,31Raman spectroscopy32,33 has also been implemented in situ to observe growth kinetics, providing measurements of mass of CNTs formed versus time by integrating the surface area of the G band, but this method offers little insight into the lengthening rates of CNTs.
X-ray scattering is carried out at the G1 station at the Cornell High Energy Synchrotron Source (CHESS), and a beam energy of 10 ± 0.1 keV is selected with synthetic multilayer optics (W/B4C, 27.1 Å d-spacing). A single-bounce monocapillary, fabricated at CHESS, is used to focus the beam down to ≈40 μm in diameter as it passes through the CNT sample, as shown in Fig. 1a, which is placed on a motorized stage at the focal length of the optics. Only a small portion, 0.1 × 0.2 mm2, of the capillary is illuminated in order to limit the divergence at the sample position to approximately 1 mrad.34
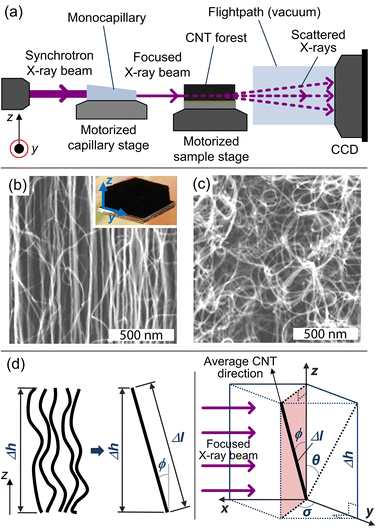 | ||
| Fig. 1 (a) Schematic drawing of the X-ray scattering setup used for this study. Here, the source beam passes through a monocapillary, which focuses the X-rays to a ≈40-μm spotsize beam as it scatters/transmits through the CNT sample to the CCD detector for data collection. SEM images at the (b) midline and (c) base of a CNT forest grown at Ts/Tp = 750/1000 °C (inset shows optical image of forest). (d) Schematic of a representative volume element in the X-ray beam path. | ||
As in our previous work, we quantify the CNT alignment within a forest using the orientation parameter (f), which was originally developed by Hermans for measuring polymer chain alignment.35 This parameter quantifies the average orientation of the ensemble of individual CNTs within the X-ray beam path, in relation to a reference direction (z-axis). Hence, f is a measure for the mean square cosine of the angle between the CNT direction and the reference direction (ϕ),
 | (1) |
Mapping the orientation parameter from the top to the bottom of a CNT forest provides quantitative understanding about the evolution of CNT alignment during growth, and in this study, we use this data to relate the forest height to the real CNT length based on a local measure of the average tortuosity of the CNTs. Scanning electron microscope (SEM) images of a representative forest (Fig. 1b and c) demonstrate the variation in alignment that is observed between the upper and lower portions, respectively, with the morphology generally tending to randomly oriented configurations toward the base (end of growth). As indicated in Fig. 1d, we consider that the CNTs within a differential volume of the forest can be assigned an average direction, which is skewed from the vertical axis by ϕ. Thus, the average true length (Δl) is calculated knowing the measured differential height (Δh) and the average angle of alignment (ϕ), which is calculated from the integration of the corresponding intensity distribution I(ϕ) of the X-ray scattering data about the beam's axis: 21,22,36
 | (2) |
It is important to note that this framework assumes the CNT forest is isotropic in the horizontal plane, which is accurate due to the large number of CNTs within the beampath. Thus, all values of the angle σ are equally probable, (i.e. 〈cos2σ〉 = 1/2) when the X-ray beam is parallel to the horizontal plane.
Now, the average CNT length within the same differential volume can be calculated from the height and orientation measurements. From here on, we distinguish the measured CNT height from the calculated CNT length simply by the terms height and length, respectively. From Fig. 1d, the length and height are thus related by the direction cosine of the average CNT direction with respect to the z-axis:
 | (3) |
In order to directly correlate this transformation with the conventional orientation parameter, we can also express the direction cosine, or secant, in terms of f:
 | (4) |
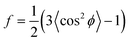
The variation of Λ with orientation is plotted in Fig. 2 and quantifies the conversion from differential height to length, as related to the value of f. As shown, f = 1 represents perfectly vertical and parallel alignment, where the height is equal to the length (Λ = 1). Similarly, Λ → ∞ as f → −1/2, corresponding to CNTs with a perfectly horizontal configuration. On the other hand, f = 0 represents isotropic scattering from CNTs that have no preferential orientation, giving Λ = 1.73. Importantly, for the case of randomly oriented CNTs, the average planar angle of alignment (θ) equals π/4, (i.e. 〈cos2θ〉 = 1/2), which from the geometry (Fig. 1d) corresponds to 〈cos2θ〉 = 1/3. Representative SAXS images in Fig. 2 show the intensity patterns for relatively unaligned (f = 0) and aligned (f = 0.55) configurations.
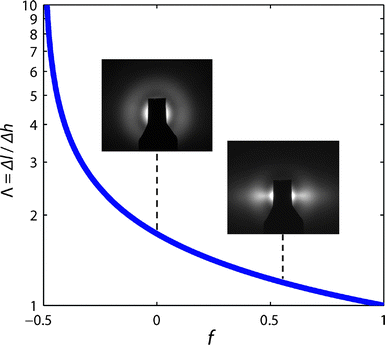 | ||
| Fig. 2 Variation of Λ (eqn (4)) as function of the orientation parameter f. Inset SAXS images show representative scattering patterns for typical unaligned and aligned CNT morphologies within a forest (i.e. f = 0 and f = 0.55). | ||
Fig. 3 plots the calculated value of f for a forest grown at Ts/Tp = 750/1000 °C. We observe a slight increase in f over the first ≈100 μm resulting from self-organization of the CNTs (stage I). After this initial transient, we observe an approximately constant f regime (stage II) correlating with a period of steady height increase shown in Fig. 4, followed by a transition as f decays (stage III) to zero at growth termination (stage IV). Even though the topmost ∼10 μm of the forest consists of a randomly oriented crust of CNTs that represent the self-organization of the forest,17,37 this feature is blurred by the beam (≈40 μm diameter), so the first data point overestimates the alignment at the top of the forest. The nonmonotonic decay of f after the steady regime indicates collective morphological changes as the forest alignment degrades. These are corroborated by previous observations of tilting27 and cracking26 of the forest as termination approaches. Fig. 3 also shows how Λ evolves throughout growth. Toward the end of growth, when the CNTs are very tortuous, differential height measurements underestimate the differential CNT length by as much as a factor of 1.9.
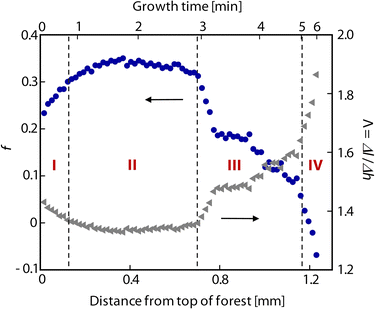 | ||
| Fig. 3 Plot of f (solid blue circles) and Λ (solid gray triangles) versus both forest height and growth time for a typical forest grown in C2H4/H2 at Ts/Tp = 750/1000 °C. Growth stages I–IV (as described in the text) are labeled on the plot in red. Note that growth time scales nonlinearly with forest height. | ||
![Corrected CNT lengthening kinetics as computed from in situ measurement of forest height for sample grown at Ts/Tp = 750/1000 °C. Curve fitting demonstrates the transformation from a nonlinear to a linear characteristic. A linear, rate-limited kinetics model best fits the length kinetics, while quadratic decay ()7 and exponential decay [h(t) = βτ0(1 − e−t/τ0)]5 best describe the steady growth regime of our height kinetics.](/image/article/2010/NR/b9nr00343f/b9nr00343f-f4.gif) | ||
Fig. 4 Corrected CNT lengthening kinetics as computed from in situ measurement of forest height for sample grown at Ts/Tp = 750/1000 °C. Curve fitting demonstrates the transformation from a nonlinear to a linear characteristic. A linear, rate-limited kinetics model best fits the length kinetics, while quadratic decay ( )7 and exponential decay [h(t) = βτ0(1 − e−t/τ0)]5 best describe the steady growth regime of our height kinetics. )7 and exponential decay [h(t) = βτ0(1 − e−t/τ0)]5 best describe the steady growth regime of our height kinetics. | ||
The spatial variation of CNT alignment, as quantified by SAXS, indicates that height maps nonlinearly to CNT length; thus we must employ the function Λ to spatially map height to length. To derive length versus time, we calculate and sum the differential length element Δl along the height of the forest (H), applying Λ to the measured Δh/Δt at each point. This ratio describes the relationship between the beamspot incremental step Δh, and the corresponding differential growth time Δt, which is determined from the in situ height measurements. The resulting summation is
 | (5) |
After applying the transformation, it is apparent that the total CNT length at any particular instant is greater than the forest height, and more importantly that the shape of the length kinetics is distinctly different than the height kinetics (Fig. 4). The transformation is most apparent in stages III and IV, where the alignment decreases with continued growth. Near termination, the tortuosity of the growing CNTs increases while the rate of forest height increase declines, so for the same individual CNT lengthening rate, there is less net displacement of the top of the forest. As a result, the length kinetics curve is linear until self-termination, even after the slope of the height kinetics begins to decrease. Finally, termination of CNT lengthening is more abrupt than that observed by forest height, suggesting the collective termination of CNT growth is of a sudden and catastrophic nature, which contradicts previous growth-rate decay models.
The shape of the kinetic curve confers important information regarding the limiting mechanisms of the growth and termination processes, thus obtaining an accurate shape is vital in order to understand which model is correct. Gradual decay in growth rate based on forest height has, for example, been shown to fit a model of quadratic or exponential decay.5,6,30,31,38,39 These models have described CNT growth as limited either by precursor supply because of diffusion through the forest, or by decaying catalyst efficiency with time. Notably, in our study, the length kinetics is linear, whereas the height kinetics is best described by the nonlinear quadratic/exponential decay curves as shown in Fig. 4.
The transformation in shape also suggests that the ubiquitous sub-linear shapes of forest height kinetics may be inaccurate portrayals of the real lengthening rate of individual CNTs. Specifically, a linear relationship between length and reaction time may indicate that growth is limited by the reaction rate at the catalyst surface,7,39 rather than by diffusion of the precursor to the base of the forest or by decay of catalyst activity. Likewise, it is important to note that models of the CNT growth typically represent an individual CNT, which does not necessarily capture the statistical distribution of CNTs within a forest. To this end, we recently found that CNT number density within a forest decays toward termination,17 and therefore the length kinetics presented here are a measure of the “longest-living” CNTs in the forest. Further, all these models fail to capture the abrupt nature of self-termination, which has been observed in our study and several other studies. 16–18,27,40–43
In the future, it will be vital to investigate the rate of CNT lengthening under different reaction conditions, as well as to combine measurements of CNT length with forest mass. Such a comprehensive approach can seek to truly reveal the population dynamics of CNT growth, and hence determine how the growth rate and lifetime of individual CNTs depend statistically on their diameter, the growth conditions, and other important factors.
Conclusions
In order to truly overcome limiting mechanisms of CNT growth, we must understand how the lifetime of individual CNTs is determined by their particular multidimensional growth characteristics and by their collective interactions. Thus, the proposed technique, which could readily be integrated as an in situ precision measurement system, could also advance the fundamental physics and chemistry of growth of other filamentary structures.Acknowledgements
Financial support was provided by the University of Michigan Department of Mechanical Engineering and College of Engineering, and the National Science Foundation (NSF) Nanomanufacturing Program (CMMI-0800213). K. M. L. received support from the University of Michigan Center for Wireless Integrated MicroSystems (WIMS) which is a NSF Engineering Research Center. Microscopy was performed at the University of Michigan Electron Microbeam Analysis Library (EMAL). X-ray scattering was performed in the G1 beamline at the Cornell High-Energy Synchrotron Source (CHESS), which is supported by the NSF and the National Institutes of Health under Grant No. DMR-0225180. We thank Namiko Yamamoto at MIT for preparation of catalyst substrates.References
- S. S. Fan, M. G. Chapline, N. R. Franklin, T. W. Tombler, A. M. Cassell and H. J. Dai, Science, 1999, 283, 512–514 CrossRef CAS.
- Y. N. Xia, P. D. Yang, Y. G. Sun, Y. Y. Wu, B. Mayers, B. Gates, Y. D. Yin, F. Kim and Y. Q. Yan, Adv. Mater., 2003, 15, 353–389 CrossRef CAS.
- A. Puretzky, D. Geohegan, S. Jesse, I. Ivanov and G. Eres, Appl. Phys. A: Mater. Sci. Process., 2005, 81, 223–240 CrossRef CAS.
- R. F. Wood, S. Pannala, J. C. Wells, A. A. Puretzky and D. B. Geohegan, Phys. Rev. B: Condens. Matter Mater. Phys., 2007, 75, 235446 CrossRef.
- D. Futaba, K. Hata, T. Yamada, K. Mizuno, M. Yumura and S. Iijima, Phys. Rev. Lett., 2005, 95, 056104 CrossRef.
- O. Louchev, T. Laude, Y. Sato and H. Kanda, J. Chem. Phys., 2003, 118, 7622–7634 CrossRef CAS.
- L. Zhu, J. Xu, F. Xiao, H. Jiang, D. Hess and C. Wong, Carbon, 2007, 45, 344–348 CrossRef CAS.
- M. S. Dresselhaus, G. Dresselhaus and P. Avouris, Carbon nanotubes: synthesis, structure, properties, and applications, Springer, Berlin, New York, 2001 Search PubMed.
- R. H. Baughman, A. A. Zakhidov and W. A. de Heer, Science, 2002, 297, 787–792 CrossRef CAS.
- M. Endo, T. Hayashi, Y. Kim, M. Terrones and M. Dresselhaus, Philos. Trans. R. Soc. London, Ser. A, 2004, 362, 2223–2238 CrossRef CAS.
- E. J. Garcia, B. L. Wardle and A. J. Hart, Composites, Part A, 2008, 39, 1065–1070 CrossRef.
- T. Tong, Y. Zhao, L. Delzeit, A. Kashani, M. Meyyappan and A. Majumdar, IEEE Trans. Compon. Packag. Technol., 2007, 30, 92–100 CrossRef CAS.
- J. Holt, H. Park, Y. Wang, M. Stadermann, A. Artyukhin, C. Grigoropoulos, A. Noy and O. Bakajin, Science, 2006, 312, 1034–1037 CrossRef CAS.
- B. Hinds, N. Chopra, T. Rantell, R. Andrews, V. Gavalas and L. Bachas, Science, 2004, 303, 62–65 CrossRef CAS.
- A. Hart and A. Slocum, Nano Lett., 2006, 6, 1254–1260 CrossRef CAS.
- E. R. Meshot and A. J. Hart, Appl. Phys. Lett., 2008, 92, 113107 CrossRef.
- M. Bedewy, E. R. Meshot, H. Guo, E. A. Verploegen, W. Lu and A. J. Hart, J. Phys. Chem. C, 2009, 113, 20576–20582 CrossRef CAS.
- J. Wu, Q. W. Huang, Y. F. Ma, Y. Huang, Z. F. Liu, X. Y. Yang, Y. S. Chen and D. P. Chen, Colloids Surf., A, 2008, 313–314, 13–17 CrossRef.
- C. Pint, Y. Xu, M. Pasquali and R. Hauge, ACS Nano, 2008, 2, 1871–1878 CrossRef CAS.
- H. Wang, Z. Xu and G. Eres, Appl. Phys. Lett., 2006, 88, 213111 CrossRef.
- B. N. Wang, R. D. Bennett, E. Verploegen, A. J. Hart and R. E. Cohen, J. Phys. Chem. C, 2007, 111, 17933–17940 CrossRef CAS.
- B. N. Wang, R. D. Bennett, E. Verploegen, A. J. Hart and R. E. Cohen, J. Phys. Chem. C, 2007, 111, 5859–5865 CrossRef CAS.
- E. R. Meshot, D. L. Plata, S. Tawfick, E. A. Verploegen and A. J. Hart, ACS Nano, 2009, 3, 2477–2486 CrossRef CAS.
- A. Hart and A. Slocum, J. Phys. Chem. B, 2006, 110, 8250–8257 CrossRef CAS.
- D. L. Plata, A. J. Hart, C. M. Reddy and P. M. Gscwend, Environ. Sci. Technol., 2009, 43, 8367–8373 CrossRef CAS.
- A. J. Hart, L. van Laake and A. H. Slocum, Small, 2007, 3, 772–777 CrossRef CAS.
- A. Puretzky, G. Eres, C. Rouleau, I. Ivanov and D. Geohegan, Nanotechnology, 2008, 19, 055605 CrossRef.
- D. Kim, H. Jang, C. Kim, D. Cho, H. Yang, H. Kang, B. Min and H. Lee, Nano Lett., 2003, 3, 863–865 CrossRef CAS.
- L. Dell'Acqua-Bellavitis, J. Ballard, P. Ajayan and R. Siegel, Nano Lett., 2004, 4, 1613–1620 CrossRef CAS.
- S. Patole, J. Park, T. Lee, J. Lee, A. Patole and J. Yoo, Appl. Phys. Lett., 2008, 93, 114101 CrossRef.
- L. Zhu, D. Hess and C. Wong, J. Phys. Chem. B, 2006, 110, 5445–5449 CrossRef CAS.
- M. Picher, E. Anglaret, R. Arenal and V. Jourdain, Nano Lett., 2009, 9, 542–547 CrossRef CAS.
- S. Chiashi, M. Kohno, Y. Takata and S. Maruyama, J. Phys. Conf. Ser., 2007, 59, 155–158 CrossRef CAS.
- J. S. Lamb, S. Cornaby, K. Andresen, L. Kwok, H. Y. Park, X. Qiu, D.-M. Smilgies, D. H. Bilderback and L. Pollack, J. Appl. Crystallogr., 2007, 40, 193–195 CrossRef CAS.
- P. H. Hermans, Contribution to the physics of cellulose fibres; a study in sorption, density, refractive power and orientation, Elsevier Pub. Co., Amsterdam, 1946 Search PubMed.
- L. E. Alexander, X-ray diffraction methods in polymer science, Wiley-Interscience, New York, 1969 Search PubMed.
- L. Zhang, Z. Li, Y. Tan, G. Lolli, N. Sakulchaicharoen, F. Requejo, B. Mun and D. Resasco, Chem. Mater., 2006, 18, 5624–5629 CrossRef CAS.
- E. Einarsson, Y. Murakami, M. Kadowaki and S. Maruyama, Carbon, 2008, 46, 923–930 CrossRef CAS.
- R. Xiang, Z. Yang, Q. Zhang, G. Luo, W. Qian, F. Wei, M. Kadowaki, E. Einarsson and S. Maruyama, J. Phys. Chem. C, 2008, 112, 4892–4896 CrossRef CAS.
- V. Shanov, N. Mallik, W. Chu, W. Li, C. Jayasinghe, Y. Yun, M. J. Schulz, S. Yarmolenko, P. Salunke and G. Li, Advances in Synthesis and Applications of Carbon Nanotube Materials, Materials Science and Technology Conference, Pittsburgh, Pennsylvania, 2008 Search PubMed.
- S. P. Patole, P. S. Alegaonkar, H. C. Lee and J. B. Yoo, Carbon, 2008, 46, 1987–1993 CrossRef CAS.
- M. Stadermann, S. P. Sherlock, J.-B. In, F. Fornasiero, H. G. Park, A. B. Ar thtyukhin, Y. Wang, J. J. De Yoreo, C. P. Grigoropoulos, O. Bakajin, A. A. Chernov and A. Noy, Nano Lett., 2009, 9, 738–744 CrossRef CAS.
- C. Mattevi, C. T. Wirth, S. Hofmann, R. Blume, M. Cantoro, C. Ducati, C. Cepek, A. Knop-Gericke, S. Milne, C. Castellarin-Cudia, S. Dolafi, A. Goldoni, R. Schloegl and J. Robertson, J. Phys. Chem. C, 2008, 112, 12207–12213 CrossRef CAS.
Footnote |
| † Authors contributed equally to this work. |
| This journal is © The Royal Society of Chemistry 2010 |