Nonaqueous sol–gel chemistry applied to atomic layer deposition: tuning of photonic band gap properties of silica opals
Catherine
Marichy
a,
Jean-Francois
Dechézelles
b,
Marc-Georg
Willinger
a,
Nicola
Pinna
*ac,
Serge
Ravaine
b and
Renaud
Vallée
*b
aDepartment of Chemistry, CICECO, University of Aveiro, 3810-193 Aveiro, Portugal. E-mail: pinna@ua.pt
bCentre de Recherche Paul Pascal (UPR 8641, CNRS), 115 avenue du docteur Albert Schweitzer, F-33600 Pessac, France. E-mail: vallee@crpp-bordeaux.cnrs.fr
cWorld Class University (WCU) program of Chemical Convergence for Energy & Environment (C2E2), School of Chemical and Biological Engineering, College of Engineering, Seoul National University (SNU), Seoul 151-744, Korea. E-mail: pinna@snu.ac.kr
First published on 15th March 2010
Abstract
Combining both electromagnetic simulations and experiments, it is shown that the photonic pseudo band gap (PPBG) exhibited by a silica opal can be fully controlled by Atomic Layer Deposition (ALD) of titania into the pores of the silica spheres constituting the opal. Different types of opals were assembled by the Langmuir–Blodgett technique: homogeneous closed packed structures set up of, respectively, 260 and 285 nm silica spheres, as well as opal heterostructures consisting of a monolayer of 430 nm silica spheres embedded within 10 layers of 280 nm silica spheres. For the stepwise infiltration of the opals with titania, titanium isopropoxide and acetic acid were used as metal and oxygen sources, in accordance with a recently published non-aqueous approach to ALD. A shift of the direct PPBG, its disappearance, and the subsequent appearance and shifting of the inverse PPBG are observed as the opal is progressively filled. The close agreement between simulated and experimental results is striking, and promising in terms of predicting the properties of advanced photonic materials. Moreover, this work demonstrates that the ALD process is rather robust and can be applied to the coating of complex nanostructures.
Introduction
The works of John1 and Yablonovitch2 set the ground for the scientific interest in photonic crystal (PC) structures and the study of their optical properties. The development of materials that are characterized by a periodically varying index of refraction enables improved control over the generation and propagation of light. Their unique characteristics, i.e., the formation and directionality of the photonic bandgaps (PBGs), can be manipulated in order to control the amount of losses in optical circuits and spontaneous emission. The engineering of a full PBG requires a periodic and high refractive index contrast in all (3D) spatial directions. PCs based on the infiltration and inversion of direct opals have been shown to be promising structures,3–5 and a full PBG at infrared frequencies has been obtained in silicon inverse opals.6,7 Recently, it was shown that topological tuning, obtained by shifting the distribution and filling fraction of the high-index dielectric material through advanced architectures, such as multilayered inverse opals and non-close-packed (NCP) inverse opals,8–14 can significantly change the photonic band properties.This article reports on the application of atomic layer deposition (ALD) for the highly controlled infiltration of titania in a silica direct opal through the conformal shell-like coating of the interstitial sites in the face-centered cubic arranged silica spheres. ALD has already proven to be the most suitable technique for the deposition of conformal films with submonolayer control, allowing one to reach filling fractions as good as 88% of the pore volume.12–17 The deposition process applied in this work was recently developed and is based on a non-aqueous sol–gel reaction18 between a metal alkoxide and acetic acid as metal and oxygen sources, respectively.19,27 It proved to be rather robust and well suited for the coating of various nanostructured materials, such as carbon nanotubes.20,21 This report further points out the robustness and the wide applicability of this new ALD process. While the complete GaAs ALD infiltration of a Langmuir–Blodgett engineered silica opal was already reported by Povey et al.,22 the combination of the layer by layer Langmuir–Blodgett deposition method for the production of complex photonic crystals (e.g., opals containing defect layers)23–25 with the subsequent and progressive coating of the nanostructure by ALD is reported here for the first time. This allows precise control of the photonic properties of the resulting heterostructure. The shifting of the direct PPBG, its disappearance, the subsequent appearance and shifting of the inverse PPBG that is observed as the direct opal is progressively filled, are perfectly reproduced by electromagnetic simulations. Similar results are obtained for the pass band within the PPBG of a progressively filled heterostructure (i.e., an opal containing an intentional defect layer). This controlled modulation of the PPBG can be used, for example, to tune the range of an optical filter.
Results and discussion
Simulations of the optical properties
Photonic band diagrams of the silica opals progressively filled with titania were simulated as a function of the filling ratio, expressed as the ratio r between the titania coating shell thickness and the silica sphere diameter. The diagrams are shown in Fig. 1 for four particular cases. The direct silica opal (Fig. 1a) exhibits a ΓL PPBG between the second and third bands with a width to position ratio of 5.22%, in agreement with values reported in the literature.12 The progressive filling of the direct opal with titania, in a conformal type of growth, leads to a red shift of the ΓL PPBG, ranging from an adimensional frequency (in c/a, where c is the speed of light and a the lattice parameter) of 0.65 for the direct opal to 0.51 for the infiltrated opal with a ratio r = 13.1% (Fig. 1c). This is in agreement with the Bragg's law adapted to opals: λBragg = 2d111neff = 1.63Dneff, d111 being the reticular distance between successive (111) planes and D the diameter of the spheres. Simultaneously to this red shift, a flattening of the bands is observed. The latter is the result of the increased effective refractive index: . Here, ΦSiO2 = 0.74 and nSiO2 = 1.45, ΦTiO2 and nTiO2 = 2.7 (anatase) or nTiO2 = 2.35 (amorphous), Φair and nair = 1 are the filling fractions and refractive indexes of silica, titania and air, respectively. The filling fractions are constrained to the condition that ΦSiO2 + ΦTiO2 + Φair = 1. The progressive filling of the silica direct opal with anatase induces a narrowing of the ΓL gap width, until the PPBG vanishes at about r = 4.1% (Fig. 1b). This is followed by the appearance of the inverse PPBG, which reaches a width to position ratio of 7.45% at r = 13.1% (Fig. 1c). The monotonic decrease of the adimensional frequency together with the sequence of narrowing - disappearance - reappearance - broadening of the ΓL pseudo-gap as a function of the filling ratio r is best illustrated in Fig. 2. The simulation gives a similar result in the case of amorphous titania, with only slightly different threshold values: the PPBG disappears at r = 5.8% and the inverse photonic pseudo band gap reaches a width to position ratio of 4.9% at r = 13.1% (Fig. 2). The band diagram of the titania (anatase) pure inverse opal was also simulated. In that case, a larger width to position ratio of 14.78% is obtained at the adimensional frequency of 0.608 for a coating thickness to pore diameter ratio of r = 13.1% (Fig. 1d). The opening of the full PBG between the 8th and 9th bands for an inverse opal with an index contrast of 2.7 is clearly visible in the figure.
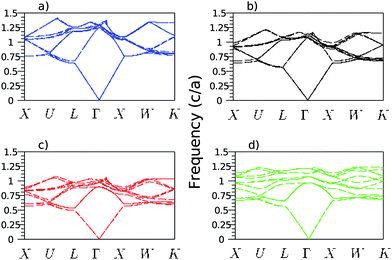 | ||
| Fig. 1 Simulated band structures of the direct silica opal (a), of a titania partially (b) or completely (c) conformally filled silica opal and of a pure titania inverse opal, obtained by conformal growth of titania around the air pores (d). The filling fractions of titania in the anatase phase of these last three structures are r = 4.1%, r = 13.1% and r = 13.1%, respectively. | ||
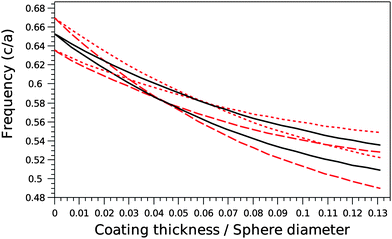 | ||
| Fig. 2 Evolution of the frequency shift (solid lines) and width (vertical interdistance between the dash or dot lines) of the ΓL PPBG as a function of the filling fraction r, expressed as the coating thickness divided by the sphere diameter in the cases of amorphous (solid line between dot lines) and anatase (solid line between dash lines) titania. | ||
Infiltration of the opals
SEM images of the ALD-processed silica opal reveal that the structure is homogeneously infiltrated with titania (Fig. 3a,b). At higher magnification, the titania coating can be distinguished from the silica spheres in regions where the titania film was detached during sample preparation for SEM (Fig. 3b). After dissolution of the silica template, the inverted opal structure is clearly visible (Fig. 3c). The smaller holes at the surface of the hollow spheres are caused by the contact region between silica spheres and are the typical signature of the formation of the inverted opal structure after dissolution of the template. TEM images acquired on fractured samples highlight the good conformality of the titania coating and the high filling ratio of the silica opal (Fig. 3d,e). Regions where the coating is missing due to contact between spheres are indicated by the arrows. The energy filtered TEM image recorded using the Ti L edges further proves the presence of a conformal titania coating (Fig. 3f). TEM images of cross sections cut through the annealed opals before (Fig. 3g,h) and after removal of the silica template (Fig. 3i) denote the good preservation of the opal structure during annealing and removal of the silica template, as well as the induced densification and crystallization in the anatase phase.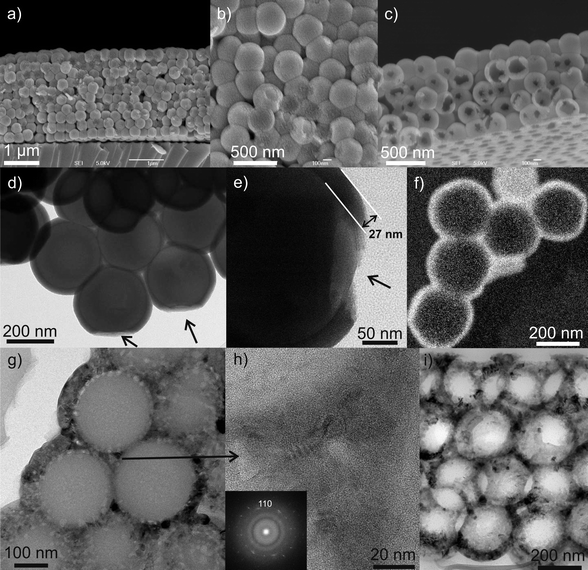 | ||
| Fig. 3 SEM images of the (a,b) 285 nm sphere diameter direct silica opal filled with titania, (c) 260 nm sphere diameter inverse titania opal after removal of the template. (d,e) TEM images of the 285 nm sphere diameter direct silica opal filled with titania (the arrows denote the contact point of the silica spheres during deposition) and (f) energy filtered TEM images at the Ti 2p edge showing the conformality of the titania coating around the silica spheres. TEM images of cross section cuts of the annealed opal (260 nm sphere diameter) before (g,h) and after removal of the silica template (i). Inset: power spectrum of the HRTEM image in (h). | ||
Optical properties
According to Bragg's law, the extinction spectra of the pure silica opal structures studied in this work are expected to have a maximum at λ = 572 nm and λ = 627 nm for sphere diameters of D = 260 nm and D = 285 nm, respectively. This is experimentally reproduced, as shown for the case of 285 nm spheres in Fig. 4. Furthermore, in accordance with the theoretical prediction (also shown in Fig. 4), the increased filling of the pores with titania leads to a shift of the PPBG to longer wavelengths. Simultaneously to this shift, the peak amplitude decreases until it disappears at around 700 nm. Subsequently, the inverse PPBG starts to appear and grows in amplitude, while shifting to longer wavelengths until it reaches λ = 780 nm once the pores are completely filled.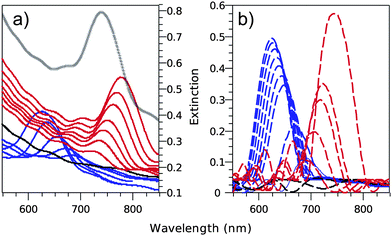 | ||
| Fig. 4 Experimental (a, solid lines) and simulated (b, dash lines) extinction spectra of 285 nm sphere diameter direct silica opal progressively filled with titania by ALD. The blue lines depict the progressive red shift and reduction of the direct opal photonic pseudo-band gap. The black lines depict its disappearance. The red lines depict the progressive red shift and increase of the titania-filled silica inverse opal PPBG. | ||
In agreement with the theoretical calculations, the first step (disappearance of the peak) corresponds to the modification of the band structure of the direct opal in such a way that the refractive index contrast between the constitutive spheres and the surroundings vanishes. In the present system, this happens at a filling fraction r = 6%. In the second step, the index contrast gets reversed as the surrounding pores are further filled with a higher index dielectric material. The band gap of the resulting inverse opal appears and converges once the opal is completely filled. It is important to notice that the increased extinction at wavelengths below the position of the PPBG originates from the increased incoherent diffusion as titania is progressively introduced in the structure.26
Comparison between the theoretical and experimental plots in Fig. 4 reveals two things. Firstly, the good quality of the grown photonic crystals becomes evident from observing the low wavelength range of the extinction spectra. The secondary periodic oscillations, so-called “Fabry–Pérot” fringes, are due to interferences of light propagating among various optical paths back and forth in the structure. They appear in a spectral region where the dispersion relation is linear.28 In this region, the crystal can be assimilated to a homogeneous transparent medium with an effective refractive index. Only good quality crystals, with a homogeneous optical thickness, can exhibit “Fabry–Pérot” fringes. It is important to point out the excellent matching between the spectral positions of the fringes observed on both theoretical and experimental extinction spectra. Secondly, Fig. 4 also reveals that the theoretical spectrum shows a slightly reduced shift in the spectral position of the peaks at maximum filling. This discrepancy is due to the fact that the opal obtained by the Langmuir–Blodgett deposition is not fcc close packed, as simulated here. It is better described as a (2 + 1)D photonic crystal resulting from the stacking in a one-dimensional (1D) lattice of prepacked two-dimensional (2D) colloidal crystals.29 The lack of a strict correlation between successive monolayers induces a greater d111 of the LB films as compared to the equivalent photonic crystal grown by controlled evaporation (fcc).22 Consequently, a higher void volume fraction of the overall structure leads to a significantly increased composite dielectric constant, and so to a larger shift in the Bragg peak after ALD infiltration. Evidence for this is provided by the spectra recorded from the fully filled samples after annealing (Fig. 4a, black curve). It shows a blue shift of the extinction spectrum, which is opposed to what would be expected solely from the transformation of the amorphous titania phase into anatase, where the increased refractive index would lead to a red shift of the PPBG (cf.Fig. 2 for the evolution of the adimensional frequency in the amorphous and anatase cases). This is an indication of the fact that the relaxation/densification of the structure overcompensates for the increase of the refractive index upon annealing, underlining the explanation given above.
In Fig. 5a, the comparison between the extinction spectrum of the annealed sample and the simulated spectra of silica opals conformally filled with anatase is shown. The best matching of the extinction spectra, with a maximum at λ = 740 nm, occurs for a theoretical filling ratio of 9.7%. Such a filling fraction is larger than the theoretical maximum expected from the geometrical arrangement of silica spheres in perfectly close packed (111) planes, for which the filling would end, because of the closing of the structure, at a ratio r = 7.75%.12 The larger filling ratio obtained through compacting of the structure by the annealing process is another indication of the non-fcc close packing of the direct opal.
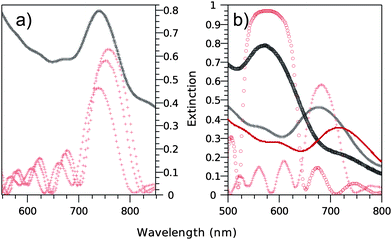 | ||
| Fig. 5 Experimental and simulated extinction spectra of 285 nm (a) or 260 nm (b) sphere diameter direct silica opal fully filled with titania by ALD. (a) The black crosses curve pertains to the extinction spectrum of the opal after annealing. The red crosses curves pertain to the simulated extinction spectra for anatase titania with filling fractions r ranging from 9.7 to 10.2 and 13.1% (from left to right). The best agreement between experiment and theory is found for r = 9.7%. (b) The red solid line (black crosses curve) pertains to the extinction spectrum of the opal prior (after) annealing. The black circles curve pertains to the extinction spectrum of the annealed opal after HF treatment, inducing removal of the silica particles. The red curves pertain to the simulated extinction spectra of anatase titania-filled silica direct opal (crosses) and pure anatase titania inverse opal (circles) with a common filling fraction r = 10.2%, matching the best the corresponding experimental spectra in both cases. | ||
The whole study was repeated on a silica template constituted of spheres with a diameter D = 260 nm. Fig. 5b shows the experimental extinction spectra obtained for the fully filled silica template before and after annealing, as well as the extinction spectra of a pure titania inverse opal. The latter was obtained after removal of the silica spheres by HF treatment (cf. HRTEM image, Fig. 3i). In agreement with above, the extinction spectrum after annealing is blue-shifted. After removal of the silica template, the extinction spectrum is further blue-shifted due to the reduction of the effective refractive index. For comparison, Fig. 5b also presents the theoretical extinction spectra calculated for a conformal coating of the silica opal with anatase and the corresponding inverse opal. In excellent agreement with the results obtained in the case of the larger silica spheres, the best matching is obtained for a theoretical filling ratio of r = 10.2%.
The controlled insertion of a defect causes a rupture in the periodicity of the photonic crystal and induces the appearance of localized states for photons within the gap. Recently, different techniques were developed to introduce a planar defect into 3D PCs.24,30–32 The obtained heterostructures present a dip, also called a pass band, inside the stop band in the transmission spectrum. To the best of our knowledge, neither the progressive titania filling by ALD of the direct template nor the inversion of such a heterostructure have been reported so far. Moreover, the inversion process presents the advantage of increasing the quality factor of the pass band. Accordingly, due to the versatility of the Langmuir–Blodgett technique, allowing control of the deposition layer by layer, a photonic heterostructure made of two stacks of five layers of 280 nm diameter silica host particles surrounding a defect layer constituted by a monolayer of 430 nm diameter silica guest particles was produced. In the next step, the silica template was filled with titania by ALD. Fig. 6 shows the extinction spectra obtained both experimentally (a) and by FDTD simulations (b). The SEM transversal view of the heterostructure is also shown as insets in Fig. 6a and a cut in the yz-plane of the FDTD simulated heterostructure in Fig. 6b. The good ordering of the structure is clearly visible. A slight positional disorder generated in the layer situated on top of the guest particles layer is also observed, as already reported previously.25 The insets of Fig. 6a and b show the main difference between the experimentally engineered and simulated heterostructures: while the defect layer is constituted of host silica particles arranged in a hexagonally packed monolayer in the built opal, it is approximated to a block of the same thickness but with an effective refractive index material (n = 1.35) in the simulations. Although such an approximation was very successful in modeling the direct heterostructures,25 this is not the case for the filled opal. Indeed, on the experimental side, the conformal growth will take place everywhere, including around the host particles, while in the simulated case this conformal growth is effective only around the guest particles, as exemplified in the inset of Fig. 6b. Such a difference will have an impact on the optical properties of the system. As predicted by theory and simulations, the introduction of a defect layer introduces a pass band in the PPBG of the direct opal. This pass band manifests as a dip at 612 nm, as seen in the extinction spectra (Fig. 6b). The progressive titania ALD filling of the direct template induces a red shift of the PPBG together with its pass band (blue lines), followed by its disappearance (black line), and the reappearance and red shift of the PPBG together with its pass band (red lines) in the inverse opal geometry. Note here the monotonous red shift of the pass band as a function of filling. Fig. 6a shows a similar tendency but with slight variations: while the pass band and high wavelength edge of the PPBG shifts to the red (blue lines) as a function of filling before the disappearance of the pass band (black line), the low wavelength edge of the PPBG did not significantly move. In contrast to what happens in the simulations, further filling induces a blue-shifted reappearance of the pass band within the PPBG in the inverse geometry (red lines) prior to progressively shifting more to the red as the filling fraction further increases. In the inverse geometry, both low and high wavelength edges of the PPBG move together with the pass band. As a whole, the main differences between simulations and experiments are a reduced and non-monotonous red shift of the pass band as a function of the filling fraction, together with a non-complete disappearance of the PPBG (e.g. the low wavelength edge persists, cf. black line) in the experimental extinction spectra. We tentatively attribute these discrepancies to the approximation made in order to simulate the defect layer. The increased intensity observed in the blue region of the experimental spectra is due to diffusion by unintentional defects introduced in the structure (inset of Fig. 6a), which are not taken into account in the simulations. In the next step, the experimental results presented here will be compared to new types of simulations combining molecular dynamics and FDTD taking more precisely into account the actual composition of the defect layer and the (2 + 1)D instead of the fcc structure of LB-obtained colloidal crystals. Furthermore, an experimental architecture consisting in a block defect layer instead of the hexagonally packed monolayer of host particles will also be produced and compared to the herein presented calculations.
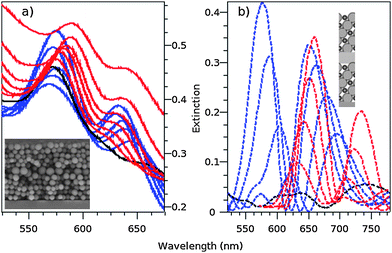 | ||
| Fig. 6 Experimental (a) and simulated (b) extinction spectra of a heterostructure constituted by a defect layer of 430 nm diameter guest silica particles comprised between two stacks of five layers of host silica particles of 280 nm diameter progressively filled with titania by ALD. The blue lines depict the progressive red shift and reduction of the direct opal photonic pass band. The black lines depict its disappearance. The red lines depict the progressive red shift and increasing of the titania filled silica inverse opal pass band. The insets show a SEM transversal view (a) and a cut in the yz-plane (b) of the engineered and simulated heterostructure, respectively. | ||
Experimental
Silica particles of 260, 285 and 430 nm in diameter were synthesized following the well-known Stöber–Fink–Bohn method33 from tetraethoxysilane (TEOS, Fluka) and ammonia (29% in water, J. T. Baker). Their functionalization with aminopropyltriethoxysilane (Aldrich) was carried out as previously described.23 Multilayer colloidal crystals were fabricated by the Langmuir–Blodgett technique.23,24 The Langmuir monolayer was compressed step-by-step at room temperature (20 ± 1 °C) until a surface pressure of ca. 6 mN m−1 was reached. For the transfer of the monolayer, a dipping speed of 5 mm min−1 was used. Under these conditions, opals consisting of 1, 5 or 10 layers of silica spheres were deposited on glass substrates. The opals were conformally coated with titania in an ALD reactor working in exposure mode. The deposition was done simultaneously on the opals and on a reference p-type Si (001) wafer for thickness measurements. Titanium isopropoxide and acetic acid were used as metal and oxygen precursors, respectively.19 The deposition took place at 200 °C, while the precursor lines were maintained at 80 °C and the purge circuit at 100 °C. The metal and carboxylic acid precursors were kept in reservoirs at 80 and 30 °C, and delivered to the chamber through ALD pneumatic valves. Pure nitrogen was used as the carrier gas with a constant flow of 5 sccm. The deposition parameters were 0.03 s (1 s) for the acid (alkoxide) pulses, the residence and purge time were 20 and 15 s, respectively. The infiltration was done by 30 sets of depositions, each consisting of 20 ALD cycles with a growth per cycle (GPC) of 0.6 Å/cycle. The spectral properties of the opals were measured after each set of depositions by UV-Visible spectrometry in the extinction mode (Jasco V-560 spectrometer) over a range from 350 to 900 nm. The thickness of the as-deposited titania film on the reference Si wafer was checked by X-Ray reflectometry. After complete infiltration of the opals, they were annealed for 4 h at 600 °C in a tubular oven, with a temperature ramp of 10 °C min−1. The pure inverse opal was simply obtained via the removal of the silica template by immersion in a HF bath (3% concentration) during 30 min. The samples were structurally characterized by high resolution scanning electronic microscopy (SEM) prior to and after the complete infiltration, as well as after removing the silica template. High resolution transmission electron microscopy (HRTEM) and electron energy loss spectroscopy (EELS) measurements were performed using a CM200FEG (Philips) microscope operated at 200 kV. The microscope is equipped with a field emission gun and a GATAN Tridiem post-column electron energy loss spectrometer.Simulations were performed in two steps. Firstly, in order to determine the photonic band structure of the various samples, fully-vectorial eigenmodes of Maxwell's equations with periodic boundary conditions were computed by preconditioned conjugate-gradient minimization of the block Rayleigh quotient in a planewave basis, using a freely available software package.34 The eigenfrequencies up to the twelfth band were computed for 100 equally spaced k points along each high frequency direction (XULΓXWK) of the first Brillouin Zone. The irreducible Wigner–Seitz cell (WSC) was divided into 32![[thin space (1/6-em)]](https://www.rsc.org/images/entities/char_2009.gif) 768 segments, defining the spatial resolution. Similar simulations were performed to calculate the photonic local density of states in direct silica opals.35 Secondly, in order to calculate the optical extinction spectra, finite-difference time-domain (FDTD) simulations were performed,36 using a freely available software package with subpixel smoothing for increased accuracy.37 The computational cell, in which the incoming wave propagates along the z direction, has been implemented with periodic boundary conditions in the x and y directions, and perfectly matched layers (PMLs) in the z direction. The resolution of the grid has been refined such that the convergence of the results was ensured. In all simulations, the direct opals have been represented by monodisperse spheres of a given size (285 or 260 nm) and dielectric constant (ε = 2.1) in an arrangement corresponding a face-centered cubic (fcc) lattice.25 In the FDTD simulations, the lattice has been limited to 10 planes normal to the direction [111], in agreement with the planned experimental conditions. The resulting crystal was placed on a substrate with a dielectric constant of 2.3. In order to simulate the growth of titania (amorphous with ε = 5.52, anatase with ε = 7.29) in the pores left by the direct opal during the ALD process, the original silica spheres were surrounded by interpenetrating titania shells of higher radius.
768 segments, defining the spatial resolution. Similar simulations were performed to calculate the photonic local density of states in direct silica opals.35 Secondly, in order to calculate the optical extinction spectra, finite-difference time-domain (FDTD) simulations were performed,36 using a freely available software package with subpixel smoothing for increased accuracy.37 The computational cell, in which the incoming wave propagates along the z direction, has been implemented with periodic boundary conditions in the x and y directions, and perfectly matched layers (PMLs) in the z direction. The resolution of the grid has been refined such that the convergence of the results was ensured. In all simulations, the direct opals have been represented by monodisperse spheres of a given size (285 or 260 nm) and dielectric constant (ε = 2.1) in an arrangement corresponding a face-centered cubic (fcc) lattice.25 In the FDTD simulations, the lattice has been limited to 10 planes normal to the direction [111], in agreement with the planned experimental conditions. The resulting crystal was placed on a substrate with a dielectric constant of 2.3. In order to simulate the growth of titania (amorphous with ε = 5.52, anatase with ε = 7.29) in the pores left by the direct opal during the ALD process, the original silica spheres were surrounded by interpenetrating titania shells of higher radius.
Conclusion
In conclusion, it was demonstrated, both by simulations and experiments, that the impregnation of a direct silica opal by a recently introduced ALD process allows precise control of the optical properties of a photonic crystal. The approach further permits modulation of the photonic band structure and the ΓL pseudo-gap in a controlled manner. This is important for practical applications, such as optical filtering. The agreement between theory and experiments is remarkable and demonstrates the ability of the simulations to make predictive statements. Furthermore, this work demonstrates that the recently introduced ALD approach, based on carboxylic acids as oxygen source, is robust and can be used for the precise coating of nanostructured materials with sub-nanometre thickness control. Finally, it was shown that the combination of the Langmuir–Blodgett technique with ALD permits the controlled engineering of complex structures leading to additional features such as the control of pass bands in opals containing defects.Acknowledgements
This work was partially supported by the European Network of Excellence FAME and the WCU (World Class University) program through the National Research Foundation of Korea funded by the Ministry of Education, Science and Technology (R31-10013). We thank A. Klein from Fritz-Haber-Insitute (FHI) in Berlin, B. Agricole (CRPP) and E. Sellier (Centre de Ressources en Microscopie Electronique, Talence, France) for the TEM cross section preparations, Langmuir–Blodgett experiments and SEM observations, respectively. M.W. acknowledges Prof. R. Schloegl and the Fritz-Haber-Insitute (FHI) in Berlin for using the electron microscope.References
- S. John, Phys. Rev. Lett., 1987, 58, 2486 CrossRef CAS.
- E. Yablonovitch, Phys. Rev. Lett., 1987, 58, 2059 CrossRef CAS.
- J. E. G. J. Wijnhoven and W. L. Vos, Science, 1998, 281, 802 CrossRef CAS.
- H. M. Yates, W. R. Flavell, M. E. Pemble, N. P. Johnson, S. G. Romanov and C. M. Sotomayor Torres, J. Cryst. Growth, 1997, 170, 611 CrossRef CAS.
- S. G. Romanov, N. P. Johnson, A. V. Fokin, V. Y. Butko, H. M. Yates, M. E. Pemble and C. M. Sotomayor Torres, Appl. Phys. Lett., 1997, 70, 2091 CrossRef CAS.
- A. Blanco, E. Chomski, S. Grabtchak, M. Ibisate, S. John, S. W. Leonard, C. López, F. Meseguer, H. Míguez, J. P. Mondla, G. A. Ozin, O. Toader and H. M. van Driel, Nature, 2000, 405, 437 CrossRef CAS.
- Y. A. Vlasov, X.-Z. Bo, J. C. Sturm and D. J. Norris, Nature, 2001, 414, 289 CrossRef CAS.
- F. García-Santamaría, M. Ibisate, I. Rodríguez, F. Meseguer and C. López, Adv. Mater., 2003, 15, 788 CrossRef CAS.
- R. Fenollosa and F. Meseguer, Adv. Mater., 2003, 15, 1282 CrossRef CAS.
- H. Míguez, N. Tétreault, S. M. Yang, V. Kitaev and G. A. Ozin, Adv. Mater., 2003, 15, 597 CrossRef CAS.
- S. H. Park, D. Qin and Y. Xia, Adv. Mater., 1998, 10, 1028 CrossRef CAS.
- J. S. King, D. P. Gaillot, E. Graugnard and C. J. Summers, Adv. Mater., 2006, 18, 1063 CrossRef CAS.
- A. Rugge, J. S. Becker, R. G. Gordon and S. H. Tolbert, Nano Lett., 2003, 3, 1293 CrossRef CAS.
- J. S. King, E. Graugnard and C. J. Summers, Adv. Mater., 2005, 17, 1010 CrossRef CAS.
- Z. A. Sechrist, B. T. Schwartz, J. H. Lee, J. A. McCormick, R. Petstun, W. Park and S. M. George, Chem. Mater., 2006, 18, 3562 CrossRef CAS.
- A. Bielawny, J. Upping, P. T. Miclea, R. B. Wehrspohn, C. Rockstuhl, F. Lederer, M. Peters, L. Steidl, R. Zentel, S. M. Lee, M. Knez, A. Lambertz and R. Carius, Phys. Status Solidi A, 2008, 205, 2796 CrossRef CAS.
- M. Knez, K. Nielsch and L. Niinisto, Adv. Mater., 2007, 19, 3425 CrossRef CAS.
- G. Clavel, E. Rauwel, M.-G. Willinger and N. Pinna, J. Mater. Chem., 2009, 19, 454 RSC.
- E. Rauwel, G. Clavel, M.-G. Willinger, P. Rauwel and N. Pinna, Angew. Chem., Int. Ed., 2008, 47, 3592 CrossRef CAS.
- M.-G. Willinger, G. Neri, E. Rauwel, A. Bonavita, G. Micali and N. Pinna, Nano Lett., 2008, 8, 4201 CrossRef CAS.
- M.-G. Willinger, G. Neri, A. Bonavita, G. Micali, E. Rauwel, T. Herntrich and N. Pinna, Phys. Chem. Chem. Phys., 2009, 11, 3615 RSC.
- I. M. Povey, M. Bardosova, F. C. Dillon, F. Chalvet, M. E. Pemble and K. Thomas, Thin Solid Films, 2008, 517, 811 CrossRef CAS.
- S. Reculusa and S. Ravaine, Chem. Mater., 2003, 15, 598 CrossRef CAS.
- P. Massé, G. Pouclet and S. Ravaine, Adv. Mater., 2008, 20, 584 CrossRef CAS.
- P. Massé, R. A. L. Vallée, J.-F. Dechézelles, J. Rosselgong, E. Cloutet, H. Cramail, X. S. Zhao and S. Ravaine, J. Phys. Chem. C, 2009, 113, 14487 CrossRef CAS.
- Y. A. Vlasov, V. N. Astratov, O. Z. Karimov, A. A. Kaplyanskii, V. N. Bogomolov and A. V. E. Prokofiev, Phys. Rev. B: Condens. Matter, 1997, 55, R13357 CrossRef CAS.
- E. Rauwel, M.-G. Willinger, F. Ducroquet, P. Rauwel, I. Matko, D. Kiselev and N. Pinna, J. Phys. Chem. C, 2008, 112, 12754 CrossRef CAS.
- J. F. Galisteo-López, E. Palacios-Lidón, E. Castillo-Martínez and C. López, Phys. Rev. B: Condens. Matter Mater. Phys., 2003, 68, 115109 CrossRef.
- S. G. Romanov, M. Bardosova, D. E. Whitehead, I. M. Povey, M. Pemble and C. M. Sotomayor Torres, Appl. Phys. Lett., 2007, 90, 133101 CrossRef.
- F. Fleischhaker, A. C. Arsenault, Z. Wang, V. Kitaev, F. C. Peiris, G. Von Freymann, I. Manners, R. Zentel and G. A. Ozin, Adv. Mater., 2005, 17, 2455 CrossRef CAS.
- R. Pozas, A. Mihi, M. Ocaña and H. Míguez, Adv. Mater., 2006, 18, 1183 CrossRef CAS.
- P. Massé, S. Reculusa, K. Clays and S. Ravaine, Chem. Phys. Lett., 2006, 422, 251 CrossRef CAS.
- W. Stöber, A. Fink and E. Bohn, J. Colloid Interface Sci., 1968, 26, 62 CrossRef.
- S. G. Johnson and J. D. Joannopoulos, Opt. Express, 2001, 8, 173 CrossRef CAS.
- R. A. L. Vallée, K. Baert, B. Kolaric, M. Van der Auweraer and K. Clays, Phys. Rev. B: Condens. Matter Mater. Phys., 2007, 76, 045113 CrossRef.
- A. Taflove, S. C. Hagness, Computational Electrodynamics: The Finite-Difference Time-Domain Method, Artech House, Inc., Norwood, MA, 3rd edn, 2005 Search PubMed.
- D. Farjadpour, A. Roundy, M. Rodriguez, P. Ibanescu, J. D. Bermel, S. G. Joannopoulos and G. Johnson, Opt. Lett., 2006, 31, 2972 Search PubMed.
| This journal is © The Royal Society of Chemistry 2010 |
