Probing the metal-homeostatis effects of the administration of chromium(VI) to mice by ICP MS and size-exclusion chromatography-ICP MS
Serhat
Döker
*ab,
Sandra
Mounicou
b,
Mehmet
Doğan
a and
Ryszard
Lobinski
b
aHacettepe University, Chemistry Department, Analytical Chemistry Division, 06532, Beytepe, Ankara, Turkey. E-mail: doker@hacettepe.edu.tr; serchemist@yahoo.com
bCNRS/UPPA, Laboratoire de Chimie Analytique Bio-inorganique et Environnement, UMR 5254, Hélioparc, 2, av. Pr. Angot, 64053 Pau, France
First published on 29th July 2010
Abstract
Concentrations of chromium, copper, iron, manganese and zinc were determined in liver, kidney, brain, lung, heart and testis of mouse following intraperitoneal injection of hexavalent chromium [Cr(VI)] at a single dose of 8.0 mg Cr/kg. As result, chromium concentrations increased ca. 40-fold in liver and kidney and by a factor of 3–5 in all the other tissues. The homeostasis of Cu, Fe, Mn and Zn was also affected. The element molecular weight distribution was evaluated in the cytosols of the different mouse organs by size-exclusion chromatography (Superdex-75) with UV-VIS and ICP-MS detection. The administration of Cr(VI) resulted in differences in the elution profiles of Fe, Mn, Cu and Zn-protein complexes. Bioinduced Mn, Fe and Zn-binding proteins could be detected in some tissues, especially in liver and kidney. Different molecular weight fractions containing chromium were heartcut and submitted to tryptic digestion prior to MALDI MS analysis. Cr-peptide complexes could be obtained both in non-denaturing and in denaturing (in the presence of urea and DTT) conditions. They were isolated by size-exclusion chromatography with a smaller separation range (Superdex Peptide) but could not be identified by MALDI MS.
Introduction
Metal ions occurring in living systems at trace levels play a vital role in the life processes. Zn, Cu, Fe and Mn have a number of functions as enzyme cofactors and structural components of proteins. Insufficient uptake of essential metal ions causes deficiency and affects normal cell functions, but at high concentrations many metal ions can participate in undesirable redox reactions, favor the production of reactive oxygen species, or can bind inappropriately to macromolecules leading to toxic effects. Minor alterations in quantity, form or place of these vital elements may lead to imbalances in the essential metal ion homeostasis associated with several diseases.1–3Chromium, which occurs in two common oxidation states: Cr(III) and Cr(VI), is one of the most interesting transition metals with regard to the role in biology. Not free from controversy,4,5 Cr(III) is considered as an essential element for a proper glucose and lipid metabolism.6–9 On the other hand, Cr(VI) is known to be toxic, carcinogenic, and mutagenic for human and animals and one of the major chemical occupational hazards.10,11
The hazardous effects of Cr(VI) are primarily attributed to it easily permeating the cell walls through anion channels (as chromate and dichromate).10,11 Once having penetrated into the cell, it is reduced to the more stable Cr(III)10–12 by biological enzymes13 and other compounds, such as e.g. ascorbate, glutathione, NADH, and tocopherols.14,15 The reduction in cells and through cell membranes leads to the formation of reactive intermediates, Cr(V/IV),15,16 and free radicals14–16 which may induce oxidative damage to proteins and DNA.14–18
Chromium is expected to affect the concentrations of other essential trace elements,19–21 change their speciation by competitive binding to proteins, and possibly trigger off the synthesis of diverse biological ligands. Although the accumulation of Cr was investigated in some target organs (mostly in kidney and liver), blood and urine of diverse laboratory animals and in occupationally exposed humans,22–26 no studies have focused on effects of the Cr exposure on the essential trace elements metallome and homeostasis. Studies of Cr speciation and fractionation in biological materials have been scarce and concerned bovine liver,27 Cr-enriched yeast,28,29 human and bovine serum.30,31
The objective of this study was to carry out a comparative metallomics32,33 experiment addressing the changes of the distribution of the key essential elements (Cu, Fe, Mn and Zn) in different organs of mice exposed to Cr(VI) stress. To the best of our knowledge, this work is the first in vivo study investigating such effects either on the level of total element concentrations or in terms of their binding to biomolecules as a function of the molecular size.
Experimental
Animals
Male Swiss albino mice (6–7 week old) weighing 35–40 g were maintained under standard laboratory conditions and fed with standard diet and tap water provided ad libitum. The mice were randomly assigned to two treatment groups each consisting of three animals. The first, Cr(VI) administered group, were intraperitoneally (i.p.) injected with K2Cr2O7 at a single dose of 8.0 mg Cr/kg. The second, control group, were injected 0.9% NaCl solution. The experimental design was approved by the Committee for Ethics of Hacettepe University. Mice were cared for in Hacettepe University Experimental Animals Laboratory in accordance with the Guidelines concerning the Care and Use of Laboratory Animals. Mice were sacrificed by cervical dislocation 12 h after overnight fasting. The tissues were dissected, washed with ice-cold saline solution and stored at −80 °C until use.Instrumentation
Chromatographic separations were conducted using a Model 1100 HPLC pump (Agilent, Wilmington, DE). Injections were performed using a Model 7725 valve with a 100-μL injection loop (Rheodyne, Rohnert Park, CA). Separations were carried out using a Superdex 75 HR 10/30 column (optimum separation range of 3–70 kDa) and Superdex peptide 10/30 column (optimum separation range of 100–7000 Da) (Pharmacia Biotech, Uppsala, Sweden). The ICP-MS was Agilent 7500c (Tokyo, Japan) fitted with a Meinhard type nebulizer (Glass Expansion, Romainmotier, Switzerland) and equipped with a collision cell (H2 as collision gas). An in-line UV detector allowed absorbance measurements at 280 nm (proteins) and at 570 nm (Cr(III) d–d transitions). The column exit was directly connected to the ICP-MS nebulizer by means of polyetheretherkethone (PEEK) tubing.A DigiPrep sample digestion system (SCP Science, Courtaboeuf, France) was used for wet ashing of tissue samples. An ultrasonic probe (Branson Ultrasonics Corporation, Danbury, CT) was used to liberate and solubilize the cell content. Cell lysates were centrifuged at 105![[thin space (1/6-em)]](https://www.rsc.org/images/entities/char_2009.gif) 000 g using a HimaCs 120GX ultracentrifuge (Hitachi, Tokyo, Japan). A lyophilizer (Jouan, France) was used for freeze drying of the fractions collected from SEC. During enzymatic digestion, solutions were mechanically shaken using a circulating shaker (Grant OLS-200, Keison Products, Essex, UK). Mass spectra were acquired with a MALDI-TOF mass spectrometer (Applied Biosystems, ON, Canada) equipped with a nitrogen UV-Laser operating at 337 nm. Mass spectra were recorded in reflector mode.
000 g using a HimaCs 120GX ultracentrifuge (Hitachi, Tokyo, Japan). A lyophilizer (Jouan, France) was used for freeze drying of the fractions collected from SEC. During enzymatic digestion, solutions were mechanically shaken using a circulating shaker (Grant OLS-200, Keison Products, Essex, UK). Mass spectra were acquired with a MALDI-TOF mass spectrometer (Applied Biosystems, ON, Canada) equipped with a nitrogen UV-Laser operating at 337 nm. Mass spectra were recorded in reflector mode.
Reagents and materials
Trypsin and DTT (dithiothreitol) from Fluka, NH4HCO3 from Riedel-de Haen and all other reagents from Sigma-Aldrich (Saint-Quentin Fallavier, France) were analytical grade. A Milli-Q system (Millipore, Bedford, MA) system was used to obtain deionized water (18 MΩ cm).Procedures
![[thin space (1/6-em)]](https://www.rsc.org/images/entities/char_2009.gif) 000 g for 30 min at 4 °C. The fat collected on the surface was discarded and the supernatant was separated from the pellet by using a micro pipette. The solution was analysed for the total element concentrations and chromatographed by SEC-ICP MS.
000 g for 30 min at 4 °C. The fat collected on the surface was discarded and the supernatant was separated from the pellet by using a micro pipette. The solution was analysed for the total element concentrations and chromatographed by SEC-ICP MS.
For the in vitro experiment cytosols of control mice organs were spiked to obtain final Cr(III) concentrations of 150 and 200 ng ml−1. The mixture was vortexed and set off for 3 h. A 100-μL aliquot of this solution was analysed by SEC-ICP-MS.
Results and discussion
Effect of the Cr(VI) exposure on the metal homeostasis in mice
Table 1 summarizes the concentrations of Cr, Cu, Fe, Mn and Zn determined in the tissues of mice from the control and Cr-administered groups. The good agreement of the determined values for the TORT-2 CRM with the certified ones validated the analytical method.| Control | Cr-injected | ||
|---|---|---|---|
| Liver | Cr | 0.63 ± 0.03 | 25.01 ± 2.12 |
| Mn | 1.08 ± 0.02 | 0.92 ± 0.07 | |
| Cu | 3.63 ± 0.15 | 3.83 ± 0.19 | |
| Fe | 55.62 ± 2.24 | 85.40 ± 2.32 | |
| Zn | 22.47 ± 0.97 | 21.12 ± 0.19 | |
| Kidney | Cr | 0.37 ± 0.02 | 14.52 ± 0.18 |
| Mn | 1.04 ± 0.03 | 1.09 ± 0.07 | |
| Cu | 3.61 ± 0.17 | 2.95 ± 0.26 | |
| Fe | 68.73 ± 3.48 | 64.66 ± 2.90 | |
| Zn | 15.45 ± 0.50 | 13.97 ± 0.94 | |
| Brain | Cr | 0.24 ± 0.03 | 1.40 ± 0.49 |
| Mn | 0.39 ± 0.01 | 0.65 ± 0.06 | |
| Cu | 2.52 ± 0.09 | 2.01 ± 0.05 | |
| Fe | 17.62 ± 1.93 | 7.19 ± 0.72 | |
| Zn | 13.25 ± 0.75 | 9.85 ± 0.16 | |
| Lung | Cr | 0.40 ± 0.04 | 2.15 ± 0.42 |
| Mn | 0.25 ± 0.06 | 0.30 ± 0.02 | |
| Cu | 1.81 ± 0.10 | 1.37 ± 0.10 | |
| Fe | 85.94 ± 4.23 | 81.10 ± 2.72 | |
| Zn | 20.30 ± 1.67 | 12.80 ± 2.06 | |
| Heart | Cr | 0.70 ± 0.07 | 1.94 ± 0.27 |
| Mn | 0.55 ± 0.06 | 0.48 ± 0.02 | |
| Cu | 3.57 ± 0.16 | 3.88 ± 0.06 | |
| Fe | 245.61 ± 15.95 | 178.85 ± 4.66 | |
| Zn | 13.64 ± 0.49 | 15.73 ± 1.76 | |
| Testicles | Cr | 0.80 ± 0.04 | 2.93 ± 0.46 |
| Mn | 0.31 ± 0.05 | 0.57 ± 0.04 | |
| Cu | 0.78 ± 0.04 | 0.96 ± 0.01 | |
| Fe | 8.12 ± 0.37 | 11.34 ± 0.29 | |
| Zn | 13.14 ± 0.22 | 13.94 ± 1.56 | |
| Certified | Obtained | ||
| TORT-2 | Cr | 0.77 ± 0.15 | 0.73 ± 0.06 |
| Mn | 13.6 ± 1.2 | 13.7 ± 1.4 | |
| Cu | 106 ± 10 | 101 ± 8 | |
| Fe | 105 ± 13 | 101 ± 8 | |
| Zn | 180 ± 6 | 183 ± 20 |
The administration of Cr resulted in many cases in statistically significant (p < 0.05) changes of concentrations of the trace elements determined (Fig. 1). Kidney and liver Cr contents were enriched by a factor of ca. 40 in comparison with control subjects indicates that kidney and liver were found to be the most vulnerable organs for accumulation of this metal. This finding is in agreement with literature studies.35–37 A distinct, 3–5-fold, increase was also observed in other organs (brain, lung, heart and testicles).
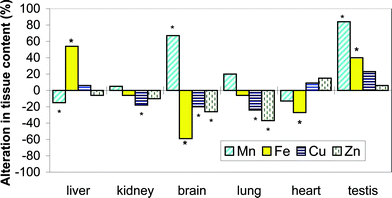 | ||
| Fig. 1 Alterations in the total tissues contents of Mn, Cu, Fe and Zn with Cr(VI) administration (bars marked with an asterisk refer to p < 0.05). | ||
The increase in the Cr concentrations was accompanied by changes in the other element concentrations. Manganese levels in brain and testicles were doubled while a statistically significant (p < 0.05) decrease was observed for the liver Mn level. Iron levels in brain and heart were found to decrease whereas those in liver and testicles increased. The Cr exposure resulted in a decrease in brain Fe level which affected antagonistically the corresponding Mn levels. The Fe/Mn antagonism in brain was previously observed by Garcia and coworkers.38 This study extends this observation to liver, kidney and lung. The possible explanation is that both metal are transported by the same carrier, transferrin, and internalized into the cells by the same transferrin receptors.3 The Cr(VI) administration to mice resulted in the decrease in the Zn content in liver, kidney, brain and lung which can be associated with the fact that this element is essential in many enzymes involved to combat the toxic effects of Cr(VI). This decrease is associated by that of Cu concentration in kidney, brain and lung as previously reported for kidney in rats intraperitoneally37 injected with a near Cr(VI) dose of 5 mg kg−1.
It has been shown that a low dose, 10 mg K2Cr2O7/kg (∼3.5 mg Cr/kg) subcutaneous injection of K2Cr2O7 to rats is unable to induce nephrotoxicity suggesting a threshold of this compound to induce renal damage which induced at a dose of 20 mg K2Cr2O7/kg (∼7 mg Cr/kg).39 On the other side Chmielnicka and coworkers revealed that histopathological changes in the kidneys of rats exposed to toxic metals occur when the toxic metal concentration in the tissue is between 3–30 μg g−1.37 Therefore, an acute sublethal dose of 8.0 mg Cr/kg, chosen in our study, corresponds to renal Cr content of 14.52 μg g−1. Indeed, with Cr(VI) being nephrotoxic, the kidney is a target organ to cope with the Cr(VI) exposure.
Effect of the Cr(VI) exposure on the distribution of the Cr-protein complexes
A deeper insight into the molecular mechanisms of the Cr(VI) intake was attempted by probing the molecular distribution of Cr and the four essential elements in the different tissues. The technique of choice was size-exclusion LC with ICP MS detection validated elsewhere for the analysis for non-covalent metal complexes with bioligands.40,41Extraction conditions were optimized by monitoring the Cr recovery from a liver sample and the Cr signal in SEC-ICP MS as a function of the power of ultrasonic probe and the extraction time. The use of an ultrasonic probe was essential to assure good recoveries. The highest extraction yield was obtained by applying 15 subsequent pulses, at 20% of generated power in the presence of 50 mM NH4Ac (pH 7.4) at 4 °C. Under these conditions the extraction yield was 49% for kidney, 48% for liver, 45% for testis, 44% for brain, 40% for lung, and 31% for heart.
The choice of the column (Superdex-75 with the separation range of 1–70 kDa) was made to assure the highest possible resolution in the molecular range of Cr–protein complexes and to separate the Cr–protein complexes from Cr complexes with low molecular weight (LMW) ligands. Chromium complexes with biomolecules were found to be stable during separation and subsequent freeze-drying of the collected fraction judged by the fact that the chromatograms of collected fractions matched the corresponding part of the original chromatogram. The recovery of Cr from the column was ca. 50% (49.7% for liver and 55.8% for lung tissue). A typical chromatogram (Fig. 2a) shows one broad peak in the LMW range and three minor Cr peaks in the 30–100 kDa range. The void and the 80 kDa peak correspond to those in the UV chromatogram at 280 nm whereas that at 40 kDa can be seen in the visible range (570 nm). The latter corresponds to the d–d transitions of Cr(III)27 [in vivo reduction product of Cr(VI)]10–12 complexed by a protein. The broad peak is that of Cr(VI) judging by the absence (or very small) of absorption at 570 nm. Its elution volume is shifted in comparison with the standard solution which indicates interaction with LMW ligands in the sample.
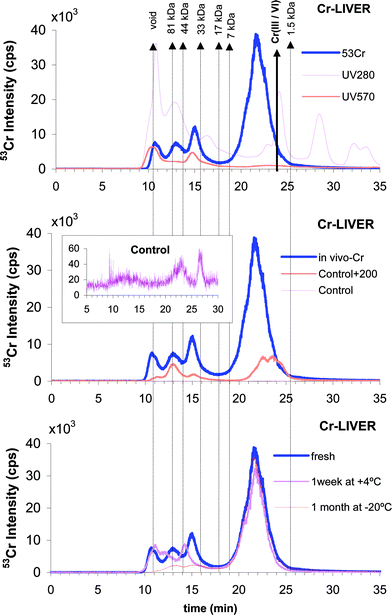 | ||
| Fig. 2 Molecular weight distribution of Cr–biomolecule complexes in mouse liver extracts by SEC. (a) Cr-administered mice: ICP MS detection (53Cr, blue line), UV detection (280 nm, pink line) and VIS detection (570 nm, red line). The red arrow indicates the elution time (te: 23.9 min) of both inorganic Cr(III) and Cr(VI). (b) ICP-MS trace of 53Cr for in vivo Cr-administered group (blue), control group (pink) and control group mice liver cytosol spiked with 200 ng ml−1 Cr(VI) (red). The inset is a closer projection of the pink trace (control group mice liver cytosol). (c) 53Cr ICP-MS trace for in vivo Cr-administered liver samples. Freshly prepared (blue), the extract obtained from the sample stored at −20 °C for 1 month (red) and the extract stored at +4 °C for 1 week (pink). | ||
In order to probe bioinduction of Cr-binding ligands a control sample cytosol was spiked in vitro with Cr(VI) (Fig. 2b). The three peaks in the high molecular weight region are the same as for the in vivo cytosol. The change in proportion of the intensity of the 40 kDa peak which is proportionally higher in the in vivo than in the in vitro chromatogram indicates the bioinduction of this protein. Note that the large Cr peak in the LMW range could not be obtained by spiking the cytosol in vitro which indicates an in vivo synthesis of unknown ligands.
Fig. 2c shows the evolution of the chromatograms as a function of the different sample storage conditions. Considerable evolution of the chromatograms in the HMW range can be seen strongly indicating that the extracts should be analyzed freshly prepared. Note also that changes in the extraction conditions affect the SEC-ICP MS chromatograms. The chosen conditions assured the narrowest and most intense peaks.
The molecular size metal-distribution in the other organs is shown in Fig. 3. Fairly similar distribution to that in liver can be seen for kidney and testicles. In contrast to that the protein fraction in the HMW region was much more abundant in lung, heart and brain and accounted for more than ca. 50% Cr present. A bioinduction of a 40-kDa Cr-binding protein was also observed in lung and two HMW proteins (>80 kDa) were bioinduced in kidney (chromatograms not shown).
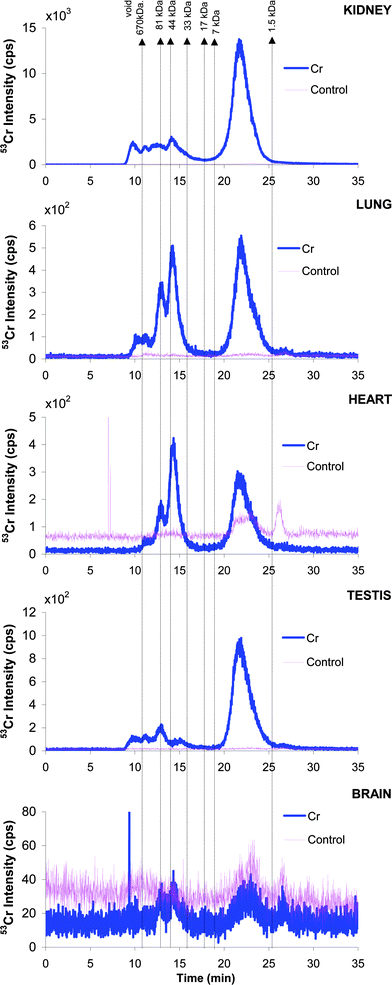 | ||
| Fig. 3 SEC-ICP MS chromatograms (53Cr) for (a) kidney, (b) lung, (c) heart, (d) testicles and (e) brain cytosols. Pink line: control group. Blue line: in vivo Cr-administered group. | ||
Effect of the Cr(VI) administration to mice on the molecular size distribution of Fe, Mn, Cu and Zn
The administration of hexavalent chromium to mouse resulted in some apparent differences in the elution profiles of Fe, Mn, Cu and Zn-protein complexes in the six tissues investigated (Fig. 4). As a result of Cr(VI) exposure, alterations in the total tissue concentration of Fe, Cu and Zn were determined as directly proportional to each other (synergistic alteration, see Fig. 1). It was observed that these synergistic alterations were directly correlated with the changes in the ICP MS intensity in the size-exclusion chromatograms of control and Cr(VI) administered samples (Fig. 4).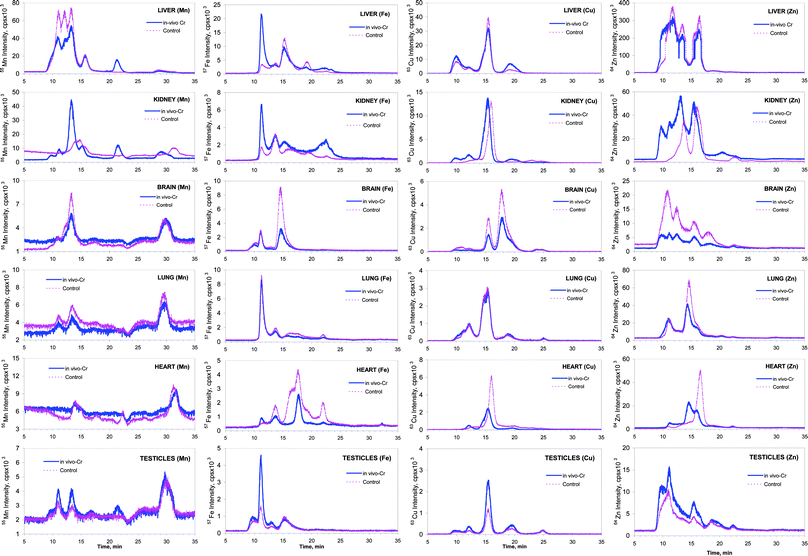 | ||
| Fig. 4 SEC-ICP MS chromatograms (Mn, Fe, Cu and Zn) of the six mouse tissues for control (pink) and Cr-administered (blue) groups. The rows correspond to the different tissues and columns to the different elements. | ||
Fig. 4 shows induction of Mn, Fe and Zn-binding proteins, especially in liver and kidney, as a result of the Cr(VI) administration. For example, the 5-kDa Mn-binding species (te 21 min) observed in vivo was absent in the spiked control sample. Also, the biosynthesis of the 63-kDa Mn-binding protein (te 13 min) was considerably increased in vivo. Increased expression of a HMW Fe-binding protein (te 11 min) took place in liver, kidney and testicles. An induction of one and two HMW Zn-binding proteins was observed in liver and kidney, respectively and a 46-kDa Zn-binding protein (te 14 min) appeared in heart tissue. Elution of the Cu containing fractions shifted to the higher MW region in kidney and heart samples. The reason of such a shift may be a combination of the Cu-binding biomolecule with another factor as a result of Cr(VI) exposure.
Towards the identification of the Cr-binding proteins
In order to identify the bioinduced proteins the corresponding fractions from the Superdex-75 size-exclusion chromatogram were heartcut, freeze-dried and subjected to tryptic digestion in denaturing and non-denaturing conditions prior to MALDI MS analysis. The methodology is illustrated in Fig. 5 for the Cr-binding 40-kDa protein (Fig. 5a).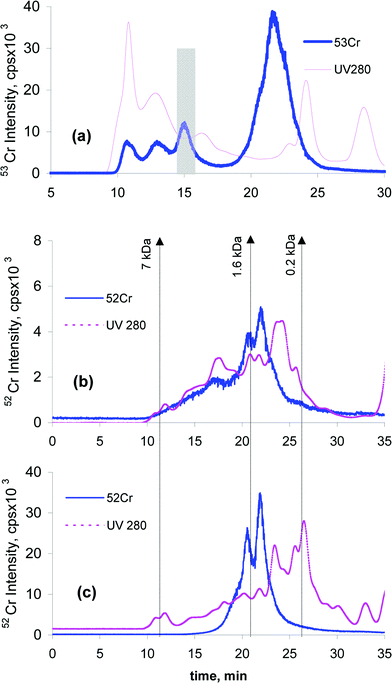 | ||
| Fig. 5 SEC-UV-ICP MS (using Superdex-75 column) chromatogram and the heatcut fraction (shaded) of in vivo Cr-administered group mice liver cytosol (a). UV trace at 280 nm (pink) and 52Cr trace (blue). SEC-UV-ICP MS chromatograms (Superdex peptide column) of 40 kDa Protein fraction after tryptic digestion in denaturing conditions (b); and non-denaturing conditions (c). UV trace at 280 nm (pink) and 53Cr trace (blue). | ||
The Superdex Peptide SEC-UV-ICP MS chromatograms obtained after the tryptic digestion in denaturing (Fig. 5b) and in non-denaturing conditions (Fig. 5c) validate both approaches. Although the Cr-binding was sufficiently strong to preserve Cr-peptide complexes in denaturing conditions, the digestion in non-denaturing conditions is much more efficient leading to a mixture of Cr-binding peptides in the molecular mass range of 0.1–7 kDa.
MALDI-TOF MS analysis of the fractions collected at the peak apexes (Fig. 5c) failed to identify the Cr-binding peptides although many peaks were observed in the mass spectra (not-shown). The main reason was that the high abundance of the major Cr isotope (52Cr 83.8%) did not allow the recognition of the Cr isotopic pattern and this to discriminate the Cr-peptide complexes from other species. The mass accuracy (ca. 25–50 ppm) was insufficient to detect the Cr complexes on the basis of the molecular mass either. It seems that identification would only be possible with high mass accuracy mass spectrometers allowing the determination of the empiric formula of the species producing peaks and thus screening them for the presence of chromium.
Conclusions
The administration of Cr(VI) to mouse results, in addition to the accumulation of Cr in some organs, in statistically significant alterations of Mn, Cu, Fe and Zn levels. The optimized extraction procedure simulating the physiological conditions and experimental design allowed the recovery of non-covalent Cr-complexes. The method allowed the demonstration of the bioinduction of some Cr, Mn, Fe and Zn-binding proteins in different tissues, especially in liver and kidney as a result of Cr(VI) stress. The Cr-complexes could be recovered after the tryptic digestion of the Cr–protein complexes but their identification failed because of the impossibility to distinguish Cr complexes from other peaks in the MALDI-TOF mass spectra. Higher resolution MS allowing the identification of the presence of Cr on the basis of the accurate molecular mass determination is necessary. Alternatively, second dimension native separation techniques,42e.g. native gel electrophoresis, need to be developed to further purify the detected Cr–protein complex in order to allow the identification of the protein ligand by canonical proteomics approaches (e.g. fingerprinting of multiple tryptic peptides).Acknowledgements
S. Döker acknowledges the financial support from the Scholarship Program (2214) for PhD Students granted by TUBİTAK (The Scientific and Technological Research Council of Turkey) and CNRS (Laboratory of Analytical Bioinorganic and Environmental Chemistry in Pau, France). The Aquitaine Region and the FEDER Program are acknowledged for their support to the LCABIE mass spectrometry platform. Hacettepe University Research Fund is acknowledged for support (010D 02601003)References
- N. Nelson, EMBO J., 1999, 18, 4361–4371 CrossRef CAS.
- D. P. Giedroc and A. I. Arunkumar, Dalton Trans., 2007, 3107–3120 RSC.
- W. Zheng, M. Aschner and J. F. Ghersi-Egea, Toxicol. Appl. Pharmacol., 2003, 192, 1–11 CrossRef CAS.
- D. J. Porter, L. W. Raymond and G. D. Anastasio, Arch. Fam. Med., 1999, 8, 386–390 CrossRef CAS.
- J. R. Cronin, Alternative and Complementary Therapies, 2004, 10, 39–42 Search PubMed.
- A. Abraham, B. Brooks and U. Eylath, Metab., Clin. Exp., 1992, 41, 768–771 Search PubMed.
- R. Anderson, M. Polansky, N. Bryden, E. Roginski, W. Mertz and W. Glinsmann, Metab., Clin. Exp., 1983, 32, 894–899 Search PubMed.
- W. Glinsmann and W. Mertz, Metab., Clin. Exp., 1966, 15, 510–519 Search PubMed.
- C. Gürson and G. Saner, Am. J. Clin. Nutr., 1971, 24, 1313–1319 CAS.
- R. Codd, C. T. Dillon, A. Levina and P. A. Lay, Coord. Chem. Rev., 2001, 216–217, 537–582 CrossRef CAS.
- A. Levina and P. A. Lay, Coord. Chem. Rev., 2005, 249, 281–298 CrossRef CAS.
- A. Cavalleri, C. Minoia, P. Richelmi, C. Baldi and G. Micoli, Environ. Res., 1985, 37, 490–496 CrossRef CAS.
- P. J. Jannetto, W. E. Antholine and C. R. Myers, Toxicology, 2001, 159, 119–133 CrossRef CAS.
- Y. Lefebvre and H. Pe′zerat, Chem. Res. Toxicol., 1992, 5, 461–463 CrossRef CAS.
- P. Jones, A. Kortenkamp, P. O’Brien, G. Wang and G. Yang, Arch. Biochem. Biophys., 1991, 286, 652–655 CAS.
- H. Luo, Y. Lu, X. Shi, Y. Mao and N. S. Dalal, Ann. Clin. Lab. Sci., 1996, 26, 185–191 Search PubMed.
- M. J. Molyneux and M. J. Davies, Carcinogenesis, 1995, 16, 875–882 CAS.
- K. C. Tagliari, V. M. F. Vargas, K. Zimiani and R. Cecchini, Environ. Toxicol. Pharmacol., 2004, 17, 149–157 CrossRef CAS.
- H. A. Schroeder and A. P. Nason, J. Nutr., 1976, 106, 198–203 CAS.
- G. J. Li, L.-L. Zhang, L. Lu, P. Wu and W. Zheng, J. Occup. Environ. Med., 2004, 46, 241–248 CrossRef CAS.
- M. S. Yang and M. H. Wong, Biol. Trace Elem. Res., 2001, 80, 67–76 CrossRef CAS.
- D. M. Stearns, J. J. Belbruno and K. E. Wetterhahn, FASEB J., 1995, 9, 1650–1657 CAS.
- M. Krachler, C. Heiselb and J. P. Kretzer, J. Anal. At. Spectrom., 2009, 24, 605–610 RSC.
- F. Borguet, R. Cornelis and N. Lameire, Biol. Trace Elem. Res., 1990, 26–27, 449–460 CAS.
- C. J. Horng and S. R. Lin, Biol. Trace Elem. Res., 1996, 55, 307–314 CrossRef CAS.
- H. J. Raithell, K. H. Schaller, A. Reith, K. B. Svenes and H. Valentin, Int. Arch. Occup. Environ. Health, 1988, 60, 55–66 CrossRef CAS.
- R. L. Peterson, K. J. Banker, T. Y. Garcia and C. F. Works, J. Inorg. Biochem., 2008, 102, 833–841 CrossRef CAS.
- T. Shoeib and Z. Mester, Microchem. J., 2007, 85, 329–340 CrossRef CAS.
- N. Kaewkhomdee, S. Mounicou, J. Szpunar, R. Lobinski and J. Shiowatana, Anal. Bioanal. Chem., 2010, 396, 1355–1364 CrossRef CAS.
- S. Lustig, D. Lampaert, K. D. Cremer, J. D. Kimpe, R. Cornelis and P. Schramel, J. Anal. At. Spectrom., 1999, 14, 1357–1362 RSC.
- C. Tkaczyk, O. L. Huk, F. Mwale, J. Antoniou, D. J. Zukor, A. Petit and M. Tabrizian, J. Biomed. Mater. Res., 2010, 94A, 214–222 Search PubMed.
- H. Haraguchi, J. Anal. At. Spectrom., 2004, 19, 5–14 RSC.
- J. Szpunar, Anal. Bioanal. Chem., 2004, 378, 54–56 CAS.
- V. Vacchina, K. Poleć and J. Szpunar, J. Anal. At. Spectrom., 1999, 14, 1557–1566 RSC.
- İ. İ. Boşgelmez and G. Güvendik, Biol. Trace Elem. Res., 2004, 102, 209–225 CrossRef CAS.
- İ. İ. Boşgelmez, T. Söylemezoğlu and G. Güvendik, Biol. Trace Elem. Res., 2008, 125, 46–58 CrossRef CAS.
- J. Chmielnicka, E. Świetlicka and M. Nasiadek, Ecotoxicol. Environ. Saf., 2002, 53, 20–26 CrossRef CAS.
- S. J. Garcia, K. Gellein, T. Syversen and M. Aschner, Toxicol. Sci., 2006, 95, 205–214 CrossRef.
- M. Gumbleton and P. J. Nicholls, Food Chem. Toxicol., 1988, 26, 37–44 CrossRef CAS.
- J. Szpunar, Analyst, 2000, 125, 963–988 RSC.
- J. A. Caruso, R. G. Wuilloud, J. C. Altamirano and W. R. Harris, J. Toxicol. Environ. Health, Part B, 2006, 9, 41–61 CAS.
- A.-M. Sevcenco, G. C. Krijger, M. W. H. Pinkse, P. D. E. M. Verhaert, W. R. Hagen and P.-L. Hagedoorn, JBIC, J. Biol. Inorg. Chem., 2009, 14, 631–640 CrossRef CAS.
| This journal is © The Royal Society of Chemistry 2010 |
