Simultaneous quantitative monitoring of drug-induced caspase cascade pathways in carcinoma cells
Pravin K.
Naoghare
a,
Hyeon A.
Ki
a,
Seung-Mann
Paek
a,
Yu Kyung
Tak
a,
Young-Ger
Suh
a,
Sang Geon
Kim
a,
Kyeong-Hee
Lee
b and
Joon Myong
Song
*a
aResearch Institute of Pharmaceutical Sciences and College of Pharmacy, Seoul National University, Seoul 151-742, South Korea. E-mail: jmsong@snu.ac.kr; Fax: +82 2 871 2238; Tel: +82 2 880 7841
bApplied Imaging Research Group, Korea Electrotechnology Research Institute, Gyeonggi-Technopark 1271-11, Ansan 426-901, Republic of Korea
First published on 8th December 2009
Abstract
Caspases are the key mediators of apoptosis. The caspase cascade includes a series of events leading to the activation of initiator and downstream caspases in a cell. Analysis of the caspase cascade in intact cells, however, has generally been limited as the simultaneous monitoring of upstream and downstream caspases is not well executed. In an effort to monitor the activation of caspase cascades in an intact cell, high-content cellular imaging that allows simultaneous quantitative monitoring of caspase activation has been developed. This has great significance for the exploration of various cellular caspases involved in apoptotic pathways as possible therapeutic targets in the process of drug discovery. To explore the potential of simultaneous monitoring of caspase-mediated apoptotic pathways, human myeloid leukemia HL-60 cells were treated with SH-03 {(7S,7aR,13aS)-9,10-dimethoxy-3,3-dimethyl-7,7a,13,13a-tetrahydro-3H-chromeno [3,4-b]pyrano[2,3-h]chromen-7-ol} (a newly synthesized candidate), camptothecin or naringenin (agents known to induce apoptosis) with or without caspase inhibitors. SH-03 or naringenin treatment initiated the caspase cascade through an intrinsic apoptotic pathway, whereas camptothecin treatment triggered both intrinsic and extrinsic caspase cascades. We now report a new approach based on uniform threshold intensity distribution that facilitates rapid, quantitative monitoring of drug-induced caspase cascades through multi-spectral and multicolor imaging cytometry.
Insight, innovation, integrationCaspases have been recognized as emerging therapeutic targets in caspase-dependent diseases. The development of new methods to screen intracellular caspases as potential drug targets is difficult because the initiation of complex caspase cascade involves simultaneous activation of initiator and downstream caspases, leading to the distinct modes of cell death. We showed the application of high-content cellular imaging cytometry based on a new approach of uniform threshold intensity distribution that allows simultaneous quantitative monitoring of the caspase cascade in an intact cell. It facilitates rapid, quantitative, live cellular monitoring of drug-induced caspase cascades through multi-spectral and multicolor imaging cytometry. The present study provides important information for the design of new methodologies or the refinement of existing methodologies for efficient therapeutic drug target monitoring. |
1. Introduction
Drug-induced, undesired biological modifications introduce a new level of complexity to caspase-mediated cellular dynamics and transduction mechanisms, thus requiring greater understanding of cell death signaling and regulatory networks.1–3 Various apoptotic signaling mechanisms include factors that lead to leakage of cytochrome C or activation of death signaling molecules such as Fas and caspase-8.4 Due to the potential role of caspases as death signaling molecules, caspases have been studied as therapeutic targets for the treatment of various diseases.5 Caspases can be recognized by their substrate specificities.6,7 Taking advantage of the specificity of caspases6 for their particular substrates, various therapeutic approaches have been developed to study and manipulate caspase activities in cells. In addition, various upstream and downstream caspase activators/inhibitors8 have been synthesized as potential therapeutic tools, targeting specific caspases for the treatment of various diseases.The present work utilizes two commercially available drugs, camptothecin (CAM) and naringenin (NAR), and a newly synthesized drug, SH-03, to examine chemical-induced caspase cascades in human leukemia (HL-60) cells. SH-03 is a rotenoid-containing deguelin analog. Deguelin is an inhibitor of heat shock protein-90 (Hsp90) that was isolated from the African plant Mundulea sericea.9 It is known for its anti-angiogenic effect and its apoptotic effects in a variety of cell types.10 Despite the potential anticancer activity of deguelin in vivo and in vitro, this agent has toxic effects in rats.11 Moreover, long-term or high-dose deguelin treatment might cause Parkinson’s disease-like syndrome in rats.12 These constraints of high toxicity and low efficacy of deguelin prompted us to synthesize new deguelin derivatives with less toxicity and higher efficacy. Recently, we reported the isolation, synthesis and preliminary SAR study of SH-03.12 SH-03 activates intracellular hypoxia-inducible factor 1 subunit α (HIF-1α), Hsp90, the mammalian target of rapamycin (mTOR) and signal transducers and activators of transcription (STAT) proteins in malignant human bronchial epithelium (HBE) and non-small cell lung cancer (NSCLC) cell lines.13 SH-03 also exerts an antibacterial effect, specifically on microorganisms belonging to the genus Helicobacter (e.g., Helicobacter pylori).14 However, the anticancer activity and the dynamics of the caspase-mediated apoptotic cascade induced by SH-03 in myeloid leukemia cells are still unclear. Thus simultaneous monitoring of the drug-induced caspase cascade was studied in leukemia cells using a new drug-screening platform.
False-positive hits often interfere with discovery of aligned molecular targets and pathways after a new drug treatment in antagonistic cell-based screens.15 Thus, appropriate screening modalities are necessary to expand intense drug-development work. Developing new modalities against caspases as therapeutic targets has been limited because the activation of the caspase cascade is a highly complex process that includes a series of biochemical events. Biochemical assays for caspase activity demand comparatively large numbers of lysed cells for analysis. Consequently, the entire caspase activity in a cell population can be measured, but not the intercellular variation in the caspase activity within a population. Elucidation of intercellular variations in caspase activities may differentiate a defective cell (e.g., an oncogenic mutant) from its normal neighbors.16 To explore the mechanisms that underlie such variations, it is desirable to examine caspase activities in individual cells.
In addition to their role as executioners of apoptosis, some caspases are involved in inflammation, in which they act as pro-cytokine activators. Hence, initiation of a caspase cascade does not always lead to apoptosis. In this regard, activation of initiator caspases (caspase-2 and 8) involved in an inflammatory cellular response may be misinterpreted as an apoptotic event if the downstream caspases (e.g. caspases-3) are not monitored simultaneously. Here we demonstrate the simultaneous intracellular monitoring of caspase-mediated apoptotic cascades through high-content cellular imaging cytometry. The mechanism underlying the antineoplastic effects of a newly synthesized drug analog (SH-03) and two commercial drugs (CAM and NAR) were revealed. We report here for the first time that SH-03 triggers death signals in HL-60 cells via the caspase-9-mediated intrinsic apoptotic pathway by inhibiting the PI3K/AKT signal transduction pathway. Through this technology, we hope to mark cellular caspases as therapeutic targets in the process of drug discovery. This will strengthen the development of new methodologies necessary for high-content drug discovery screening.
2. Results
2.1 SH-03 induces DNA fragmentation
A DNA fragmentation assay was carried out to establish the approximate concentration of the newly synthesized drug analog SH-03 for apoptosis and caspase activation assays. Fig. 1Aa shows the effect of SH-03 on DNA fragmentation in HL-60 cells. Concentration-dependent DNA fragmentation was observed with increasing concentration of SH-03. The average gray scale intensities of the DNA smear (and not the DNA band) in each sample (lanes 1–5) were plotted against the relative migrations of DNA smears of the respective samples using MetaMorph image analysis software, (Fig. 1Ab). Initially, the experiments were carried out by taking the lower concentration of SH-03, i.e. 5 and 10 μM. This is due to the fact that the higher concentrations of drug (in this case 25 and 50 μM of SH-03) may induce rapid DNA fragmentation, subsequently contributing to the necrotic mode of cell death. The obtained results showed that the extent of DNA fragmentation at 5 μM SH-03 concentration was approximately similar to the control (Fig. 1Aa). Therefore, to explore the possibility of SH-03 induced apoptosis in HL-60 cells, a 10 μM concentration of SH-03 was used.2.2 SH-03 triggers apoptosis in HL-60 cells
The schematic illustration in Fig. 1B gives the generalized idea of our developed methodology wherein, the simultaneous monitoring of the possible effect of SH-03 on the intrinsic (growth factors, PI3K, AKT, Bad, BCL-xL, mitochondrion, cytochrome C, caspase-9, and caspase-3) and extrinsic (TNF-α, caspase-8, and caspase-3) apoptotic cell-death pathways are shown. It depicts the inhibition of the PI3K/AKT signaling pathway and the induction of caspase-9/caspase-3 by SH-03, a synthetic candidate. SH-03 (chemical structure shown in Fig. 1B) induced the apoptotic cascade in HL-60 cells in a dose-dependent manner. Cellular images correspond to apoptotic cellular events as a function of the caspase substrate reaction. The apoptotic cascade reaction was monitored at different cellular emission wavelengths through coincident acousto-optic tunable filter (AOTF) scanning and CCD imaging. This coincident operation enabled us to monitor a series of cellular responses at the microsecond level to gain insight into the cell death apoptotic mechanism. The appropriate SH-03 concentration (10 μM) predicted from the DNA fragmentation assay was used to monitor apoptosis in HL-60 cells. The optical spectrum represents increasing wavelength as a function of color (blue to red; Fig. 1Ca). Wavelength-based separation through cellular imaging cytometry clearly showed induction of apoptosis after 6 h of SH-03 treatment. The assorted cellular images obtained at the wavelengths of 523 nm and 617 nm indicate annexin V-Qdot- and propidium iodide (PI)-stained cells, respectively. Apoptotic cells exhibited a bright fluorescent ring around the cell membrane (523 nm), showing selective staining of PS moieties on the apoptotic cell membrane by Annexin V-Qdot. Necrotic cells were observed at 617 nm, an emission maxima of PI, indicating selective PI staining in these cells. The superimposed image was taken at the 523 nm and 617 nm AOTF-filtering wavelengths. Both PI- and Annexin-Qdot-stained cells remained visible over the entire emission wavelength range (523 to 617 nm), indicating a gradual progression of apoptosis towards necrosis (red arrow in superimposed image). It should be noted that the yellow fluorescence is not emerging from a problem in filtering the green fluorescence from the yellow fluorescence. The obtained results were further verified through flow cytometric analysis. Fig. 1Cb shows the scatter graphs (FSC–H/SSC–H) and the dot plots of HL-60 cells that were analyzed by flow cytometry after 6 h of SH-03 treatment. The scatter graph shown in the Fig. 1Cb showed that the cells (HL-60) taken for the apoptosis experiment were in good physiological/morphological condition. The round circle (Fig. 1Cb) indicates that the morphology of the cells was round and the cells were in viable condition. The induction of apoptosis after 10 μM SH-03 can also be clearly seen. Analysis of over 10![[thin space (1/6-em)]](https://www.rsc.org/images/entities/char_2009.gif) 000 events revealed 32.5% apoptosis at 10 μM SH-03 compared to untreated cells.
000 events revealed 32.5% apoptosis at 10 μM SH-03 compared to untreated cells.
![(A) Effect of SH-03 on DNA fragmentation in HL-60 cells. Cells were incubated at 37 °C for 6 h in the presence of different SH-03 concentrations. (a) DNA was isolated from the control and treated samples and electrophorized on 0.8% agarose gel. M denotes the marker lane (1 kb DNA ladder), and lanes 1–5 depict results obtained using 0, 5, 10, 25, and 50 μM SH-03, respectively. (b) Line graph indicating the average gray scale intensities of each DNA sample. (B) Structure of SH-03 [(7S,7aR,13aS)-9,10-dimethoxy-3,3-dimethyl-7,7a,13,13a-tetrahydro-3H-chromeno [3,4-b] pyrano[2,3-h]chromen-7-ol], a rotenoid-containing deguelin analog, and a schematic of SH-03-mediated caspase-9 and caspase-3 activation. Hyperspectral fluorescent images (SH-03; 10 μM) were captured using cellular imaging cytometry. Here, 1. Sample, 2. Objective lens (60×), 3. Beam splitter, 4. Prism, 5. Focusing lens, 6. AOTF, 7. Un-diffracted beam, 8. Caspase-3 activation, 9. Caspase-3 and caspase-9 activation. θ. Bragg angle (the angle between diffracted and un-diffracted beam). (C) Representative hyperspectral fluorescent images of HL-60 cells displaying apoptosis triggered by SH-03 (10 μM) after 6 h of treatment (a). Images were taken over a spectral range from 463–688 nm with a total time interval of 60 s. The superimposed image refers to the image at 523 nm and 617 nm by collecting the fluorescence of Qdots and PI, respectively. (b) Scatter and dot plots of HL-60 cells obtained by flow cytometric analysis after 6 h of SH-03 treatment. The lower right quadrant of the dot plot represents early apoptotic cells with PS externalization (annexin V-FITC positive), whereas the upper left quadrant represents propidium iodide (PI)-positive dead cells (necrosis). The lower left quadrant represents control cells negative for both PI and annexin V-FITC.](/image/article/2010/IB/b916481b/b916481b-f1.gif) | ||
| Fig. 1 (A) Effect of SH-03 on DNA fragmentation in HL-60 cells. Cells were incubated at 37 °C for 6 h in the presence of different SH-03 concentrations. (a) DNA was isolated from the control and treated samples and electrophorized on 0.8% agarose gel. M denotes the marker lane (1 kb DNA ladder), and lanes 1–5 depict results obtained using 0, 5, 10, 25, and 50 μM SH-03, respectively. (b) Line graph indicating the average gray scale intensities of each DNA sample. (B) Structure of SH-03 [(7S,7aR,13aS)-9,10-dimethoxy-3,3-dimethyl-7,7a,13,13a-tetrahydro-3H-chromeno [3,4-b] pyrano[2,3-h]chromen-7-ol], a rotenoid-containing deguelin analog, and a schematic of SH-03-mediated caspase-9 and caspase-3 activation. Hyperspectral fluorescent images (SH-03; 10 μM) were captured using cellular imaging cytometry. Here, 1. Sample, 2. Objective lens (60×), 3. Beam splitter, 4. Prism, 5. Focusing lens, 6. AOTF, 7. Un-diffracted beam, 8. Caspase-3 activation, 9. Caspase-3 and caspase-9 activation. θ. Bragg angle (the angle between diffracted and un-diffracted beam). (C) Representative hyperspectral fluorescent images of HL-60 cells displaying apoptosis triggered by SH-03 (10 μM) after 6 h of treatment (a). Images were taken over a spectral range from 463–688 nm with a total time interval of 60 s. The superimposed image refers to the image at 523 nm and 617 nm by collecting the fluorescence of Qdots and PI, respectively. (b) Scatter and dot plots of HL-60 cells obtained by flow cytometric analysis after 6 h of SH-03 treatment. The lower right quadrant of the dot plot represents early apoptotic cells with PS externalization (annexin V-FITC positive), whereas the upper left quadrant represents propidium iodide (PI)-positive dead cells (necrosis). The lower left quadrant represents control cells negative for both PI and annexin V-FITC. | ||
2.3 SH-03 triggers death signals via intrinsic apoptotic cascade
SH-03 treatment triggered caspase-9 and caspase-3 activation in HL-60 cells in a dose-dependent manner (Fig. 2). Caspase-9 activation was observed in 5.39% of cells without inhibitor whereas cells treated with 5, 10, and 25 μM SH-03 demonstrated 72, 79.28, and 79.9% caspase-9 activation, respectively. (Fig. 2A and C). On the other hand, caspase-3 activation in those cells was 6.86, 76, 93.49, and 85.78%, respectively (Fig. 2A and D). To demonstrate the involvement of caspases in SH-03-induced apoptosis, a caspase-2 inhibitor, Z-VDVAD-FMK was used. Pretreatment with caspase-2 inhibitor (20 μM) drastically reduced SH-03-induced caspase-9 and caspase-3 activation (Fig. 2B–D; Table 1). This suggests a major role for caspase-9-mediated signaling in SH-03-induced apoptosis. The reduction in SH-03-induced caspase activation was more pronounced when the pre-incubation time with Z-VDVAD-FMK was increased. Thus caspase-9 is actively involved in the SH-03-triggered intrinsic apoptotic pathway. To explore the possibility of SH-03-induced apoptosis via an extrinsic apoptotic pathway, caspase-8 and caspase-3 activation assays were carried out (Fig. 3A–D). The percent caspase-8 activation was 1.44, 6.83, 8.53 and 10.10% in cells treated with 0, 5, 10 and 25 μM SH-03, respectively. The percent activation of caspase-3 was 5.25, 35.93, 50.12 and 65.61% in these cells, respectively. To get better insight into caspase-8 involvement in the SH-03-triggered caspase cascade, Z-IETD-FMK (a caspase-8 inhibitor) was used. SH-03-induced activation of caspase-8 and caspase-3 in the presence of caspase-8 inhibitor (20 μM) did not significantly change compared to caspase-9 and caspase-3 activation in the presence of caspase-2 inhibitor (Fig. 3B–D; Table 1). These results clearly indicate that the SH-03-triggered apoptotic cascade does not involve caspase-8 activation. The standard deviation from three different measurements at the same concentration was less than 5%. The results obtained by quantitative imaging cytometry were further validated by western blot analysis. Fig. 3E shows the results of western blot analysis of HL-60 cells after 10 μM SH-03 treatment for 12 h. The increased level of cytosolic cytochrome C in treated samples compared to the untreated control was consistent with a SH-03-triggered intrinsic apoptotic cascade in leukemia cells. Caspase-8 activity remained the same in the control as well as in treated cells, consistent with the suggestion that SH-03 did not interfere with the activation or the cleavage of caspase-8 in HL-60 cells. The level of alpha tubulin (positive control) remained the same in treated and untreated cells.![Focused, de-focused and fluorescent images of HL-60 cells acquired by cellular imaging cytometry. Fluorescent images refer to the image at 523 nm or 617 nm. Hyperspectral images depict caspase-9 and caspase-3 activation after SH-03 treatment (12 h) without (A) and with (B) caspase-2 inhibitor. (C and D) Caspase activation and inhibition assays after SH-03 treatment (5, 10 and 25 μM; 12 h). Cells were pre-incubated with fluorogenic (C) caspase-9 [(Ac-LEHD)2-Rh 110] and (D) caspase-3 [(z-DEVD)2-Magic Red] substrates in the presence or absence of caspase-2 inhibitor and were analyzed through cellular imaging cytometry. Error bars represents the percent deviations obtained in three individual measurements.](/image/article/2010/IB/b916481b/b916481b-f2.gif) | ||
| Fig. 2 Focused, de-focused and fluorescent images of HL-60 cells acquired by cellular imaging cytometry. Fluorescent images refer to the image at 523 nm or 617 nm. Hyperspectral images depict caspase-9 and caspase-3 activation after SH-03 treatment (12 h) without (A) and with (B) caspase-2 inhibitor. (C and D) Caspase activation and inhibition assays after SH-03 treatment (5, 10 and 25 μM; 12 h). Cells were pre-incubated with fluorogenic (C) caspase-9 [(Ac-LEHD)2-Rh 110] and (D) caspase-3 [(z-DEVD)2-Magic Red] substrates in the presence or absence of caspase-2 inhibitor and were analyzed through cellular imaging cytometry. Error bars represents the percent deviations obtained in three individual measurements. | ||
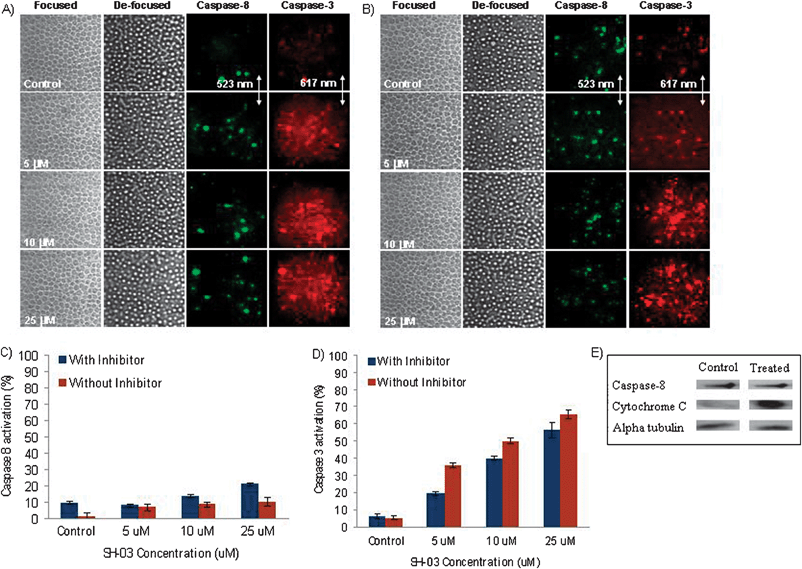 | ||
| Fig. 3 Focused, de-focused and fluorescent images of HL-60 cells (caspase-8 and caspase-3 activation assay) acquired by cellular imaging cytometry after SH-03 treatment (12 h) without (A) and with (B) caspase-8 inhibitor. Fluorescent images refer to the images at 523 nm or 617 nm. Quantitative caspase-8 (C) and caspase-3 (D) activation measurements after SH-03 (5, 10 and 25 μM; 12 h) treatment in the presence or absence of caspase-8 inhibitor. Error bars represents the percent deviations obtained in three individual measurements. (E) Western blot analysis of HL-60 cells after 10 μM SH-03 treatment (12 h). | ||
| Quantitative estimation of caspase activation in intrinsic apoptotic pathway | |||||
|---|---|---|---|---|---|
| Synthetic analog/drug | Concentration | Caspase-9 activation (%) | Caspase-3 activation (%) | ||
| With caspase-2 inhibitor | Without caspase-2 inhibitor | With caspase-2 inhibitor | Without caspase-2 inhibitor | ||
| SH-03 | Control | 9.3 | 5.39 | 7.5 | 6.86 |
| 5 μM | 10.9 | 72.00 | 11.51 | 76.00 | |
| 10 μM | 15.9 | 79.28 | 17.04 | 93.49 | |
| 25 μM | 13.33 | 79.90 | 15.83 | 85.78 | |
| CAM | Control | 8.40 | 8.52 | 12.00 | 14.30 |
| 50 nM | 12.60 | 22.70 | 47.27 | 50.60 | |
| 100 nM | 19.37 | 40.27 | 52.30 | 68.97 | |
| 287 nM | 33.35 | 45.03 | 64.90 | 82.00 | |
| NAR | Control | 5.90 | 6.35 | 5.90 | 4.65 |
| 0.1 mM | 8.27 | 14.27 | 6.73 | 13.83 | |
| 0.25 mM | 14.60 | 22.77 | 17.87 | 31.83 | |
| 0.5 mM | 20.87 | 31.50 | 21.10 | 44.23 | |
| Quantitative estimation of caspase activation in extrinsic apoptotic pathway | |||||
| Synthetic analog/drug | Concentration | Caspase-8 activation (%) | Caspase-3 activation (%) | ||
| With caspase-8 inhibitor | Without caspase-8 inhibitor | With caspase-8 inhibitor | Without caspase-8 inhibitor | ||
| SH-03 | Control | 9.6 | 1.44 | 6.25 | 5.25 |
| 5 μM | 8.02 | 6.83 | 19.49 | 35.93 | |
| 10 μM | 13.79 | 8.53 | 40.15 | 50.12 | |
| 25 μM | 20.90 | 10.10 | 56.41 | 65.61 | |
| CAM | Control | 9.40 | 9.65 | 9.31 | 10.1 |
| 50 nM | 13.60 | 17.70 | 18.27 | 21.60 | |
| 100 nM | 21.37 | 45.27 | 28.30 | 49.97 | |
| 287 nM | 28.35 | 52.03 | 32.90 | 65.00 | |
| NAR | Control | 5.90 | 6.20 | 5.91 | 6.50 |
| 0.1 mM | 6.27 | 9.27 | 6.73 | 9.83 | |
| 0.25 mM | 13.60 | 14.77 | 12.87 | 13.83 | |
| 0.5 mM | 11.87 | 15.50 | 15.10 | 16.23 | |
2.4 Effect of SH-03 and LY294002 on PI3K/AKT activation and phosphorylation
PI3K/AKT activation and phosphorylation assays were carried out to clarify the mechanistic details of the SH-03-induced intrinsic apoptotic pathway in HL-60 cells. Fig. 4 shows the activation and phosphorylation of PI3K and AKT in control, SH-03- (10 μM, 12 h) and LY294002-treated (10 μM, 12 h) cells. LY294002 is a known and specific inhibitor of PI3K and, hence, was compared with SH-03. Compared to the control, both SH-03 and LY294002 inhibited AKT, pAKT (phosphorylated AKT), PI3K, and pPI3K (phosphorylated PI3K) in HL-60 cells. AKT, pAKT, PI3K, and pPI3K activities taken by quantitative imaging cytometry in the control were 80.5%, 69.9%, 84.7%, and 74.7%, respectively, compared to 13.6%, 5.3%, 12.1%, and 7.3%, respectively, in LY294002 treated cells. On the other hand, AKT, pAKT, PI3K, and pPI3K activities in SH-03 treated cells were 6.8%, 8.4%, 3.9%, and 7.9%, respectively. The results indicated that SH-03 blocked the PI3K/AKT signaling pathway by inhibiting the activation and phosphorylation of PI3K and AKT. Furthermore, treatment with SH-03 efficiently inhibited AKT, pAKT, PI3K, and pPI3K activities in HL-60 cells compared to LY294002-treated cells.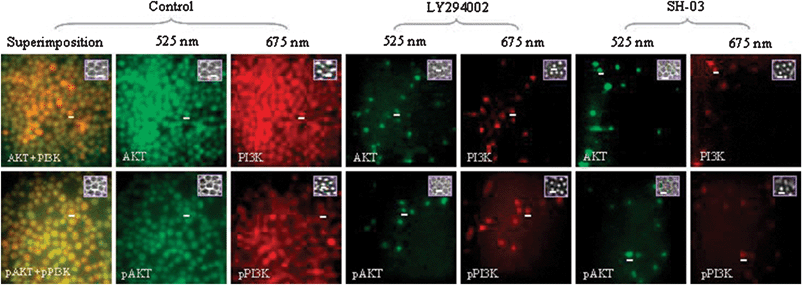 | ||
| Fig. 4 Effect of SH-03 and LY294002 on PI3K/AKT activation and phosphorylation. HL-60 cells were incubated with 10 μM SH-03 or LY294002 for 12 h prior to quantitative imaging cytometry. Multicolor images were taken at 525 nm (AKT and pAKT) and 675 nm (PI3K and pPI3K). Superimposed images indicate the activation of either AKT/PI3K or pAKT/pPI3K. Inset in the fluorescent micrographs depicts de-focused and focused images of the representative cells in the respective samples. | ||
2.5 CAM and NAR induce activation of caspase cascades
To verify the effectiveness of our method for detecting caspase processes, we also used CAM and NAR (agents known to initiate caspase activation). CAM induced caspase-9 activation in HL-60 cells in a dose-dependent manner (Fig. 5A). In the presence of caspase-2 inhibitor, caspase-9 was activated in 8.40, 12.60, 19.37 and 33.35% of control cells and cells treated with 50, 100 and 287 nM CAM, respectively. On the other hand, caspase-3 was activated in 12, 47.27, 52.30 and 64.90% of these cells, respectively (Fig. 5B). Caspase-9 was activated in 5.9, 8.27, 14.60 and 20.87% of control cells and in cells treated with 0.1, 0.25 and 0.5 mM NAR in the presence of caspase-2 inhibitor, respectively (Fig. 5C). Similarly, caspase-3 activation in the control and NAR-treated cells in the presence of caspase-2 inhibitor was 5.90, 6.73, 17.87 and 21.10%, respectively (Fig. 5D). In both sets of experiments, a marked increase in caspase-9 and caspase-3 activation was observed without caspase-2 inhibitor. Thus, changes in the activation of caspase-9 and caspase-3 and their inactivation in the presence of caspase-2 inhibitor suggest that either CAM or NAR triggers death signal via an intrinsic apoptotic pathway. Furthermore, we also examined the possibility that CAM and NAR induce the caspase cascade via an extrinsic apoptotic pathway. CAM induced caspase-8 and caspase-3 activation (Fig. 5E and F) in a dose-dependent manner, whereas NAR did not significantly induce caspase-8 (Fig. 5G, Table 1). Thus, it can be inferred that CAM triggers the caspase cascade via both caspase-9 and caspase-8 activation, whereas NAR triggers the caspase cascade through caspase-9 activation.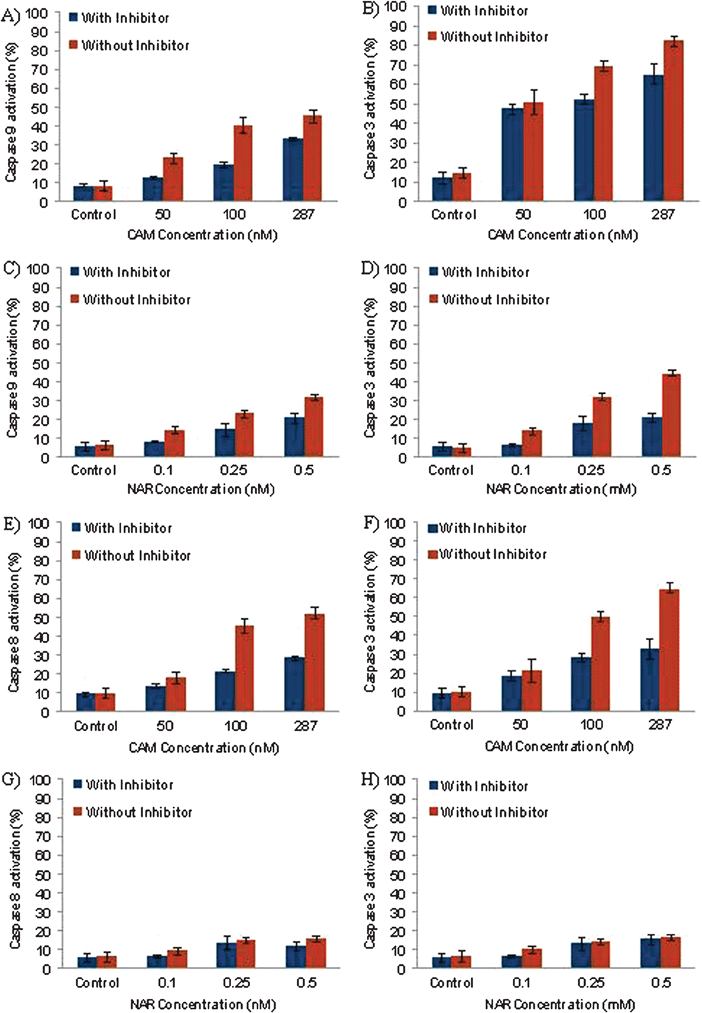 | ||
| Fig. 5 Effect of (A, B) CAM (50, 100 and 287 nM; 12 h) and (C, D) NAR (0.1, 0.25, 0.5 mM; 12 h) on intracellular caspase-9 and caspase-3 activation in HL-60 cells. The cells were pre-incubated with fluorogenic caspase-9 and caspase-3 substrates in the presence or absence of caspase-2 inhibitor and were analyzed using cellular imaging cytometry. (E, F) The effect of CAM (50, 100 and 287 nM; 12 h) and (G, H) NAR (0.1, 0.25, 0.5 mM; 12 h) on the extrinsic apoptotic pathway in HL-60 cells. Before each drug treatment, HL-60 cells were pre-incubated with fluorogenic caspase-8 and caspase-3 substrates in the presence or absence of caspase-8 inhibitor and were analyzed through cellular imaging cytometry. | ||
3. Discussion
Drug molecules differ in their metabolic stability, potency and pharmacokinetic properties.17 According to the pharmacological dogma, the elucidation of a drug’s mechanism reveals possible drug actions in combating the spread of diseases. It also provides drug designers with alternatives when attempting to synthesize novel drug analogs. However, the side-effect profiles of some commercial drugs suggest the potential downside to recognizing drugs’ mechanisms of action along with their mechanistic targets.18 This has prompted many scientists to explore new classes of drug molecules with new modes of action. So, elucidating drug-induced cell death pathways can provide important insights into the mode of drug action.Among the key biochemical executioners of apoptosis, caspases are a group of proteolytic enzymes that sequentially disrupt normal cellular homeostasis by cleaving specific target proteins with structural, regulatory or housekeeping functions.19 Therefore, the cellular kinetics of the caspase cascade and its simultaneous monitoring can be an important way to assess drug efficacy. Insight into the SH-03-triggered caspase cascade can be achieved using quantitative high-content cellular imaging cytometry. Little is known about subsequent alterations in the extent and kinetics of effector caspase activation during apoptosis. Most of the available literature on apoptosis elucidates the mechanistic and regulatory changes in apoptosis after drug treatment. Relatively little is known about the kinetics of the hallmark apoptotic change that occurs during SH-03-induced apoptosis. In the present study, both the initiator and downstream caspases were examined to study the intracellular caspase activation. Our data provide important insight in terms of identifying the appropriate endpoints and the time points for drug-induced apoptosis. This study focused on exploring the cellular cell death pathways using two commercially available drugs (CAM and NAR) and SH-03. SH-03, being a newly synthesized drug analog, was tested to monitor its efficacy against leukemia cells through a DNA fragmentation assay (Fig. 1A). The hallmark of apoptosis is often coincident with internucleosomal DNA fragmentation. Thus, a DNA fragmentation assay was carried out to establish the appropriate drug concentration to be used for apoptosis and caspase activation/inhibition assays.20 SH-03 (Fig. 1B) is a rotenoid-containing deguelin analog. Apart from the application of SH-03 as an antibacterial,14 anti-angiogenic and apoptotic agent,10 its effect on the caspase-mediated apoptotic cascade in myeloid leukemia cells was not understood. Herein, we disclose its application as an anticancer agent and its mode of action against myeloid leukemia cells. The drug-induced cell death pathway was also revealed using the high-content cellular imaging cytometry. Moreover, cellular imaging cytometry may be partly utilized as an alternative analytical tool to commercial flow cytometry for rapid, automated drug screening. Our screening method based on cellular imaging cytometry provides simultaneous monitoring of cellular events. Moreover, cellular imaging cytometry should facilitate quantitative multivariate cellular analysis and eliminate false positive errors as it provides high spectral resolution among the fluorophores as shown in Fig. 1C.
Drugs can induce apoptosis in response to different stimuli. The proposed mechanisms for pro-apoptotic effects include activation of caspases,21 induction of cytochrome C release,22 regulation of protein kinase C isoform expression,23 and inhibition of NF-kB24 and AP-1.25 We elucidated the cell death-signaling mechanism triggered by SH-03 by examining the initial executioner of intrinsic and extrinsic apoptotic pathways. Our results suggest that SH-03 induces apoptosis in HL-60 cells via a caspase-9-mediated pathway (Fig. 2). Caspase 2 is known to play an important role in the induction of apoptosis in most of the cell systems and is most evolutionarily conserved.26 It is an initiator caspase working upstream of the mitochondria-dependent apoptotic cascade. It can be activated after a variety of cellular stresses, e.g. oxidative stress.26 The available literature demonstrates that caspase 2 is an upstream initiator of the JNK-mediated apoptotic signaling cascade in doxorubicin-induced apoptosis.26 Activation of caspase-9 is linked to mitochondrial dysfunction. Induction of stress signaling pathways mediated by Jun N-terminal kinase/stress-activated protein kinase (JNK/SAPK) causes release of cytochrome C from mitochondria, followed by the activation of apaf-1 (apoptosome).27 This in turn cleaves the pro-enzyme of caspase-9 into the active form. Once activated, caspase-9 cleaves procaspase-3 and procaspase-7 and several cellular targets, including poly ADP ribose polymerase.27 The current data reveal drastic reductions in SH-03-induced apoptosis by the caspase-2 inhibitor, Z-VDVAD-FMK. Thus, SH-03-induced apoptosis operates through a caspase-9-mediated cell death pathway. As shown in Fig. 2 and Table 1, SH-03 treatment activates caspase-9 and caspase-3 in HL-60 cells. However, based on the data in Fig. 3 and Table 1, pretreatment with caspase-8 inhibitor (20 μM) did not change caspase-8 activation significantly. Cellular imaging cytometry revealed that SH-03 triggers apoptosis via a caspase-mediated intrinsic pathway. The additional information obtained by western blot analysis (Fig. 3E) showed elevated levels of cytosolic cytochrome C in SH-03-treated cells compared to the control. On the other hand, the activity of caspase-8 remained the same in the control as well as SH-03-treated cells. These observations suggest possible crosstalk between the caspase-8- and cytochrome C-mediated apoptotic pathways does not exist in SH-03-induced apoptosis in HL-60 cells. The time interval of caspase cascade activation is invariably short. Therefore, simultaneous monitoring of caspase-8, caspase-9 and caspases-3 has great potential advantages as it can differentiate between the inflammatory cellular response and the apoptotic stimulus induced by cellular caspases. Hyperspectral fluorescent images taken by cellular imaging cytometry at 15 s (caspase-3; 617 nm) and 45 s (caspase-8 and caspase-9; 523 nm) facilitate the rapid and efficient monitoring of initiator and downstream caspases after drug treatment.
The mechanism through which SH-03 activates caspase-9 is still not known. It has been reported that deguelin treatment arrests the cell cycle in the G2/M phase and induces apoptosis.28 In addition, deguelin is a phosphoinositide-3 kinase (PI3K) inhibitor; it also down-regulates pAKT levels but has minimal effect on the mitogen-activated protein kinase (MAPK) pathway.27 AKT phosphorylates a variety of intracellular substrates including insulin receptor susbtrate-1 (IRS-1), phosphodiesterase-3B (PDE-3B), BAD, and caspase-9. These findings suggest that deguelin activates pro-apoptotic caspases (e.g., caspase-9) by inhibiting the PI3K/AKT-mediated signaling pathway. Inhibition of the PI3K/AKT signaling pathway has significant importance with regard to the induction of apoptosis in several carcinoma cells.29 SH-03, being a deguelin analog, was further tested to elucidate the mechanistic insights of its effect on the PI3K/AKT signaling pathway. The results obtained (Fig. 4) clearly indicate that SH-03 inhibits the activation and phosphorylation of PI3K and AKT more efficiently compared to the known PI3K inhibitor (LY294002) in HL-60 cells. The existence of pAKT in control HL-60 cells followed its gradual inhibition over time in presence of drug has already been reported.30 The obtained results are in line with the above results. Fig. 6 shows the inhibition of PI3K/AKT signaling pathway by SH-03 in detail. Growth factors like VEGF, SCF, HGF, IGF1, and FGF1 trigger the PI3K/AKT signal transduction pathway in eukaryotic cells.31 This includes the growth factor receptor-mediated activation of PI3K followed by its phosphorylation. This in turn phosphorylates membrane phospholipids generating PIP3 from PIP2. PIP3 then activates PDK1 and PDK2 kinases resulting in the phosphorylation of AKT (pAKT). pAKT phosphorylates BAD and promotes cell survival. In this regard, SH-03 plays a crucial role in targeting the two important sites of the PI3K/AKT-mediated signal transduction pathway (i.e., activation and phosphorylation of PI3K and AKT). As a result, inactivated or non-phosphorylated AKT blocks BAD phosphorylation. This in turn blocks BCKXL and activates mitochondrial MMP. This results in the release of cytochrome C and the activation of a series of biomolecules (APAF1, caspase-9 and caspase-3) leading to apoptosis. Quantitative caspase activation and inhibition assays using cellular imaging cytometry and the validation of these assays with commercially available drugs (CAM and NAR) have strengthened the monitoring of cellular cascade events. NAR triggered the caspase cascade through an intrinsic apoptotic pathway, whereas CAM did so through both the intrinsic (caspase-9 activation) and extrinsic (caspase-8 activation) pathways (Fig. 5). These results were in agreement with the available literature.31
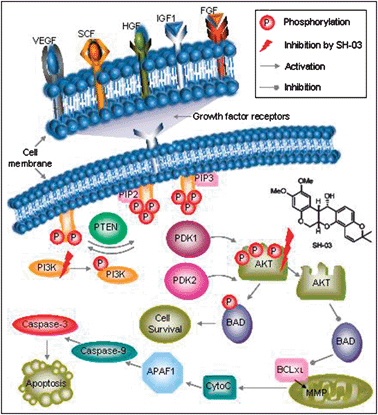 | ||
| Fig. 6 Effect of SH-03 on the AKT/PI3K signal transduction pathway in HL-60 cells. Abbreviations are VEGF: vascular endothelial growth factor; SCF: stem cell factor; HGF: hepatocyte growth factor; IGF: insulin-like growth factor; FGF: fibroblast growth factor; PI3K: phosphatidylinositol-3-kinase; PTEN: phosphatase and tensin homolog; PIP2: phosphatidylinositol-4,5-bisphosphate; PIP3: phosphatidylinositol-3,4,5-bisphosphate; PDK: PIP3-dependent protein kinase; AKT: protein kinase B; BAD: Bcl-2-associated death promoter; BCKXL: transmembrane molecule in the mitochondria; MMP: matrix metalloproteinase; APAF1: apoptotic peptidase activating factor 1; Cyto C: cytochrome C. | ||
Recent investigations are disentangling the complex apoptotic signaling pathways to develop new therapeutic approaches.32,33 Unfortunately, the conventional therapeutic approaches have focused on very few classes of drug target molecules such as regulatory enzymes and small-ligand receptors.34 To overcome this limitation, a more thorough understanding of new drug targets (e.g., initiator and effector caspases) that initiate and execute apoptosis is imperative in designing appropriate therapies. Considering the role of caspases as death effector molecules, a great deal of interest has focused on caspases as targets for various diseases (e.g., Alzheimer’s, Huntington and other neurodegenerative diseases).35 Recently, broad-spectrum caspase inhibitors have been evaluated in various clinical trials to determine their usefulness in delaying or preventing the progression of various diseases.36 However, a few studies point to the application of caspase inhibitors in leukemia therapy. In this regard, elucidation of caspase-mediated cell death dynamics through caspase activation and inhibition assays with quantitative cellular imaging (Fig. 2 and 3) could yield important insight regarding drug-induced cellular response. Here, simultaneous activation of caspase-3, caspase-8 and caspase-9 in the presence or absence of caspase-2 and caspase-8 inhibitors after drug treatment was efficiently monitored through cellular imaging cytometry. The developed protocol enabled us to accomplish rapid, quantitative and automated analysis to elucidate the possible mechanism of drug-induced cellular pathways (i.e., cascade of simultaneous cellular events). The results obtained via cellular imaging cytometry were in line with the data obtained through flow cytometric analysis and thus validated our approach.31 Using two marketed drugs as examples, we demonstrated the effectiveness of our method in detecting caspase cascades and cell death mechanisms. More importantly, the cell death mechanism induced by a newly developed drug (SH-03) was elucidated through cellular imaging cytometry. SH-03, a rotenoid-containing deguelin analog, displayed great potency as an anticancer drug against leukemia cells. Thus, SH-03 holds promise for future therapeutic modalities in leukemia. The developed concept may have fundamental significance in establishing image-based assays for elucidating simultaneous cellular events. It also offers great promise for exploring different targets involved in apoptotic pathways in order to design appropriate drug analogs necessary to strengthen the high-content drug discovery screening approaches.
4. Materials and methods
4.1 Cell culture
HL-60 was obtained from the Korean Cell Line Bank (KCLB®, Seoul, Korea). Cells were cultured in RPMI-1640 medium supplemented with heat-inactivated FBS (10% v/v), sodium bicarbonate (24 mM), penicillin (60 μg ml−1) and streptomycin (100 μg ml−1) in cell-culture flasks (25 cm2, Nunclon™ Delta Surface, Denmark). Cells were grown under standard conditions, i.e., at 37 °C in a humidified incubator containing 5% CO2 (US AutoFlow™, NuAire, Plymouth, MN, USA).4.2 Synthesis of SH-03
To a solution of deguelin (20 mg, 0.051 mmol) in methanol (2 ml), NaBH4 (5.8 mg, 0.15 mmol) was added at 0 °C. The reaction mixture was stirred for 5 min and quenched with water. The mixture was extracted with Et2O and the combined organic layers were washed with brine, dried over MgSO4 and concentrated in vacuo. The residue was purified by flash column chromatography on silica gel (EtOAc:n-hexane = 1:1) to afford 20 mg (99%) of SH-03 as a colorless oil. Synthetic SH-03 {(7S,7aR,13aS)-9,10-dimethoxy-3,3-dimethyl-7,7a,13,13a-tetrahydro-3H-chromeno[3,4-b]pyrano[2,3-h]chromen-7-ol} was identical to authentic data (Takashima, Junko; Chiba, Noriko. PCT WO 9815269); 1H-NMR (CDCl3, 300 MHz) δ 7.01 (d, 1H, J = 8.2 Hz), 6.68 (s, 1H), 6.66 (d, 1H, J = 9.9 Hz), 6.46 (s, 1H), 6.43 (d, 1H, J = 8.2 Hz), 5.58 (d, 1H, J = 9.9 Hz), 4.89 (d, 1H, J = 4.0 Hz), 4.85 (m, 1H), 4.61 (dd, 1H, J = 11.2, 9.9 Hz), 4.24 (m, 1H), 3.84 (s, 3H) 3.83 (s, 3H), 3.38 (m, 1H), 1.41 (s, 3H), 1.39 (s, 3H); IR (KBr) 3465, 2923, 1611, 1513, 1464 cm−1.14
4.3 Drug treatment
Typically, cells (4.5 × 10⁵ cells ml−1) were treated with SH-03, camptothecin (CAM; Sigma St. Louis, MO), or naringenin (NAR; Sigma St. Louis, MO). Before the drug treatment, cells were cultured overnight so that they were in log-phase growth. Stock solutions of 1 mg ml−1 CAM, 1 M NAR and 25 mM SH-03 were prepared in DMSO. Immediately before the experiment, 20 μl of CAM stock solution was added to 2 ml of PBS to yield a 28.7 μM working solution. Cells were treated with various concentrations of drugs, i.e., CAM (50, 100 and 287 nM), NAR (0.1, 0.25, 0.5 mM) and SH-03 (5, 10, 25 and 50 μM) for different time intervals. To obtain better statistical confidence, three independent experiments were performed for each particular drug concentration at a given time interval. During drug treatments, the final DMSO concentration in the cell culture medium was carefully maintained below 0.5% to nullify its toxicity. Controls (cells not exposed to drugs) were prepared by incubating cells with the same DMSO concentration as that for drug-treated cells.4.4 DNA fragmentation assay
Cells were treated with 0–50 μM SH-03 for 6 h. DNA was isolated using a QIAamp DNA Blood Mini Kit (Qiagen, Valencia, CA, USA) as instructed by the manufacturer. Briefly, 20 μl of proteinase K was added to the cell suspension (5 × 10⁶ cells in 200 μl phosphate buffered saline; PBS) followed by the addition of 200 μl AL buffer. The suspension was pulse-vortexed for 15 s, incubated at 56 °C for 10 min, and applied to a spin column in the presence of ethanol (200 μl, 99%). Finally, the column was washed with AW1 and AW2 buffer and the DNA was eluted in AE buffer. DNA samples were subjected to 0.8% agarose gel electrophoresis. The gel was incubated with 20 μg ml−1 RNase A (Sigma-Aldrich, St. Louis, MO, USA) at 37 °C for 3 h before staining with ethidium bromide.4.5 Apoptosis assay through quantitative imaging cytometry and flow cytometry
4.6 Caspase-3, caspase-8 and caspase-9 activation assays
Drug-induced up-regulation and initiation of the caspase enzyme cascade was monitored using quantitative cellular imaging cytometry. Fluorogenic caspase-3 [(z-DEVD)2-Magic Red], caspase-8 [(Z-IETD)2-Rh110] and caspase-9 [(Ac-LEHD)2-Rh 110] substrates were purchased from Immunochemistry Technologies, LLC, Bloomington, MN and AnaSpec, Inc., San Jose, CA. Stock solutions of caspase-3, caspase-8 and caspase-9 substrates were prepared in DMSO as per the manufacturers’ recommendations. After the drug (SH-03, CAM or NAR) treatment, the cells were washed, resuspended in complete RPMI-1640 medium with 40 μM final concentration of caspase-9 or caspase-8 substrate, and incubated at 37 °C in the dark for 2 h. Cells were washed, resuspended in RPMI-1640 medium (without serum) with 20 μM final concentration of caspase-3 substrate, and incubated at 37 °C in the dark for 1 h. Serum-free medium was used to avoid the possible interference of serum proteins during imaging analysis. Cells were excited at 488 nm with a laser and readings were taken over the entire spectral range from 463 nm to 688 nm. The emission maxima for caspase-3, caspase-8 and caspase-9 substrates occurred at 617, 523 and 523 nm, respectively.4.7 Caspase-8 and caspase-2 inhibition assays
To determine the molecular mechanism involved in drug-induced apoptosis, inhibitors against caspase-8 and caspase-2 were used. Cells were pre-incubated with a inhibitor of caspase-8, Z-IETD-FMK (20 μM; BD Pharmingen, CA, USA), for 15 min, followed by treatment with SH-03, CAM or NAR. In another set of experiments, cells were pre-incubated with a caspase-2 inhibitor, Z-VDVAD-FMK (20 μM; Calbiochem, CA, USA), followed by treatment with SH-03, CAM or NAR.4.8 Electrophoresis and western blotting
Cells (1 × 10⁶) were treated with 10 μM SH-03 for 12 h. After the drug treatment, cells were washed with PBS and lysed. Whole cell extracts were prepared by lysis in complete lysis-M solution (Roche, Manheim, Germany). Cell lysates containing an equal amount of protein (60 μg) were used for 12% sodium dodecyl sulfate-polyacrylamide gel electrophoresis (SDS-PAGE). After electrophoresis, proteins were transferred to a polyvinylidene difluoride membrane (BioRad, Hercules, CA, USA), and hybridized with an appropriate primary antibody (anti-cleaved caspase-8; anti-cytochrome C; anti-alpha tubulin; Cell Signaling Technology, Waltham, MA, USA). Blots were blocked in PBS containing Tween 20 (0.05%) and bovine serum albumin (5%) at 4 °C overnight. Primary antibodies were detected after repeated washings of the membrane with PBS-Tween 20, using a 1:10000 dilution of secondary peroxidase-conjugated antibody (Dako Ltd., High Wycombe, Bucks, UK). The membrane was incubated for 2 h at room temperature and washed three times with PBS-Tween. Signals were developed with an enhanced chemiluminescence detection kit (Roche, Basel, Switzerland).
4.9 PI3K/AKT activation and phosphorylation
The possible correlation of PI3K/AKT activation/phosphorylation with SH-03-induced intrinsic apoptotic pathway was assayed. After the 12 h treatment with 10 μM of either SH-03 or with the specific PI3K inhibitor LY294002 (Cell Signaling Technology), HL-60 cells were washed with PBS, fixed with 4% 1-ethyl-3-(3-dimethylaminopropyl)carbodiimide hydrochloride for 15 min, and permeabilized with 0.2% saponin. This was followed by labeling with 1:100 dilutions of the primary antibodies rabbit anti-PI3K and mouse anti-AKT (Cell Signaling Technology) or rabbit anti-p-PI3K (Santa Cruz Biotechnology, Santa Cruz, CA, USA) and mouse anti-p-AKT (Cell Signaling Technology) for 1 h at room temperature. Cells were washed with PBS and labeled with a 1:30 dilution of secondary antibody (goat anti-rabbit IgG-peridinin-chlorophyll-protein complex (PerCP) or goat anti-mouse IgG-FITC; Santa Cruz Biotechnology) for 1 h at room temperature. Finally, cells were washed and subjected to quantitative cellular imaging analysis. Cells were excited at 488 nm and the emission maxima for AKT, pAKT, PI3K, and pPI3K were collected at 525, 525, 675, and 675 nm, respectively.
4.10 Quantitative high-content cellular imaging cytometry
High-content cellular imaging cytometry, data acquisition and quantitative analysis were described in detail in our earlier publication.37 Briefly, drug-treated cells in a cell-culture plate were mounted on the sample stage and excited with a 488-nm beam from an Ar-ion laser (Melles Griot Laser Group, 35-LAP-431-220). The desired Bragg angle (θ) was obtained via a bi-refringent crystal built into the AOTF. The fluorescence beam transmitted from the AOTF was detected by a CCD camera. Fluorescence images at a particular wavelength were obtained via AOTF scanning in the spectral region from 463 nm to 688 nm with a 3.75-nm interval and a scanning rate of 1 wavelength s−1. Image analysis was performed using commercially available software (MetaMorph, Version 7.1.3.0, Molecular Devices).Acknowledgements
This work was supported by a Korea Science and Engineering Foundation (KOSEF) grant funded by the Ministry of Science & Technology (MOST), Government of Korea under the contract number 20090084149 and by the Korea Research Foundation Grant funded by the Korean Government (MOEHRD)(KRF-2008-314-C00239).References
- M. A. LaBarge, C. M. Nelson, R. Villadsen, A. Fridriksdottir, J. R. Ruth, Martha R. Stampfer, O. W. Petersen and M. J. Bissell, Integr. Biol., 2009, 1, 70–79 RSC.
- M. P. Lutolf, R. Doyonnas, K. Havenstrite, K. Koleckar and H. M. Blau, Integr. Biol., 2009, 1, 59–69 RSC.
- A. Abeyewickreme, A. Kwok, J. R. McEwan and S. N. Jayasinghe, Integr. Biol., 2009, 1, 260–266 RSC.
- A. Flemming, Nat. Rev. Drug Discovery, 2008, 7, 18–19 CrossRef CAS.
- J.-M. Lai, C.-H. Hsieh and Z.-F. Chang, J. Cell Sci., 2003, 116, 3491–3501 CrossRef CAS.
- N. A. Thornberry, T. A. Rano, E. P. Peterson, D. M. Rasper, T. Timkey, M. Garcia-Calvo, V. M. Houtzager, P. A. Nordstrom, S. Roy, J. P. Vaillancourt, K. T. Chapman and D. W. Nicholson, J. Biol. Chem., 1997, 272, 17907–17911 CrossRef CAS.
- V. R. Babaev, J. D. Chew, L. Ding, S. Davis, M. D. Breyer, R. M. Breyer, J. A. Oates, S. Fazio and M. F. Linton, Cell Metab., 2008, 8, 492–501 CrossRef CAS.
- V. Viswanath, Y. Wu, R. Boonplueang, S. Chen, F. F. Stevenson, F. Yantiri, L. Yang, M. F. Beal and J. K. Andersen, J Neurosci., 2001, 21, 9519–8 CAS.
- E. P. Clark, Science, 1931, 73, 17–8 CrossRef CAS.
- C. Gerhäuser, W. Mar and S. K. Lee et al., Nat. Med., 1995, 1, 260–6 CrossRef CAS.
- S. H. Oh, J. K. Woo and Y. D. Yazici et al., J. Natl. Cancer Inst., 2007, 99, 949–61 CrossRef CAS.
- P. Caboni, T. B. Sherer and N. Zhang et al., Chem. Res. Toxicol., 2004, 17, 1540–8 CrossRef CAS.
- W. Y. Kim, D. J. Chang and B. Hennessy et al., Cancer Prev. Res., 2008, 1(7) Search PubMed.
- T. Junko and C. Noriko, PCT WO 9815269, 1998.
- D. Wlodkowic, J. Skommer, D. McGuinness, S. Faley, W. Kolch, Z. Darzynkiewicz and J. M. Cooper, Anal. Chem., 2009, 81, 6952–6959 CrossRef CAS.
- M. J. Morgan and A. Thorburn, Cell Death Differ., 2001, 8, 38–43 CrossRef CAS.
- C. Giuliano, M. Jairaj, C. M. Zafiu and R. Laufer, Drug Metab. Dispos., 2005, 33(9), 1319–24 CrossRef CAS.
- C. Zhang, G. Qu, Y. Sun, X. Wu, Z. Yao, Q. Guo, Q. Ding, S. Yuan, Z. Shen, Q. Ping and H. Zhou, Biomaterials, 2008, 29(9), 1233–1241 CrossRef CAS.
- M. W. Al-Rabia, M. G. Blaylock, D. W. Sexton and G. M. Walsh, J. Leukocyte Biol., 2004, 75(6), 1045–55 Search PubMed.
- M. Mazziotti and D. H. Perlmutter, Biochem. J., 1998, 332, 517–524 CAS.
- B. Bellosillo, M. Pique and M. Barragan et al., Blood, 1998, 92, 1406–1414 CAS.
- M. Piqué, G. Mons and J. Gil, FEBS Lett., 2000, 480, 193–196 CrossRef CAS.
- G. H. Zhu, B. C. Wong and E. D. Slosberg et al., Gastroenterology, 2000, 118, 507–514 CrossRef CAS.
- E. Kopp and S. Ghosh, Science, 1994, 265, 956–959 CrossRef CAS.
- B. C. Wong, X. H. Jiang and M. C. Lin et al., Gastroenterology, 2004, 126, 136–147 CrossRef CAS.
- M. Braga, A. P. Sinha Hikim, S. Datta, M. G. Ferrini, D. Brown, E. L. Kovacheva, N. F. Gonzalez-Cadavid and I. Sinha-Hikim, Apoptosis, 2008, 13, 822–832 Search PubMed.
- J. G. Paez and W. R. Sellers, Signal Transduction in Cancer, ed. David Frank, Kluwer Academic Publishers, Boston, 1-6 Search PubMed.
- H.-Y. Lee, Biochem. Pharmacol., 2004, 68, 1119–1124 CrossRef CAS.
- F. Chang, J. T. Lee, P. M. Navolanic, L. S. Steelman, J. G. Shelton, W. L. Blalock, R. A. Franklin and J. A. McCubrey, Leukemia, 2003, 17, 590–603 CrossRef CAS.
- K. Yamada, K. Arita, H. Kobuchi, S. Yamamoto, T. Yoshioka, H. Tamai and K. Utsumi, Biochem. Pharmacol., 2003, 65, 339–348 CrossRef CAS.
- P. Madeddu, Exp. Physiol., 2005, 90, 315–326 Search PubMed.
- J. H. Do, S. Miyano and D.-K. Choi, Biochip J., 3, 190–202 Search PubMed.
- Y. K. Kim and M. Y. Lee, Biochip J., 3, 254–260 Search PubMed.
- V. P. M. van Empel, A. T. A. Bertrand, L. Hofstra, H. J. Crijns, P. A. Doevendans and L. J. De Windt, Cardiovasc. Res., 2005, 67, 21–29 CrossRef CAS.
- C. B. McBride, L. T. McPhail and J. D. Steeves, Expert Opin. Ther. Targets, 1999, 3(3), 391–411 Search PubMed.
- C. J. Zheng, L. Y. Han, C. W. Yap, Z. L. Ji, Z. W. Cao and Y. Z. Chen, Pharmacol. Rev., 2006, 58, 259–279 CrossRef CAS.
- P. K. Naoghare, M. J. Kim and J. M. Song, Anal. Chem., 2008, 80, 5407–5417 CrossRef CAS.
| This journal is © The Royal Society of Chemistry 2010 |